The Bespoke Report Newsletter — 9/10/21
This week’s Bespoke Report newsletter is now available for members.
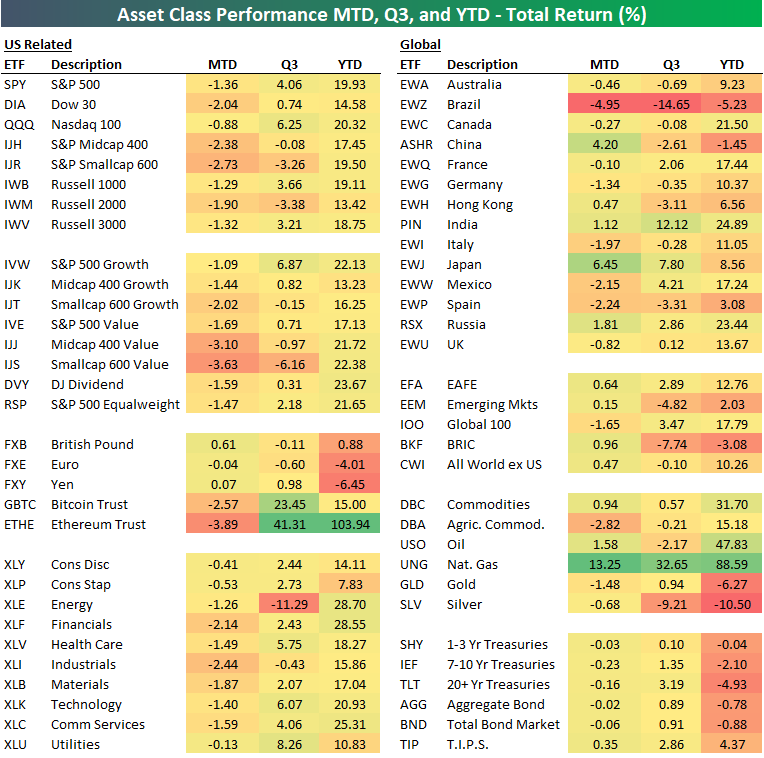
Below we highlight recent performance across a wide range of ETFs representing various asset classes, national equity markets, and US sectors or indices.
To read this week’s full Bespoke Report newsletter and access everything else Bespoke’s research platform has to offer, start a two-week trial to one of our three membership levels.


Daily Sector Snapshot — 9/9/21
US Continues to Gain World Market Cap
The S&P 500 has risen around 20% year to date in 2021, and with that rally in US equities more broadly, the United States has gained 1.83 percentage points of total world market cap. The US has consistently dominated in world market cap over the years, and the gains this year mean that the US currently holds a 43.13% share of total world market cap. Since the S&P 500 pre-COVID peak 2/19/20, right before COVID sent the index into a bear market, the US has added 2.27 percentage points to its share of world market cap. The only other country to have also added a significant share of at least one percentage point during that period is China. In early 2020, Chinese equities accounted for only 8.74%, and that share is now sitting at double digits. Those gains have borrowed heavily from countries like Japan, Hong Kong, and the UK which have all seen their share fall by more than half of one percentage point. For Japan and Hong Kong, those losses have primarily come in 2021 whereas the UK has only shed 0.1 percentage points this year. China similarly has seen its share of world market cap pullback this year as government crackdowns have pushed equities lower. Meanwhile, India has seen a decent gain of 0.38 percentage points. Behind the US, India has gained the most this year. Click here to view Bespoke’s premium membership options.

Beige Book Decelerates As Delta Impact Widens
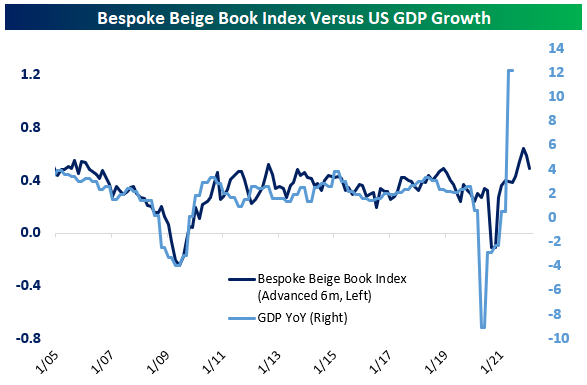
Earlier this week, the Federal Reserve updated its twice-quarterly qualitative assessment of the economy based on conversations with business contacts across the twelve regional districts. For each Beige Book release, we apply a natural language processing algorithm to assess the relative frequency of positive versus negative words, giving us a quantitative comparison of Beige Books over time. As shown in the chart below, our index of Beige Book activity has fallen from record levels recorded back in June to elevated but much more modest levels in September. That’s consistent with the Fed’s description of “moderate” growth thanks to the impact of the Delta variant. Click here to view Bespoke’s premium membership options.

In the second chart below, we show the relationship between GDP growth and our Beige Book Index from above. As shown, the current reading of our index equates to GDP growth of a bit less than 4% YoY. But keep in mind that extreme base effects are still driving wild YoY GDP readings. With that in mind, the Beige Book Index appears to be showing above-trend but decelerating growth, when accounting for base effects of the extremely low GDP reading from Q2 of 2020.
Bespoke’s Morning Lineup – 9/10/21 – Ending the Week on a Positive Note
See what’s driving market performance around the world in today’s Morning Lineup. Bespoke’s Morning Lineup is the best way to start your trading day. Read it now by starting a two-week trial to Bespoke Premium. CLICK HERE to learn more and start your trial.
“No day shall erase you from the memory of time.” – Virgil
After four straight days of losses, the S&P 500 is indicated to end the week on a positive note. That could change between now and the closing bell, but with the PPI report out of the way (mostly inline with expectations), there won’t be much on the data front to derail things. The positive tone in futures this morning is primarily being attributed to news that President Biden and Chinese President Xi spoke on the phone last night for 90 minutes for the first time since February.
Read today’s Morning Lineup for a recap of all the major market news and events from around the world, including the latest US and international COVID trends.
After closing at a record high last Thursday, the S&P 500 heads into the day today riding a four-day losing streak. Despite the string of weak days, the magnitude of the decline has been pretty well contained with a cumulative decline of just under 1%. To put this in perspective, in the entire post-WWII period, the current losing streak represents just the 16th time that the S&P 500 had a 4-day losing streak but was still within 1% of a record closing high.
The log chart below of the S&P 500, where every horizontal line represents a doubling of the index, shows every occurrence mentioned above (there were none prior to 1960). Interestingly, these streaks were pretty much bunched into three different periods. The first was in the 1960s, but from 1968 through 1990, there wasn’t a single occurrence. From 1991 through 1993, there were three occurrences, but then there was another gap of twenty years without a single occurrence! Then, from December 2013 through the present, there have now been six separate streaks.

Start a two-week trial to Bespoke Premium and read today’s full Morning Lineup.
The Bespoke 50 Top Growth Stocks – 9/9/21
Google Searches Going Against Claims Data
Thursday’s release of initial jobless claims saw a new low for the pandemic with unadjusted claims coming in below 300K for a third week in a row. While that data has set new pandemic lows, Google Trends data on searches for “unemployment” are telling another story. The two series have had a tendency to track one another relatively well, and whereas claims are at new lows, the Google Trends score for “unemployment” has surged in the most recent week’s data. The index has risen seven points to 26 which is the highest level since early June, erasing all of the gains from the late spring and summer. As for the disconnect between the two, there are a couple of potential reasons. The first of which is seasonality. As we noted last week, claims typically tend to rise in the early fall through the end of the year. Another potential explanation for the uptick in search interest for unemployment is Hurricane Ida. While searches for the term in Louisiana haven’t seen a large uptick, searches in the state of New York started to surge last Saturday just after the flooding rains hit the region. If that’s the case, look for an uptick in weekly claims next week. Click here to view Bespoke’s premium membership options.

Bespoke’s Weekly Sector Snapshot — 9/9/21
Largest 25 Stocks in the S&P 500, Now vs 10 Years Ago
In the last 10 years, the composition of the largest 25 companies by market cap in the S&P 500 has changed dramatically. Only 40% of the companies that were in the top 25 in 2011 remain there today. Additionally, the sector breakdown has shifted considerably. Sectors like Technology, Communication Services, and Consumer Discretionary have seen increases in their representation in the top 25 while the Energy, Consumer Staples, and Industrial sectors have seen declines.

Of the companies listed on both the 2011 and 2021 lists, the median total return excluding dividends over the last 10 years has been 312.33%, while the mean total return excluding dividends has been 606.65%. Apple ($AAPL), Microsoft ($MSFT), Alphabet ($GOOGL), and Amazon ($AMZN) have seen the largest appreciation of this group and are currently the four largest companies in the index.

As noted above, just 40% (10) of the companies on the list in 2011 made the cut in 2021, and as shown in the table below, while Apple (AAPL) and Microsoft (MSFT) remain in the top four, Exxon Mobil (XOM) and IBM not only fell out of the top four but also the top 25 altogether. Which top companies on the list now won’t be there in 2031? We wish we had a crystal ball!
Whereas the market cap of the S&P 500 has increased by 270% since 2011, the total value of the four largest companies has increased by 673%. In terms of market cap, the four largest companies account for just over 20% of the entire S&P 500’s market cap, and the 25 largest companies make up 49% of the total. In 2011, by contrast, the four largest companies had a weighting of 10% and the 25 largest accounted for about 36% of the total market cap. Click here to view Bespoke’s premium membership options.

Neutral Sentiment Surge
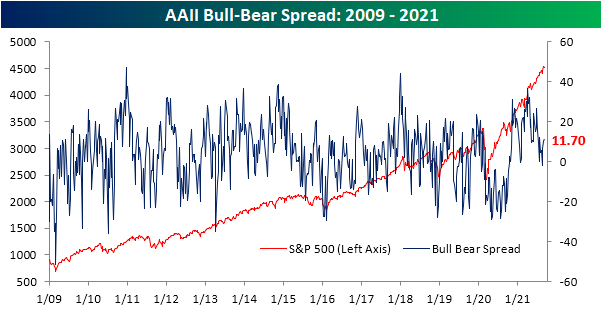
As we noted in today’s Morning Lineup, the S&P 500 has been pulling back over the past week but it has not been a particularly sharp pullback as the index remains within 1% of its all-time high. Bullish sentiment on the other hand has seen a more significant turn lower. The percentage of respondents reporting as bullish to the AAII survey this week fell 4.5 percentage points versus last week. At 38.9%, bullish sentiment is about in line with its historical average of 38%.

That pullback in bullish sentiment was not met with any pickup in bearish sentiment. In fact, bearish sentiment saw an even larger decline, falling 6.1 percentage points to 27.2%. That is the lowest level of bearish sentiment since the end of July.

Given those moves in bullish and bearish sentiment, the bull-bear spread was actually higher this week. The spread rose to 11.7 which is just below the recent high of 12.1 from the final week of July.
Given both bullish and bearish sentiments were lower this week by several percentage points, a large share of respondents shifted to neutral sentiment this week. That reading rose double digits to 33.9%. That is the first time since July 2018 that neutral sentiment has risen at least 10 percentage points in just one week.
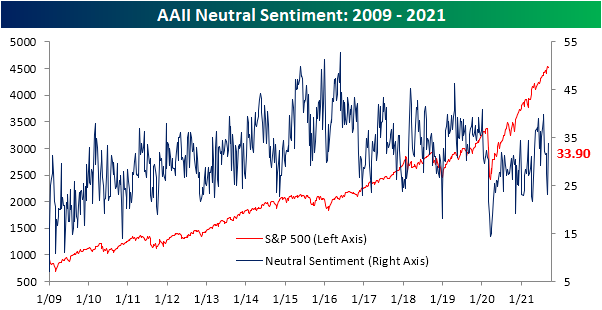
Throughout the history of the AAII survey, it has been rare for neutral sentiment to rise double digits in only one week. Since the survey began in 1987, there have been 85 other times that neutral sentiment has seen such a move. Looking across those instances, the S&P 500 has averaged a move higher over the following months, but returns are typically worse than the norm. Click here to view Bespoke’s premium membership options.
