Natural Gas Prices Explode Higher
Energy commodities have been on an impressive run in 2021. Natural gas has basically gone into orbit recently on supply concerns. The US Natural Gas Fund (UNG) is now up over 100% on the year and 15.65% over the past five days alone. Since its recent closing low on August 18th when UNG was testing its 50-DMA, UNG has rallied 44.88%. Take a look at the one-year price chart for UNG:

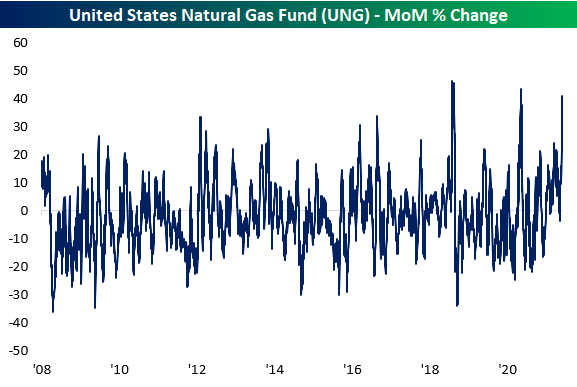
With regards to this particular ETF tracking the commodity, UNG’s one month rate of change is now approaching one of the highest levels on record. As shown in the chart below, UNG’s 40.9% rally over the past month is second only to the 43.6% gain in August of last year and a 46.3% rally in November 2018. As for a slower year-over-year rate of change, things are equally as impressive. Again, only two periods have seen UNG experience larger gains on a rolling 1 year basis. The smaller and more recent of the two was when UNG posted a 66% rally in early December 2018 while the record 68% rally occurred in April 2013.

As could be expected with the explosive moves in natural gas prices, price has become extremely overbought. Today, UNG has moved over 3 standard deviations above its 50-DMA for the first time since June. Prior to that occurrence earlier this spring, there were only a handful of other times that UNG was as elevated above its 50-DMA. Two of those were in the fall of 2018 while the others were in June 2016, January 2014, and June 2010.

Turning to a look at speculator positioning, Friday’s release of the CFTC’s Commitment of Traders report showed the recent rally in natural gas appears to have resulted in shorts closing out their positions. As shown below, open interest has consistently been net short since the early spring. But from the second to last week of August to the most recent update last week, the percent of open interest has gone from 11.97% net short to only 8.18% net short. March 2020 was the last time to have seen positioning jump by as much in a two-week span. Click here to view Bespoke’s premium membership options.

Chart of the Day – Analyst Sentiment
Bespoke’s Morning Lineup – 9/15/21
See what’s driving market performance around the world in today’s Morning Lineup. Bespoke’s Morning Lineup is the best way to start your trading day. Read it now by starting a two-week trial to Bespoke Premium. CLICK HERE to learn more and start your trial.
“I never once considered that it was appropriate to put taxpayer money on the line in resolving Lehman Brothers.” – Henry Paulson
Futures were higher earlier this morning than they are now, and as we’ve seen the last couple of days, equity markets have been struggling to hold onto gains throughout the trading day. The fact that today marks the 13th anniversary of the Lehman bankruptcy also probably doesn’t help sentiment either. Overnight, Retail Sales out of China showed an increase of just 2.5% in August whereas expectations were for a rate of nearly triple that. Chinese Industrial Production also missed estimates, but at 5.3% was much closer to consensus forecasts for growth of just under 6%.
Read today’s Morning Lineup for a recap of all the major market news and events from around the world, including the latest US and international COVID trends.
It wasn’t a good day for stocks in general yesterday, but the banks were one sector that was hit especially hard. Of the six large banks shown below, Wells Fargo (WFC), which Senator Warren actually called for to be broken up yesterday, was the only one to finish the day in positive territory. The other five were down anywhere from 1.36% (Goldman) to 3.14% (PNC). Of the six, the only one that’s currently not in some sort of consolidation mode right now is Goldman which is still within 5% of its 52-week high from just two weeks ago. While trading in the sector has been frustrating lately, look on the bright side, it’s not 13 years ago.

Start a two-week trial to Bespoke Premium and read today’s full Morning Lineup.
Daily Sector Snapshot — 9/14/21
B.I.G. Tips – Russell 2000 Returns – From Fat to Flat
Chart of the Day – Employment and Business Conditions Go In Opposite Directions
Small Businesses Problems
In addition to the various indices regarding small business conditions, the NFIB also surveys firms on what they see as their most pressing issue. In August, by far the most common issue among respondents was labor-related. A record 28% reported quality of labor as the biggest issue; up 2 percentage points versus July. Another 8% reported cost of labor as their biggest issue which was slightly lower than July. On a combined basis, the 36% reporting either cost or quality of labor as their biggest issue was the joint highest reading on record; tying August and November 2019.
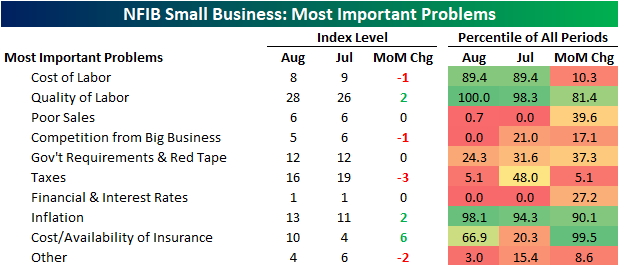

Especially over the past several election cycles, the results of the NFIB survey have tended to be impacted by politics. For example, over the past few presidencies, when a Republican is in office there has been a lower percentage of respondents reporting either taxes or government red tap as their biggest issue and vice versa when a Democrat is in office. That combined reading has now completely reversed the uptick following the election of President Biden as labor concerns have increasingly come into focus.

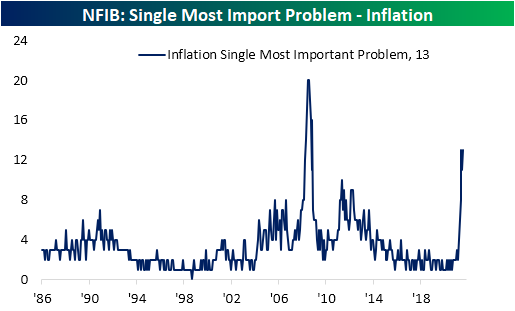
While government-related problems are still the second biggest concern(s) on a combined basis, there have been some other notable moves this month. The percentage of respondents reporting inflation as their biggest issue rose back up to the pandemic high of 13% this month. The Great Recession was the only other period that has seen as elevated a share of respondents seeing price increases as their biggest issue. Additionally, that excludes those reporting cost of labor as an issue.
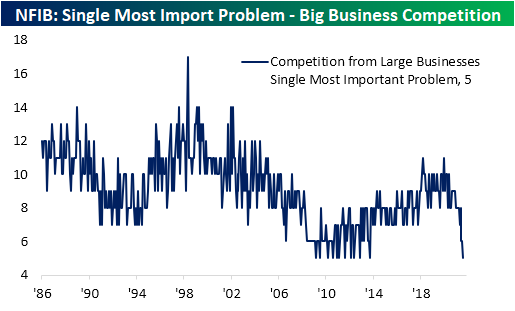
As for what the rise in Inflation as a problem may have borrowed from, one of the most notable has been competition from big business. The reading has seen a gradual decline since the end of 2019, and now at only 5%, it is tied with several months between September 2009 and September 2013 for the lowest reading on record. Click here to view Bespoke’s premium membership options.
Bespoke Stock Scores — 9/14/21
Leveraged ETFs in 2021
Rather than mirror the performance of an index or specific asset, leveraged ETFs seek to provide a multiple of that performance through the use of derivatives and debt; usually double or triple that of the underlying asset. These ETFs are meant to track a multiple of daily performance, meaning long-term performance tends to not equal two or three times that of the unleveraged instrument. The companies offering these leveraged ETF products do explain that they track daily performance only, but even still, many investors overlook that fact and choose to own them longer term.
As for other cons working against the potential for higher returns is that these ETFs could create larger losses, they carry higher fees and expenses, and there is the possibility for those 3x or 2x returns to be downgraded as was the case last year. In other words, with the potential for higher returns, there are plenty of other risks, and these ETFs should be addressed with caution. As always, this is in no way to be taken as a buy or sell recommendation for any leveraged ETF product.
In the charts below, we show the hypothetical performance of $100 invested in a handful of leveraged ETFs as well as a more vanilla unleveraged alternative at the start of the year through Monday’s close. We would also note it is purely price returns before any payouts and/or expenses.
Starting with a look at long-term Treasuries, $100 invested at the start of the year into the iShares 20+ Year Bond ETF (TLT) would be slightly in the red headed into the final quarter of the year. Meanwhile, someone betting on the Direxion Daily 20+ Year Treasury 3x Bull ETF (TMF) would see their $100 fall to $83.24 today. At the low on March 18th, that $100 would have fallen as low as $60. That’s right, a 40% decile for something tracking what is supposed to be a relatively risk-free asset!
As for some other assets, the Energy sector (XLE) and Financial sector (XLF) have been two of the best performing sectors this year. As such, $100 invested into XLE and XLF would have grown to $129.79 and $128.69, respectively. For Energy, the 2x bullish ETF (ERX) would have seen that same $100 turn into $160.78 and the opposite side of that trade (ERY) would see the $100 more than cut in half. The same goes for the 3x bet for Financials. The Direxion Daily Financial Bull 3x Shares ETF (FAS) has nearly doubled YTD in 2021 whereas the inverse bearish ETF (FAZ) would have turned a buck into less than cents.

As briefly mentioned earlier, one other con to leveraged ETFs is higher expenses. For example, taking a look at the S&P 500, $100 invested into the SPDR S&P 500 ETF (SPY) would have become $119.19 year to date before any dividends or expenses. In the case of SPY, expenses are not much of a burden at only 0.09%. While the Direxion S&P 500 3x Bull ETF (SPXL) would have seen that $100 appreciate to an even more impressive $164.82, returns would have been even better if it were not for a nearly 1% expense ratio. As for the bears, if the $100 nearly being cut in half isn’t bad enough, adding insult to injury, the expense ratio is above 1%. For comparison, the median expense ratio of a screen of 1,728 ETFs excluding leveraged ones is only 0.49%. Click here to view Bespoke’s premium membership options.

Bespoke’s Morning Lineup – 9/14/21 – All Eyes on CPI
See what’s driving market performance around the world in today’s Morning Lineup. Bespoke’s Morning Lineup is the best way to start your trading day. Read it now by starting a two-week trial to Bespoke Premium. CLICK HERE to learn more and start your trial.
“There is a time to make money and a time to not lose money.” – David Tepper
There’s not a lot going on in the futures market this morning as investors await the August read on CPI. While the monthly increase is executed to show an increase of 0.4%, it would be the lowest rate of increase since February. Already this morning, the NFIB Small Business Sentiment survey came in modestly better than expected showing continued tightness in US labor markets. That tightness is only likely to get worse in the months ahead as Amazon announced plans to hire an additional 125K employees in the US at starting wages of $18 per hour. Japanese stocks were higher overnight, but Europe has been drifting lower.
Read today’s Morning Lineup for a recap of all the major market news and events from around the world, including the latest US and international COVID trends.
Including yesterday’s gain, the post-Labor Day trading environment has been a weak one for every sector except Energy. As shown in the snapshot below from our Trend Analyzer, the Energy sector is the only one that hasn’t moved down within its trading range over the last five trading days. Weakness during this period has been led by Real Estate and Health Care which are both down over 3%. Despite those losses, they are still both pretty much at or above their 50-day moving averages. The Industrials sector hasn’t been the weakest of the eleven sectors, but its 2.26% decline has been enough to make it the only oversold sector in the S&P 500.

Start a two-week trial to Bespoke Premium and read today’s full Morning Lineup.