Bespoke’s Weekly Sector Snapshot — 10/7/21
The Bespoke 50 Growth Stocks – 10/7/21
Neutral Sentiment Grows
The S&P 500 has found some support in the past week but sentiment readings from AAII have not shown a major shift toward bullish sentiment. The percentage of respondents reporting as bullish this week fell for the second week in a row to 25.5%. That is still above the low of 22.4% from the week of 9/15.

Not only did bullish sentiment fall but so too did bearish sentiment. Whereas over 40% of respondents reported as bears last week, this week, the reading fell to 36.8%. That remains elevated relative to the past year, but it also marks the lowest level of bearish sentiment since September 9th.
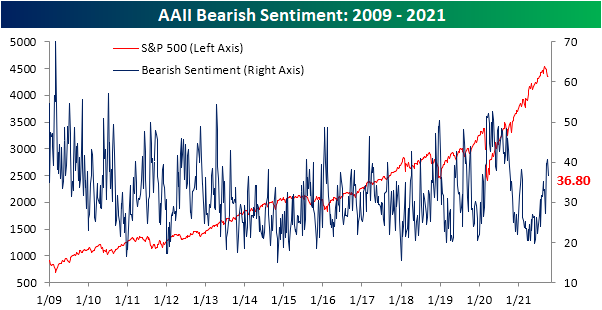
That means neutral sentiment saw a notable jump to 37.7% this week borrowing from the losses to the bullish and bearish camps. Since the start of the pandemic, this week’s reading ranks as the fifth-highest and is 6.3 percentage points above the historical average. That makes for the first time since the end of July that neutral sentiment was the predominant sentiment reading.

Apart from the AAII survey, the National Association of Active Investment Managers’ (NAAIM) Exposure Index also showed a reversal in pessimism this week. The index measures managers’ exposure to US equities. Readings of positive/negative 200 would indicate reporting managers are levered long/short, positive/negative 100 is fully long/short, and zero would be market neutral. Last week, this index hit a low of 55 which was the weakest reading since the spring. This week, we saw a modest bounce to 68.6. While improved, that is still below the spring and summer’s range. Click here to view Bespoke’s premium membership options.
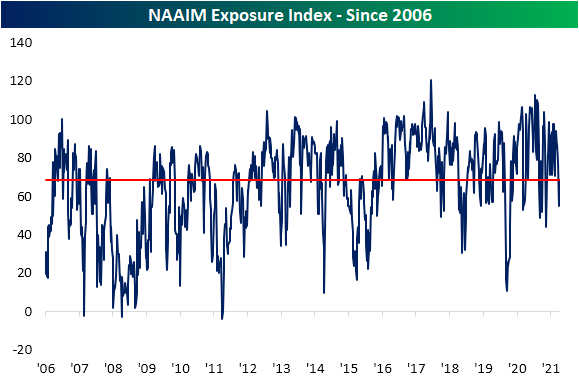
Chart of the Day: Bill Drama
B.I.G. Tips – 200 Day Trading Periods with Highest Correlation
Claims Continue to Unwind Pandemic Era Programs
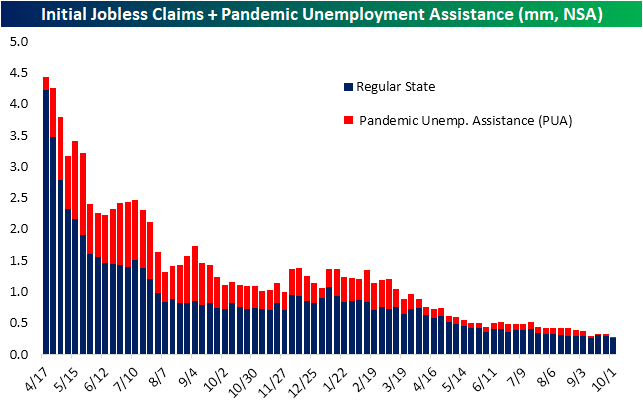
After drifting higher throughout September, seasonally adjusted jobless claims finally saw an improvement this week. Not only did claims drop for the first time since the beginning of September, but the 38K decline from last week’s 2K upwardly revised number exceeded expectations of a 16K decline. Now at 326K, claims are at the second-lowest level of the pandemic behind the September 3rd reading of 312K.

On an unadjusted basis, claims were significantly lower. The non-seasonally adjusted number fell 41.4K to 258.9K. That set a new low for the pandemic and the week over week drop was the largest in ten weeks. With the expiration of pandemic era programs, PUA claims continue to account for an increasingly inconsequential share of initial claims.
We would also note that the large decline in regular state claims goes completely against the usual seasonal pattern for the current week of the year. The 40th week of the year has historically seen claims rise WoW 87% of the time. In fact, that ranks as fourth highest in terms of the week of the year that most consistently have seen claims move higher week over week. In other words, the decline this week was strong enough to totally outpace any seasonal headwind.

Continuing jobless claims also came in below expectations this week. Regular state continuing claims through the week of September 25th fell to 2.714 million from the prior week’s 9K upwardly revised reading of 2.811 million. That makes for the lowest level of claims since March 2020 when claims were less than 1 million lower than current levels.

Including all other programs creates an additional week of lag making the most recent data through September 17th; the second week after the expiration of pandemic era programs’ expiration. Once again, the unwind in programs like PUA and PEUC drove the aggregate decline. Those two programs accounted for a combined 772.56K decline. Since the last week of August, these two programs together have seen claims fall by over 8 million. Those declines on top of nearly every other program also shedding claims means total continuing claims fell to a new low of 4.18 million; roughly a third of the level at the end of August. Click here to view Bespoke’s premium membership options.

Bespoke’s Morning Lineup: 10/7/21 – Up For October
See what’s driving market performance around the world in today’s Morning Lineup. Bespoke’s Morning Lineup is the best way to start your trading day. Read it now by starting a two-week trial to Bespoke Premium. CLICK HERE to learn more and start your trial.
“If everyone is moving forward together, then success takes care of itself.” – Henry Ford
It may not feel like it, but based on where futures are currently trading, the S&P 500 is up over 2% for the month of October and the Nasdaq is up 1.5%. Yesterday, at this exact same time the S&P 500 was flat on the month and the Nasdaq was down over 1%. No one said October isn’t a volatile month! Who knows where things will settle out at the closing bell when markets close the book on the first week of October, but bulls will take the gains however they can get them. While stocks are higher to kick off October, sentiment hasn’t improved as the weekly AAII sentiment survey showed a modest decline in bullish sentiment falling from 28.1% down to 25.5% putting it just three percentage points above its low of 22.4% from three weeks ago.
The economic calendar is light today as Initial and Continuing Jobless Claims are the only two data releases on the calendar, and both came in lower than expected. In terms of Fed speakers, the only one scheduled is Cleveland President Loretta Mester at 11:45 (speaking on policy). With the lack of data, all eyes will likely be on DC again today as lawmakers look to avoid an impasse on raising the debt ceiling. Following McConnell’s offer of a short-term extension yesterday, it appears as though we could be kicking the can down the road so we can take it up again later in the year, but for now, it likely removes a major overhang on the market and economy.
Read today’s Morning Lineup for a recap of all the major market news and events from around the world, including the latest US and international COVID trends.
Equities are off to a positive start for October, but from a technical basis, both the S&P 500 (SPY) and Nasdaq 100 (QQQ) have some work to do in order to break their short-term downtrends. As shown in the charts below, even after taking into account this morning’s gains, both indices have yet to break their short-term downtrends and remain below their 50-day moving averages (442 for SPY and 369 for QQQ).


Start a two-week trial to Bespoke Premium and read today’s full Morning Lineup.
Daily Sector Snapshot — 10/6/21
Gas Prices Bucking Seasonal Trends…Or Are They?
Historically, the strongest part of the year for gas prices has been the summer. From the start of the year through the late spring, prices tend to rise, flattening out over the summer months, then declining from Labor Day into year’s end. We’re now about a month beyond Labor Day and 2021 gas prices are bucking that seasonal trend a bit. AAA’s national average for a gallon of regular gas just hit a new high for the year at $3.22. That is up 42.9% since the start of the year which compares to an average 14% YTD gain at this point of the year from 2005 through 2020. The only two years with larger YTD gains were 2005 and 2009.
The recent move higher in gas prices again goes against the historical seasonal average since 2005, but it is not exactly unheard of for prices to rise slightly from the end of August to the first week of October, and that’s even more true in recent years. As shown in the table below, gas prices consistently fell from August 31 to October 6th from the mid-2000s to 2015, but since then it has not been uncommon to see prices rise in that time frame. In fact, this year’s 1.48% gain since the end of August is middling versus well over 2% gains in 2018 and 2019.

Regardless of seasonal patterns, the recent increases leave the national average for a gallon of regular at the highest level since October 2014 which hurts consumers where it matters most- the wallet. Click here to view Bespoke’s premium membership options.
