The Bespoke Report – September Starting Soggy
This week’s Bespoke Report newsletter is now available for members.
There were a lot of convulsive headlines this week, ranging from Hurricane Ida to the Supreme Court to China to the Delta variant, but markets broadly yawned at events thrown their way. Even a massive miss from payrolls on Friday morning couldn’t derail the slow and steady grind that the US equity markets have trended on for the past several months. That steady grind is also impressive given the huge wave of hawkish Fed speakers in August and the very high likelihood of a taper starting before the end of the year.

In this week’s Bespoke Report, we cover a lot of different topics. Among them:
- Q3 performance drivers.
- The state of COVID in the United States.
- Very low real rates compared to prior economic recoveries.
- The hawkish August in Fedspeak and outlook for tapering.
- Easy financial conditions.
- The US auto industry.
- Policy and political developments in China.
- EM’s breakout.
- German elections.
- Earnings Triple Plays.
- And so much more!
To read this week’s full Bespoke Report newsletter and access everything else Bespoke’s research platform has to offer, start a two-week trial to one of our three membership levels.


Daily Sector Snapshot — 9/3/21
Bespoke’s Weekly Equity/Crypto Sentiment Survey
This week we launched a new weekly crypto sentiment survey to track sentiment towards the space. There are already plenty of stock market sentiment surveys, but sentiment survey data in the crypto space — bitcoin, ethereum, NFTs, etc. — is few and far between.

The new survey will be sent weekly to our Think BIG mailing list that has thousands of potential survey participants that have an interest in financial markets simply based on the fact that they joined our mailing list by visiting our website. We will collect responses from Tuesday through Thursday each week and publish the results on Fridays.
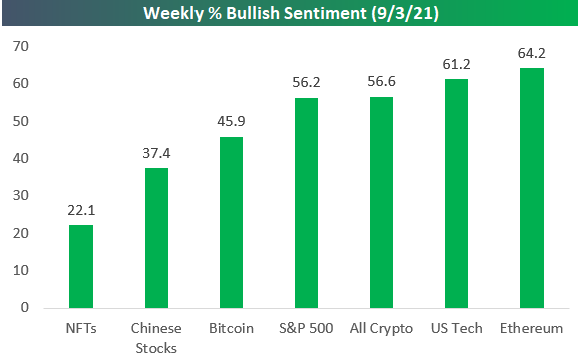
In the survey, we ask whether the participant is “bullish or bearish” on seven things over the next 12 months — 1) the entire crypto space, 2) bitcoin, 3) ethereum, 4) NFTs, 5) the S&P 500, 6), US Tech stocks, and 7) Chinese equities. While we are mainly focused on collecting sentiment towards the crypto space, we thought including sentiment on equities was beneficial so that we could easily compare the two over time.
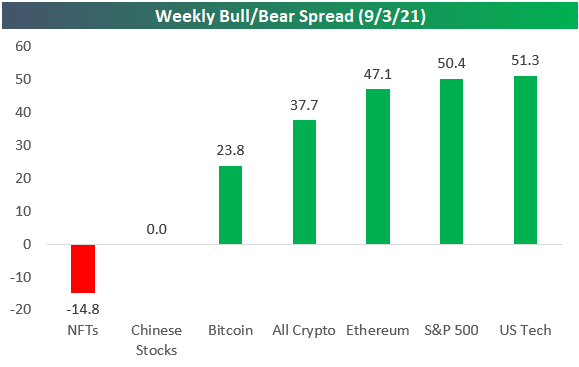
Below are the results from the first run of our new weekly survey. Participants are actually most bullish on US Tech stocks out of this group with a bull/bear spread of +51.3%. The S&P 500 also leaned heavily bullish with only 5.8% of respondents saying they were bearish over the next 12 months.
Sentiment towards the entire crypto sector leans bullish with bulls coming in at 56.6% and bears coming in at 18.9%. The bull/bear spread for bitcoin was +23.8 ppts, while the bull/bear spread for ethereum was considerably higher at +47.1 ppts. Notably, participants are much less bullish on the NFT space with just 22.1% bulls and 36.9% bears. Chinese stocks also saw bulls and bears come in exactly equal at 37.4% each. If you’d like to help us measure crypto sentiment going forward, you can join our Think BIG mailing list and take the survey starting next week. Click here to view Bespoke’s premium membership options.


Gas Prices High Following The Seasonal Pattern Into Labor Day
If you’re planning to drive anywhere this weekend, you may need a wheelbarrow to carry the cash you’re going to need to fill up. According to AAA, based on the national average, a gallon of gas will set you back $3.184. Around the country, though, prices vary widely. In California, where prices are the highest (even higher than Hawaii), the average price of a gallon of gas is $4.40 ($4.71) if you fill up with premium). Mississippi wins the title of lowest average price at just $2.79 per gallon and is one of just 15 states where you can still get a gallon of gas for less than $3. While prices may be high heading into Labor Day weekend, the fact that it still costs less than 13 cents to drive a mile isn’t all that bad (based on the average fuel efficiency of 24.9 miles per gallon), and it’s much cheaper than most other areas of the world.
That being said, prices at the pump are still high whether you look at things from an absolute or relative basis. For the current day of the year, the national average of $3.18 is higher than at this point in any other year since 2014, and forty cents above the median level for this time of year. On a YTD basis, going back to 2005, this year’s increase is the third largest of any other years besides 2009 and 2005. At 41.3%, prices are up by more than double their average YTD increase through 9/3.

On a y/y basis, average gas prices are also up over 40%. For just about any other time that rate of increase would be extreme, but given the y/y increase just hit a record high of 63.98% in May it doesn’t seem that bad.

Now that we’ve established that gas prices are high, it is worth pointing out that despite the high levels, prices have loosely followed the seasonal trend. The chart below compares gas prices this year to a composite of the average YTD increase for every day of the year going back to 2005. Through the end of May, prices were already up 35% YTD, and in the three months since then, prices have still increased, but at a much slower pace. Historically, prices tend to rise through Memorial Day and then level off through Labor Day before steadily declining to close out the year. Like the annual composite, prices dipped into the end of August this year and have spiked into Labor Day weekend. With respect to this year, increases have been exaggerated due to Hurricane Ida, but if history is any guide, drivers should start to see some relief in the final four months of the year. Click here to view Bespoke’s premium membership options.

And Then There Was One…Chicago
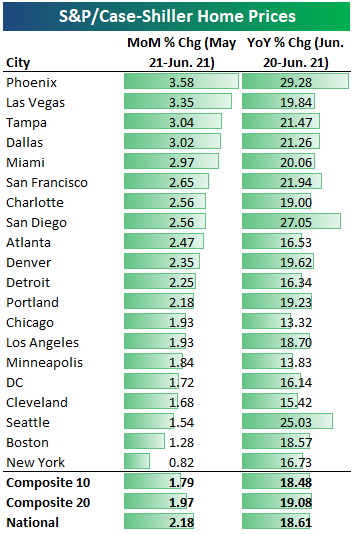
The monthly S&P/Case-Shiller home price numbers for June were published earlier this week and showed a continued surge in home prices. As shown below, 12 of 20 cities tracked saw month-over-month gains of more than 2%, while Phoenix, Las Vegas, Tampa, and Dallas saw MoM gains of 3%+. New York was the only city that failed to see a MoM gain of more than 1%.
On an annual basis, the composite indices were up ~19%, while Phoenix was up the most at +29.3%. San Diego ranked 2nd at +27.05% followed by Seattle in third at +25.03%.
We’ve been waiting to see how long it would take for all of the cities tracked by S&P/Case-Shiller to eclipse the highs in home prices that were made during the housing bubble of the mid-2000s. While many cities like Denver and Dallas passed their prior all-time highs as long ago as 2013, some cities like New York, Miami, Las Vegas, and DC didn’t make new all-time highs until recently after the pandemic hit.
Below is a look at where home prices currently stand relative to their prior housing bubble highs. Every single city except one — Chicago — has now eclipsed its mid-2000s highs. Las Vegas was the most recent to make a new all-time high in June. Prices in Vegas are now 2% above where they were at their peaks in late 2006. And in 2006, prices had gotten pretty ridiculous in Vegas!
While Chicago is the only city tracked by S&P/Case-Shiller where prices are still in the red versus prior highs, they’re now only 1% away from a new high, and we’ll probably see that new high when the next Case-Shiller report is released later this month.
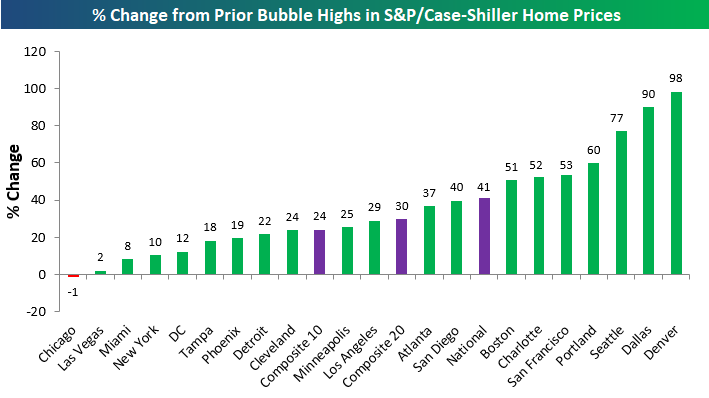
Below are S&P/Case-Shiller home price index charts for all of the cities tracked along with the three composite indices. Chicago is the only city not currently trading at an all-time high.


Finally, the chart below shows how much home prices have risen since COVID hit. Most cities have seen home prices rise between 19-23%, but Phoenix, San Diego, and Seattle have been standouts with gains of more than 30%. On the lower end of the spectrum, New York and Chicago have seen the smallest gains at 17%. Click here to view Bespoke’s premium membership options.

S&P/Case-Shiller sources: FRED website or here at S&P Global.
Netflix (NFLX) Unbuffers
Is there anything more annoying than when you sit down to watch a show or movie on Netflix (NFLX) and you get the dreaded buffering symbol where the show pauses until the connection is strong enough to load? A lot of people around the country from the coast of Louisianna right up north through the coast of Maine are likely experiencing that buffering a bit more frequently as Hurricane Ida disrupted power and internet connections. Investors in Netflix (NFLX) stock have been no strangers to the buffering phenomenon recently as the stock has been stuck in a trading range seemingly as long as the movie “The Never Ending Story.” From July of last year through Wednesday, NFLX traded in a range within a high of $593.29 to a low of $458.60 for a spread of 29.4%. Yesterday, though, NFLX finally broke out of that range trading as high as $598.76.
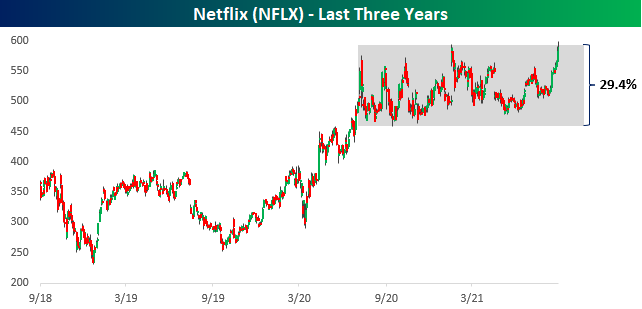
29.4% may not sound like too small of a range, especially for a stock with a market cap of over $250 billion. For a stock like NFLX, though, 29.4% was the narrowest one-year range the stock had ever traded within. The chart below shows the historical one-year trading range for NFLX since its IPO in 2002. Prior to this year, NFLX had never traded within a range of 50% or less over a rolling one-year period, but as of this week, the range had narrowed to nearly half that. Just like with the movies, though, usually when it buffers once, it runs through a number of fits and starts before it starts running smoothly again. Similarly, even though NFLX started to move yesterday, today it has drifted right back into the range it was trading in all this time. Click here to view Bespoke’s premium membership options.

Bespoke’s Morning Lineup – 9/3/21 – Weak Jobs Into Labor Day
See what’s driving market performance around the world in today’s Morning Lineup. Bespoke’s Morning Lineup is the best way to start your trading day. Read it now by starting a two-week trial to Bespoke Premium. CLICK HERE to learn more and start your trial.
Who controls the memes controls the universe.” – Elon Musk
Heading into a weekend where we celebrate the contribution of American workers to the economy, there are going to be fewer than expected workers to celebrate after the release of the August employment report. While expectations were for an increase of more than 700K jobs during the month, the actual increase was a paltry 235K. The one bright spot to the report was average hourly earnings which rose more than expected (0.6% vs 0.3%). While the rate of increase in jobs was a disappointment, for investors fearing the Fed taper, ‘substantial further progress’ in the labor market may take longer to achieve than previously thought.
Read today’s Morning Lineup for a recap of all the major market news and events from around the world, including the latest US and international COVID trends.
As just about everybody knows at this point, September is a seasonally weak time of year for the equity market, and the gauges from our Stock Seasonality tool below illustrate this trend. Over the last ten years, the week following the close on 9/3 has seen a median decline of 0.43% which ranks in the 15th percentile relative to all other periods. For the upcoming month, the S&P 500’s median gain is just 0.08% which doesn’t rank much better (22nd percentile).
As the old cliche goes, though, short term pain is often followed by longer-term gains, and in the three months that follow the close on 9/3, the S&P 500’s median performance over the following three months has been a gain of 6.09% which ranks in the 97th percentile relative to all other three month periods. Like April showers bringing May flowers, September pain has often been followed by Q4 gains.

Start a two-week trial to Bespoke Premium and read today’s full Morning Lineup.
Bespoke’s Weekly Sector Snapshot — 9/2/21
Gun Background Checks Return to More Normal Range
In a sign that overall levels of anxiety across the United States may be receding, the pace of background checks for the purchase of firearms has come crashing down from record-high levels. From a peak of 4.69 million in March, background checks fell to 2.72 million in August. That level is still the second-highest total for the month of August on record, but after a steady surge with the onset of COVID and the riots across the country last summer, there has been a sharp decline in total checks over the last few months.

On a y/y basis, background checks have really swung from one extreme to the other. From last July to this June, total background checks experienced a 100 percentage point peak to trough swing falling from 79.2% down to a decline of 22.3%. Over the last two months, the rate of decline has gotten less bad, but it is still at negative 12.8%.

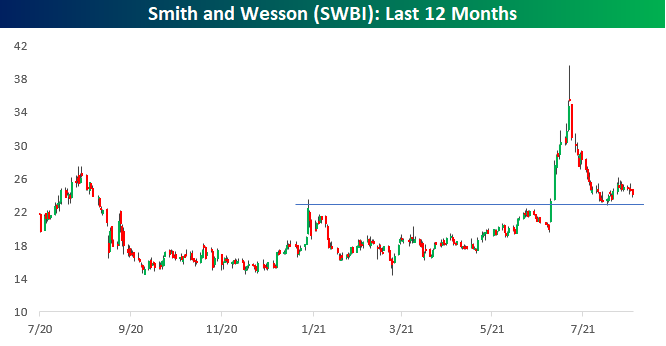
You might surmise that such a large decline in background checks wouldn’t be good for the stocks of gun manufacturers, and you’d be partly right. Below we show one-year charts of Sturm Ruger (RGR) and Smith and Wesson (SWBI). While both stocks are down significantly from their 52-week highs, they’re also far from 52-week lows. In the case of RGR, stock has pulled back from its 52-week high back in July, but for the time being it has generally held above the top end of its prior trading range from earlier this year. In the case of SWBI, the stock really surged back in late June following a strong earnings report but has been quick to give back all of its gains. Despite the large drop, though, it is still trading at higher levels now than it was in the first quarter of the year when levels of background checks were at record highs. Click here to view Bespoke’s premium membership options.