Bespoke’s Morning Lineup – 11/12/21 – Splits-ville
See what’s driving market performance around the world in today’s Morning Lineup. Bespoke’s Morning Lineup is the best way to start your trading day. Read it now by starting a two-week trial to Bespoke Premium. CLICK HERE to learn more and start your trial.
“Life’s tragedy is that we get old too soon and wise too late.” – Ben Franklin
First, it was General Electric (GE) and now it’s Johnson & Johnson (JNJ) which has announced that it will split up and separate its consumer business from its pharma and medical device unit. The stock is trading up 3% on the news but is still well off its recent highs from August.
The rally in JNJ has provided a lift to Dow futures along with the S&P 500 and Nasdaq, but unless equities can meaningfully build on these early gains during the trading day, all three major averages will finish the week in the red ending a five-week streak of gains.
On the economic calendar today, the only two reports are JOLTS and Michigan Confidence. The JOLTS reading is expected to show a modest decline from last month’s reading, which you may recall came in significantly weaker than expected. Michigan Confidence is expected to show a small bounce, but the key in that report will be where inflation expectations stand.
Read today’s Morning Lineup for a recap of all the major market news and events from around the world, including the latest US and international COVID trends.
While the S&P 500 is lower over the last five trading days heading into today, the majority of sectors have actually experienced gains during that five-day stretch. Leading the way higher, Materials (XLB) has rallied more than 2.5%, followed by Industrials (XLI), Consumer Staples (XLP), and Energy (XLE). On the downside, Consumer Discretionary (XLY) has dropped more than 3% while Communication Services (XLC) is down more than 1%. The only two other sectors that have declined are Health Care (XLV) and Technology (XLK).

Start a two-week trial to Bespoke Premium to read today’s full Morning Lineup.
Bespoke’s Weekly Sector Snapshot — 11/11/21
The Bespoke 50 Growth Stocks – 11/11/21
The “Bespoke 50” is a basket of noteworthy growth stocks in the Russell 3,000. To make the list, a stock must have strong earnings growth prospects along with an attractive price chart based on Bespoke’s analysis. The Bespoke 50 is updated weekly on Thursday unless otherwise noted. There were six changes this week.
The Bespoke 50 is available with a Bespoke Premium subscription or a Bespoke Institutional subscription. You can learn more about our subscription offerings at our Membership Options page, or simply start a two-week trial at our sign-up page.

The Bespoke 50 performance chart shown does not represent actual investment results. The Bespoke 50 is updated weekly on Thursday. Performance is based on equally weighting each of the 50 stocks (2% each) and is calculated using each stock’s opening price as of Friday morning each week. Entry prices and exit prices used for stocks that are added or removed from the Bespoke 50 are based on Friday’s opening price. Any potential commissions, brokerage fees, or dividends are not included in the Bespoke 50 performance calculation, but the performance shown is net of a hypothetical annual advisory fee of 0.85%. Performance tracking for the Bespoke 50 and the Russell 3,000 total return index begins on March 5th, 2012 when the Bespoke 50 was first published. Past performance is not a guarantee of future results. The Bespoke 50 is meant to be an idea generator for investors and not a recommendation to buy or sell any specific securities. It is not personalized advice because it in no way takes into account an investor’s individual needs. As always, investors should conduct their own research when buying or selling individual securities. Click here to read our full disclosure on hypothetical performance tracking. Bespoke representatives or wealth management clients may have positions in securities discussed or mentioned in its published content.
Chart of the Day: Rivian Drives Huge Week For US IPOs
Sentiment Steadily Moving Higher
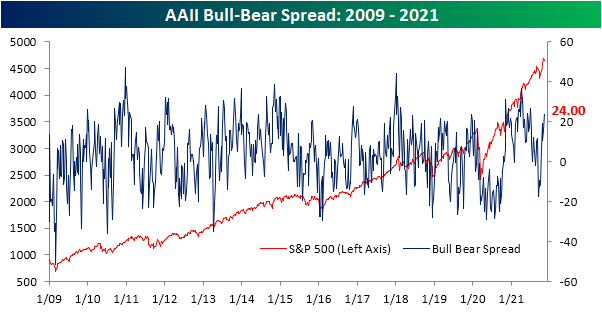
The S&P 500 has encountered some selling pressure this week, but that hasn’t stopped sentiment from continuing its grind higher. The weekly AAII sentiment survey saw 48.0% of respondents report as bullish this week up from 41.5% last week. That puts bullish sentiment at the highest level since the first week of July when it was 0.6 percentage points higher than it is now.

The increase in bullish sentiment borrowed from bears as less than a quarter of respondents reported having negative sentiment for the first time since the last week of July. Similar to bullish sentiment, bearish sentiment is now at the lowest level since the first week of July when it came in at 22.2%.

Overall, sentiment continues to favor bulls to a wide margin. As a result of the inverse moves in sentiment, the bull-bear spread rose to 24 from 15.5 last week. Again, that is levels not seen since early July.
Neutral sentiment also declined this week falling by 4.5 percentage points to 28%. Unlike bullish and bearish sentiment, that reading is basically in the middle of the past several months’ range as the reading has generally hovered around the 30% level. Click here to view Bespoke’s premium membership options.

Bespoke’s Morning Lineup – 11/11/21 – Tentative Rebound
See what’s driving market performance around the world in today’s Morning Lineup. Bespoke’s Morning Lineup is the best way to start your trading day. Read it now by starting a two-week trial to Bespoke Premium. CLICK HERE to learn more and start your trial.
“He died unquestioning, uncomplaining, with faith in his heart and hope on his lips, that his country should triumph and its civilization survive.” – Warren G Harding
In observance of Veterans Day, the Federal government and banks are closed today. That means that for today at least, stocks will not be able to fall because of rising yields. Equity futures are modestly higher this morning with the Nasdaq leading the gains. There’s no economic data on the calendar due to the holiday, and even the earnings calendar is relatively quiet.
Read today’s Morning Lineup for a recap of all the major market news and events from around the world, including the latest US and international COVID trends.
Yesterday was one of those relatively uncommon days where it didn’t matter if you were in stocks or bonds- they both had a rough day. While the S&P 500 was down around 0.80%, long-term treasuries dropped more than twice as much as the iShares 20+ Year US Treasury ETF (TLT) fell 1.83%. Over the last ten years, there have been just 34 other days where SPY and TLT both finished the day down more than 0.75%, and in the charts below we summarize the performance of both ETFs in the day, week, and month following each prior occurrence.
Starting with SPY, the day after the 34 prior occurrences its median gain has been 0.17% with gains 57% of the time which is better than the average one-day performance for all one-day periods over the last ten years. However, as you move out over the next week and month, median performance following these days where both SPY and TLT were down 0.75% or more, returns have actually been negative and well below the long-term average. In fact, both one week and one month later, SPY was higher less than half of the time.

Although SPY has tended to show weaker than average performance over the following week and month, TLT’s median one-week and one-month performance has been better than average. In fact, one month following the 34 prior occurrences, TLT only fell five times.

Start a two-week trial to Bespoke Premium to read today’s full Morning Lineup.
Daily Sector Snapshot — 11/10/21
Chart of the Day – Inflation: Which Way Now?
Triple Plays Back to Performing Well
We’ve been tracking earnings “triple plays” for the last 15+ years. A company registers an earnings triple play when it reports results that 1) beat consensus EPS estimates, 2) beat consensus revenue estimates, and 3) raise forward guidance. You can read more about the term over at Investopedia where they’ve given Bespoke credit.
Historically about 5-10% of earnings reports have been triple plays, and below is a chart showing the rolling 3-month percentage of all earnings reports that have been triple plays. You’ll notice that coming out of the COVID recession in the spring of 2020, the percentage of companies reporting triple plays began to spike, and the number kept on rising all the way through the spring/summer of 2021. It’s now apparent that analysts were way too conservative with estimates in the 12-18 months after the initial COVID crash, which resulted in an extremely high percentage of companies beating both EPS and revenue estimates. At the same time, companies themselves were getting more and more positive on the future of their businesses, and the result was a spike in the percentage of companies raising guidance. At its peak earlier this year, nearly 20% of all earnings reports were triple plays over the prior three-month period, which was 50% higher than the prior highs around 12% seen in the mid-2000s. That kind of rate was clearly unsustainable, and as you can see in the chart, the percentage of companies reporting triple plays is currently falling back down to more normal levels.

Using our Earnings Explorer tool, we can track how stocks that report triple plays have historically reacted to the news. As shown in the snapshot below, over the last ten years, there have been just over 5,600 earnings triple plays, and these stocks have averaged a one-day gain of 5% on the first full trading day following the earnings release. That one-day gain of 5% shows how positively investors typically view earnings triple plays.

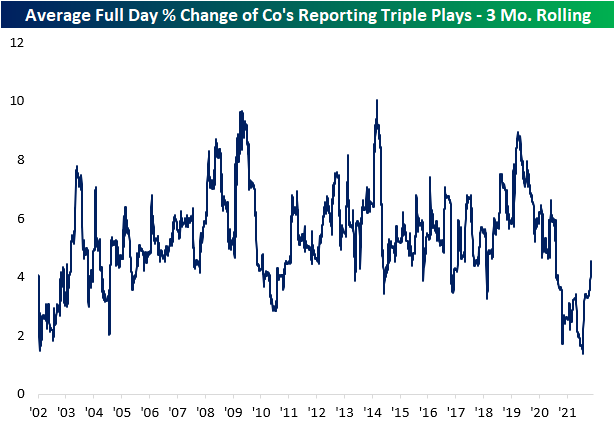
Taking a closer look at one-day price reactions to triple plays, below we show the average one-day price change for stocks reporting triple plays on a rolling three-month basis.
As you can see, the average one-day gain for triple plays fell sharply after the Covid recession at the same time that the percentage of companies reporting triple plays was spiking. This intuitively makes sense — the more common triple plays are, the less investors will reward the stocks that are reporting them.
Stocks reporting triple plays were barely posting gains of more than 1% on their earnings reaction days this past summer, but lately we’ve seen investors treat triple plays more positively. As shown in the chart, the average one-day gain for stocks reporting triple plays has been rising sharply in recent months and is now back above 4%. This comes as we’re seeing less companies report triple plays.
Over the last week, the 82 stocks that have reported earnings triple plays have averaged a one-day gain of 5.67%, and more than a quarter of them have gained more than 10%.
We love tracking the list of individual companies reporting earnings triple plays because it’s a great starting point for further research. Companies reporting triple plays typically have fundamental momentum.
Bespoke subscribers can track both earnings trends more broadly and also see a continuously updated list of recent earnings triple plays. If you’d like to see the list of this earnings season’s triple plays, simply click here to start a two-week trial to Bespoke Premium today.
Jobless Claims Closing in on Pre-Pandemic Lows
With the Veteran’s Day holiday tomorrow, the weekly release of jobless claims was pushed up to today. Initial claims missed expectations falling to only 267K rather than the anticipated drop to 260K. Last week’s number was also revised higher by 2K to 271K. The decline this week marked the sixth week in a row of declines as claims are once again at the lowest levels since March 2020. In fact, this week’s level is only 11K above the March 14, 2020, pre-COVID surge level.

On a non-seasonally adjusted basis, claims were actually higher as could be expected given the seasonal headwinds of this time of year. For the current week of the year, initial claims have historically risen 85% of the time week over week; one of the highest readings of any week. PUA claims meanwhile fell below 2K as the program continues its unwind.

Continuing claims ticked higher this week rising from 2.10 million to 2.16 million on a seasonally adjusted basis. That is the first increase in six weeks but it is a modest one, especially relative to the past few weeks’ declines. Even after the increase, continuing claims are still 79K below levels from two weeks ago.

Delayed an extra week, the inclusion of all other programs showed yet another drop in continuing claims on an unadjusted basis. Total claims across all programs fell to 2.57 million, down roughly 100K from the previous week. Essentially that entire decline was on account of regular state claims with the moves in PUA and PEUC claims basically netting out. There continue to be some residual claims from pandemic era programs, but they now account for a significantly smaller share of claims than was the case only a few months ago, and generally, those claim counts have declined.

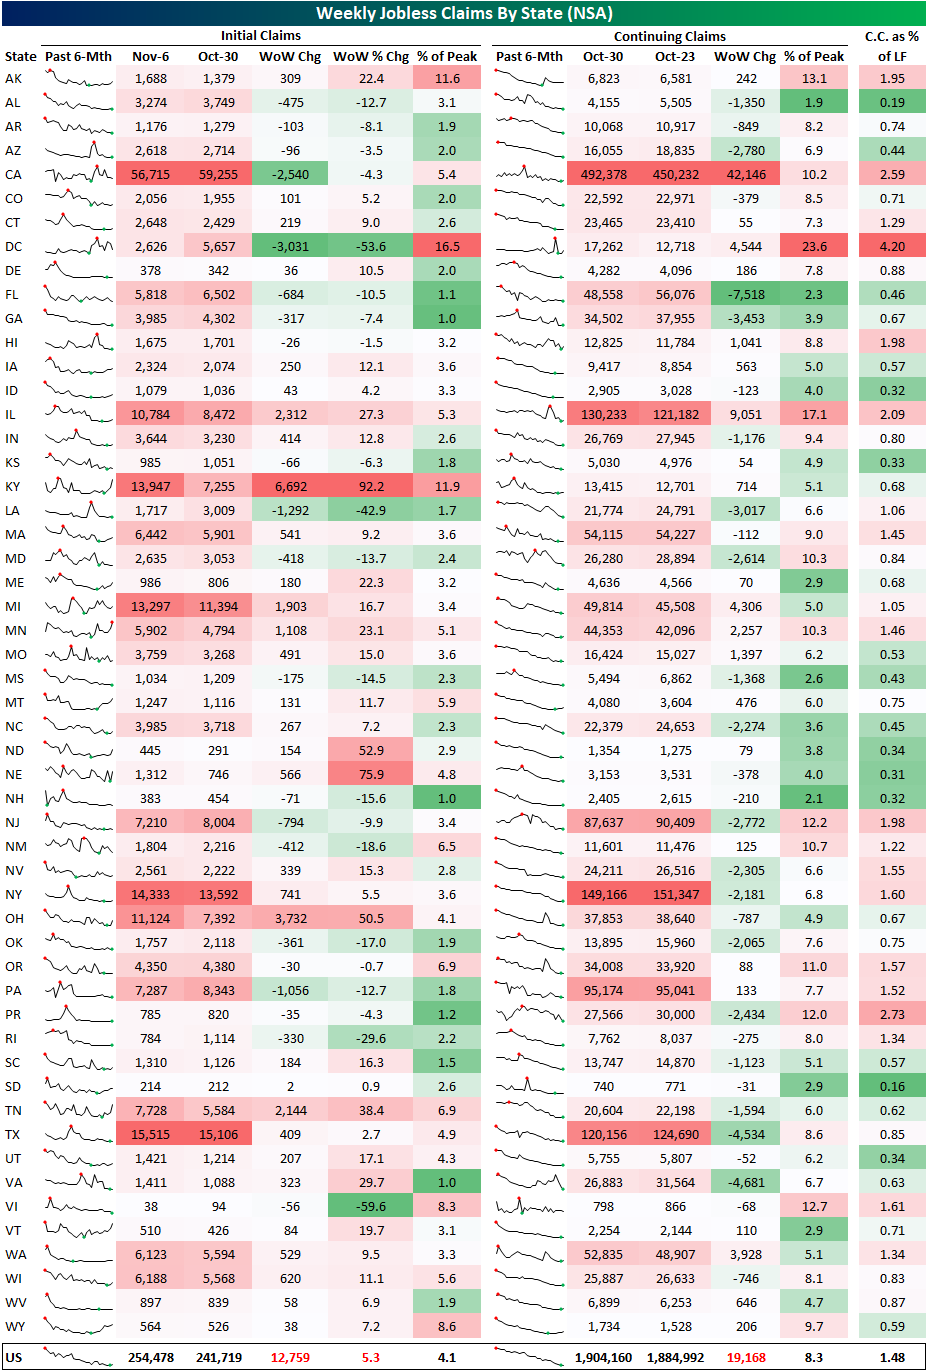
In the matrix below, we show a state-level breakdown of jobless claims. For the most part, states currently have claims counts around new lows, but there are a handful of states that are trending higher like Iowa, Kentucky, Minnesota, Tennessee, and Vermont. As mentioned previously, those reversals in trend are likely a result of seasonal headwinds. Click here to view Bespoke’s premium membership options.