Another CPI Spike… Now What?
As mentioned in today’s Morning Lineup, the consumer price index (CPI) rose 7.0% year over year in December, the highest rate of increase since 1982. Consumers across America are paying higher prices for everything from bread to gas due to supply chain constraints, labor shortages, easy fiscal and monetary policy, and robust demand. Although this number was in line with estimates, the y/y increase is certainly notable.

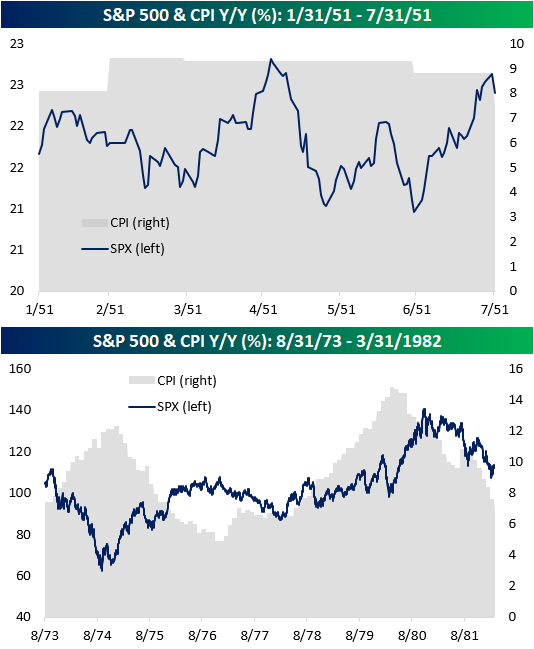
As shown in the chart above, there have only been four other periods since 1950 that y/y CPI reached 7.0% or more (1951, 1973, 1977, 1978), and in the table below we have summarized the performance of the S&P 500 during and after each of those prior periods. Overall, returns were mixed. In January 1951, the S&P 500 was just 0.4% off of its 52-week high when CPI first eclipsed 7%. During the seven months in which CPI remained above 7% on a y/y basis, stocks rallied 3.4%, and one year later, the S&P 500 was up 11.4%.
The longest streak of 7%+ y/y readings occurred between 1978 and 1982 and spanned 46 months. During this streak, the S&P 500 gained just 15.1% over the course of almost four years and just 1.8% in the year following the first reading over 7.0% in May 1978.
In between the 1951 and 1978 periods, there were two other occurrences where CPI eclipsed 7% on a y/y basis in 1973 (28 months) and 1977 (one month), and during both of these periods, equities traded lower.

As you can see from the charts below, the S&P 500 has acted differently each time CPI topped 7.0% on a Y/Y basis. In the first half of 1951, it appeared to trade independently of the elevated inflation readings, moving sideways as CPI readings remained elevated. For much of the 1970’s, however, CPI and the S&P 500 tended to move in opposite directions. Nonetheless, much of the gains experienced in the 70’s were in periods when the rate at which prices were increasing was on the decline. Inflation has typically been considered a negative backdrop of equity prices but a key factor behind that performance is how long-lasting the inflation is. In the early 1950s, when the elevated level of inflation was short-lived, equities, which were already near 52-week highs, performed fine. In the 1970s, though, when inflation was more entrenched, the backdrop for equities was negative. Stay on top of market trends by becoming a Bespoke subscriber today. Click here to view Bespoke’s premium membership options.
The Best and Worst of Q4 Earnings
Earnings season begins this week as corporations report their Q4 results and wrap up fiscal year 2021. Earnings season unofficially begins when the large banks begin reporting their earnings and concludes when Walmart (WMT) releases its results.
We do a lot of earnings season analysis using our Earnings Explorer tool, which is available to Bespoke Institutional subscribers. One type of analysis is tracking how share prices typically react to earnings reports. Since the start of 2011, there have been certain companies that have excelled after reporting Q4 results specifically, while others have historically struggled. Of the companies that have at least five years worth of Q4 reports, Netflix (NFLX), Etsy (ETSY), and SolarEdge (SEDG) have been the S&P 500’s three top performers, averaging 12.4%, 9.6%, and 8.3% gains on their Q4 earnings reaction days, respectively. Charles River Laboratories (CRL), Darden Restaurants (DRI), Signature Bank (SBNY), and Lamb Weston (LW) have beaten Q4 sales estimates every time, while ETSY, Fortinet (FTNT), EPAM Systems (EPAM), Meta Platforms (FB), and LW have beaten Q4 EPS estimates 100% of the time.

Using our Earnings Explorer, below is a look at how Netflix (NFLX) has historically performed on its earnings reaction days broken out by quarter. (For a stock that reports in the morning before the open, that day is its “earnings reaction day.” For a stock that reports after the close, the next trading day is its “earnings reaction day.”) Remarkably, NFLX has historically averaged declines on its earnings reaction days for Q1, Q2, and Q3 earnings releases, but it has absolutely soared on its Q4 earnings reaction days. As shown, the stock has historically averaged a one-day gain of 10.72% on its Q4 earnings reaction day with positive returns 74% of the time. (Conversely, the stock has historically averaged a decline of 6% on its Q2 earnings reaction day (typically in July) with positive returns just 20% of the time.)

As shown, post-COVID, Netflix (NFLX) has had seven quarterly earnings releases, and the only one that the stock reacted positively to was its Q4 2020 report last January when it gained 16.85%. The stock fell 2% or more on each of its six other earnings reaction days post-COVID.

SolarEdge (SEDG) is a stock from the table above that has traded positively on every single one of its Q4 earnings reaction days. Below is a snapshot of SEDG’s historical Q4 reports from our Earnings Explorer tool. As shown, SEDG has historically averaged a one-day gain of 8.3% on its Q4 earnings reaction day with positive returns six out of six times.

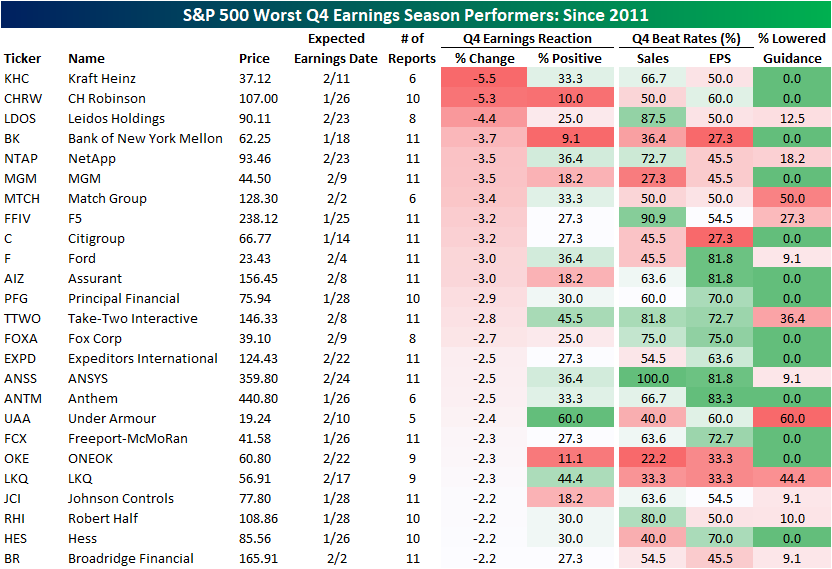
On the other side of the equation, Kraft Heinz (KHC), CH Robinson (CHRW), and Leidos Holdings (LDOS) have historically been the S&P 500’s worst performers after reporting Q4 earnings, averaging a decline of 5.5%, 5.3%, and 4.4% on earnings reaction days since 2011, respectively. None of these names have declined 100% of the time since, but Bank of New York Mellon (BK), CHRW, and ONEOK (OKE) have performed positively less than 15% of the time on Q4 earnings reaction days. Match Group (MTCH) and Under Armour (UAA) have lowered guidance at least 50% of the time on Q4 earnings, and BK, MGM (MGM), Citigroup (C), Ford (F), Under Armour (UAA), OKE, LNQ (LNQ), and Hess (HES) have missed Q4 sales estimates over half of the time.
Turning back to our Earnings Explorer, since the start of the 2020, NetApp (NTAP) has traded lower following an earnings report three times, two of which occurred in Q4. Interestingly, in the Q4 of fiscal year 2020 release, revenues and EPS beat estimates, but the equity still traded lower by nearly 14.5%. NTAP has not experienced gains on a Q4 earnings reaction day in four consecutive years.

As always, past performance is no guarantee of future results, and this is not a recommendation to buy or sell any specific securities.
If you want to stay up to date on earnings reports, we recommend that you start a 14-day trial to our Bespoke Institutional package. With this subscription, you will receive earnings coverage for the most crucial companies through our Conference Call Recaps section.
Bespoke’s Morning Lineup – 1/12/22 – CP-High
See what’s driving market performance around the world in today’s Morning Lineup. Bespoke’s Morning Lineup is the best way to start your trading day. Read it now by starting a two-week trial to Bespoke Premium. CLICK HERE to learn more and start your trial.
“It is a way to take people’s wealth from them without having to openly raise taxes. Inflation is the most universal tax of all.” – Thomas Sowell
The big data release of the day is December’s reading on CPI, and the results came in slightly higher than expected with headline CPI rising 0.5% m/m versus forecasts for an increase of 0.4% while core CPI increased 0.6% compared to forecasts for an increase of 0.5%. On a y/y basis, headline CPI increased 7.0%, and as shown in the chart below, that’s the highest rate of change since 1982.
Despite the higher than expected readings, though, investors must have been expecting worse as futures have legged higher, led by the Nasdaq, in reaction to the report.
Read today’s Morning Lineup for a recap of all the major market news and events from around the world, including the latest US and international COVID trends.
Even as it was expected to be high, the rate of increases in consumer prices for the month of December is still a chart to behold. With the y/y change hitting 7.0%, it is the highest rate of change in CPI on a y/y basis since 1982.

Not only are consumer prices up significantly over the last year, but the pace at which we have reached these levels is nearly unprecedented. A year ago at this time, CPI was only rising at a y/y rate of 1.4%. That rate of increase has now accelerated by a full 5.6 percentage points. Going all the way back to 1951, the only other times that the rate of change in Y/Y CPI increased at a similar or higher rate were in 1951 and 1974.

Start a two-week trial to Bespoke Premium to read today’s full Morning Lineup.
Daily Sector Snapshot — 1/11/22
Small Pickup in Small Business Sentiment
The NFIB’s reading on small business sentiment has generally been on the decline over the past few years, although it’s also well off the lows set during the depths of the pandemic. In October, the index hit the lowest level since last March, and the past two months have seen a modest bounce off that October low, leaving small business sentiment middling versus its historical range.

While the headline number is far from any significant high or low, the individual components of the report are showing another story. Employment-related indicators are around some of the highest readings on record while a handful of other categories like Expectations for the Economy to Improve are near some of the lowest.

Rising slightly off the November reading, which was tied with November 2012 for the lowest on record, firms continue to have a historically sour outlook for the economy. While there are some other areas that are at the low end of their range of historical readings, this index is by far the most depressed area of the report.

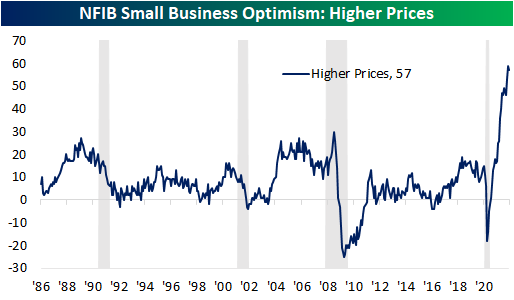
One potential reason for the pessimistic outlook could of course be the resurgence of COVID cases, but another likely reason, as we noted in today’s Morning Lineup, is inflation. The index tracking the rate at which firms report higher prices peaked in November but remains extremely elevated at 57. Meanwhile, a record high 22% of responding businesses reported inflation as their biggest concern.
Although costs are soaring, on the bright side, the employment situation is very strong. Firms reported an increase in hiring plans with the index rising to 28, the highest level since August while the net change in employment was positive for the first time since April. That is also only the second positive reading since the pandemic began. As with other costs, compensation is at an unprecedented level with the index setting a new record high in December. Compensation plans have now gone unchanged at 32 in back-to-back months. Responding firms also are reporting continued difficulties hiring with the Job Openings Hard to Fill index maintaining its lofty readings after gaining one point in December. Click here to view Bespoke’s premium membership options.

Bespoke Stock Scores — 1/11/22
Dividends Outperform With Discrepancy
In last week’s Bespoke Report, we performed a decile breakdown of year to date performance of Russell 1,000 members based on a variety of factors ranging from valuations to performance in 2021. One standout attribute of stocks that has been driving performance this year has been dividend yields. Expanding to the broader Russell 3,000, as shown below, the decile of stocks that pay no dividend is down a dramatic 5.69% on average this year. Meanwhile, deciles 7 through 10 with the highest dividend yields are all firmly in the green with average gains ranging from 1.93% to 2.38%.

With dividend payers significantly outperforming, it is worth mentioning which stocks tend to have the highest dividend yields. In the chart below, we show the average dividend yield for stocks of each sector of the Russell 3,000. Utilities, Real Estate, and Financials all top the list with average yields above 2% while Health Care and Technology stocks, on an average basis, offer hardly any yield at all.

Given the outperformance of high-yielding stocks this year, some dividend-focused ETFs are up the most versus other investment styles highlighted in the styles screen of our Trend Analyzer, but there is a decent bit of dispersion for various ETFs tracking this theme as they have slightly different methodologies/more granular focuses.
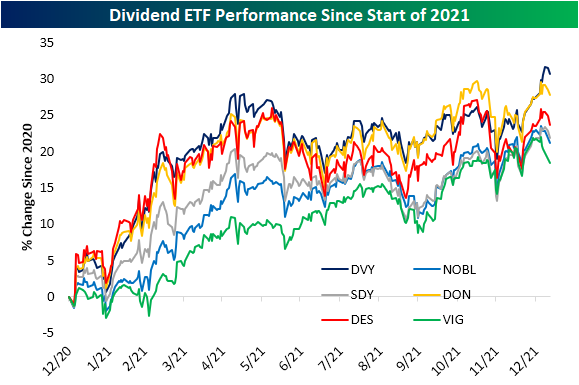
The iShares Select Dividend ETF (DVY) is currently up the most year to date ( 2.5%) as it has also outperformed for most of the time since the start of last year (dark blue line). Additionally, the recent move higher resulted in a significant breakout to the upside. The next best performing dividend ETFs this year have been market cap focused with the WisdomTree SmallCap Dividend ETF (DES) gaining 0.09% and its mid-cap centered peer (DON) which has risen 0.29% YTD. Like DVY, these two ETFs have also tended to outperform over the past year, though neither has broken out in the same way as DVY, stopping short of prior highs even with solid gains late last year and to start this year.
On the other hand, dividend growers proxied by ETFs like the S&P 500 Dividend Aristocrats (NOBL), Dividend Appreciation ETF (VIG), and S&P Dividend ETF (SDY) have underperformed some of their peers since the end of 2020, but recently hit new highs and have generally trended higher since last year. More recently in 2022, though, they have actually sold off and are each in the red YTD.
Again, each of the ETFs shown above have different methodologies for selecting their holdings, ranging from a history of dividend growth or market cap size which factors into performance. One other factor, however, for the difference in performance also has to do with sector exposure. This year, Financials have been one of the top-performing sectors and as mentioned earlier, is one of the highest yielding sectors. The top-performing dividend ETFs have the highest weight in Financials. DVY, DON, and DES each have around a quarter of their holdings in this sector. The other best performing sector this year, Energy, also accounts for a significantly larger portion of DVY and DON versus other dividend ETFs. Conversely, VIG has a much larger weight in Tech and Health Care, which have been the second and third-worst performing sectors this year, and that exposure helps to explain much of its YTD underperformance. Click here to view Bespoke’s premium membership options.
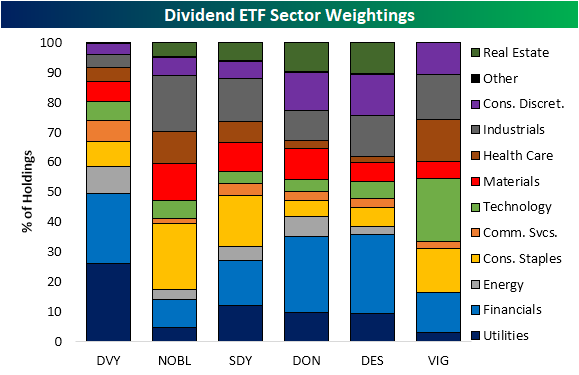
Chart of the Day – Nasdaq 5-Day Declines of 5%+
Bespoke’s Morning Lineup – 1/11/22 – Powell Time
See what’s driving market performance around the world in today’s Morning Lineup. Bespoke’s Morning Lineup is the best way to start your trading day. Read it now by starting a two-week trial to Bespoke Premium. CLICK HERE to learn more and start your trial.
“We will use our tools to support the economy and a strong labor market and to prevent higher inflation from becoming entrenched.” – Jerome Powell
It’s a generally quiet day for data today, so investor attention will be focused on the Senate as Fed Chair Powell sits in front of the Senate Banking Committee for his renomination hearing this morning. With four rate hikes in 2022 now more likely than unlikely, investors will be intently focused on any comments from Powell related to rates and the pace of balance sheet run-off once lift-off begins.
Futures are essentially flat with a positive bias heading into the opening bell this morning as Europe rallies and gold and crude oil are trading higher.
Read today’s Morning Lineup for a recap of all the major market news and events from around the world, including the latest US and international COVID trends.
It was a moral victory for bulls yesterday as the Nasdaq 100 erased an intraday decline of more than 2.5% to finish the day modestly in positive territory. As good as the reversal felt yesterday, it is important to keep in mind that even with the reversal, QQQ, finished the day below the low end of its Q4 trading range and also lower than the prior high from early September. Once a solid level of support breaks to the downside, it can often act as upside resistance, so it will be important to watch how those levels hold in the days ahead on any rally attempts.

Start a two-week trial to Bespoke Premium to read today’s full Morning Lineup.