Bespoke Consumer Pulse Report – December 2021
The Bespoke 50 Growth Stocks – 12/2/21
The “Bespoke 50” is a basket of noteworthy growth stocks in the Russell 3,000. To make the list, a stock must have strong earnings growth prospects along with an attractive price chart based on Bespoke’s analysis. The Bespoke 50 is updated weekly on Thursday unless otherwise noted. There were ten changes to the list this week.
The Bespoke 50 is available with a Bespoke Premium subscription or a Bespoke Institutional subscription. You can learn more about our subscription offerings at our Membership Options page, or simply start a two-week trial at our sign-up page.
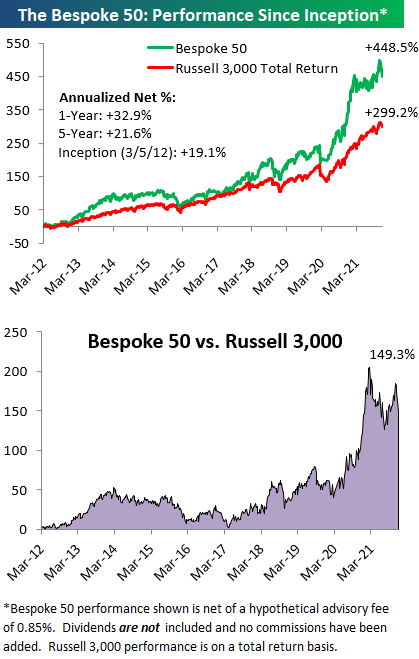
The Bespoke 50 performance chart shown does not represent actual investment results. The Bespoke 50 is updated weekly on Thursday. Performance is based on equally weighting each of the 50 stocks (2% each) and is calculated using each stock’s opening price as of Friday morning each week. Entry prices and exit prices used for stocks that are added or removed from the Bespoke 50 are based on Friday’s opening price. Any potential commissions, brokerage fees, or dividends are not included in the Bespoke 50 performance calculation, but the performance shown is net of a hypothetical annual advisory fee of 0.85%. Performance tracking for the Bespoke 50 and the Russell 3,000 total return index begins on March 5th, 2012 when the Bespoke 50 was first published. Past performance is not a guarantee of future results. The Bespoke 50 is meant to be an idea generator for investors and not a recommendation to buy or sell any specific securities. It is not personalized advice because it in no way takes into account an investor’s individual needs. As always, investors should conduct their own research when buying or selling individual securities. Click here to read our full disclosure on hypothetical performance tracking. Bespoke representatives or wealth management clients may have positions in securities discussed or mentioned in its published content.
Bespoke’s Weekly Sector Snapshot — 12/2/21
Sentiment Collapse
In the past three weeks, sentiment has taken a big hit with the percentage of respondents to the AAII survey reporting as bullish falling 21.3 percentage points. That is the biggest three-week decline since March 2018 when bullish sentiment fell a slightly larger 22.12 percentage points. With 26.7% of respondents bullish, market optimism is at the lowest level since the first week of October when 25.5% of respondents reported as bullish.
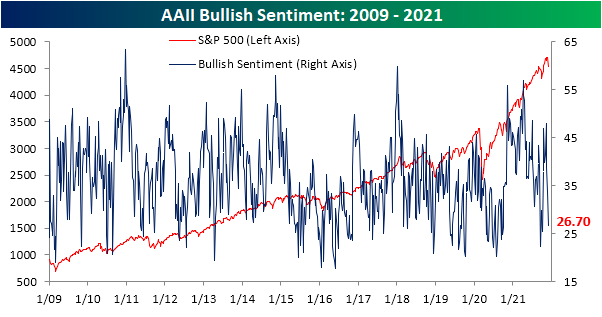
That big drop in bullish sentiment also means bearish sentiment has rocketed higher to 42.4%. That is the highest reading in bearish sentiment since the first week of October of last year. Similar to bullish sentiment, since the recent low of 24% three weeks ago, the 18.4 percentage point increase was the largest three-week uptick since March 2020.

Due to the big inverse moves in bullish and bearish sentiment, the bull-bear spread has also collapsed from double-digit positive readings only two weeks ago down to the bottom decile of its historical range. At -15.7, the bull-bear spread is now at the lowest level since September 16th.

Even though bullish and bearish sentiments have seen big shifts, the percentage of respondents reporting as neutral has gone little changed. There was only a half percentage point increase this week up to 31% which leaves neutral sentiment roughly in line with its historical average (31.43%).

The AAII readings were not the only sentiment indicators that have collapsed. The NAAIM Exposure index has fallen to 87.87 this week; the first sub-100 reading in five weeks. Meanwhile, the Investors Intelligence (II) survey saw the highest reading in bearish sentiment since May 2020. Combined with a decline in bullish sentiment, the bull-bear spread has hit the lowest level since October 20th. In the chart below, we have created a sentiment composite taking the z-scores of the current readings across each of these three surveys (AAII and II bull-bear spreads and the NAAIM index). This shows that sentiment readings have gone from a historically elevated reading that is a full standard deviation above the historical norm all the way back to zero in three weeks’ time. In other words, sentiment has made a sharp pessimistic turn in the past few weeks, but current readings are overall not exactly bearish to any extreme degree. Click here to view Bespoke’s premium membership options.

Claims Remain Low
Last week saw the first sub-200K seasonally adjusted initial jobless claims print in over 50 years. This week, that number was revised even lower to 194K. While that reading sets a historic low, the most recent data for the week ending November 27th, however, saw claims rise by 28K to 222K. Although that marks the biggest one-week uptick in claims since July, the level of claims remains handily below pandemic levels and below the level of 256K from right before the COVID surge that took claims into the millions.

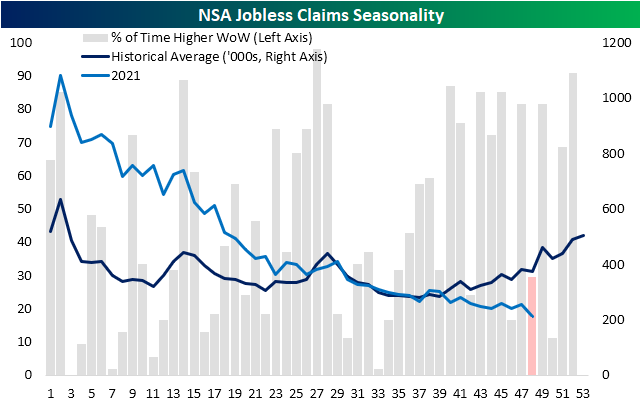
Last week, seasonal adjustments gave a significant boost to jobless claims as NSA claims actually came in at 253.5K versus the 194K adjusted reading. This week, NSA claims were the lower of the two coming in at 211.9K which is the lowest level since the first week of March 2020. With claims declining further, they continue to buck the seasonal trend. As shown below, the current week of the year has consistently seen a lower reading in NSA claims than the prior week as was the case in the most recent print. Currently, claims are at a new low for the year whereas historically they have been on the rise for several weeks now.
Lagged one week to initial claims, continuing claims also hit a pandemic low for the first sub-2 million print since March 2020. The 107K decline from last week’s revised number was the biggest one-week decline since October 22nd.

Including all programs delays the data by another week making the most recent reading through the week of November 12th. That week saw a slight uptick in claims led by gains in regular state programs. Pandemic era programs are largely unwound by now, but there is still a significant presence with over 300K claims coming from the PUA and PEUC programs. Click here to view Bespoke’s premium membership options.
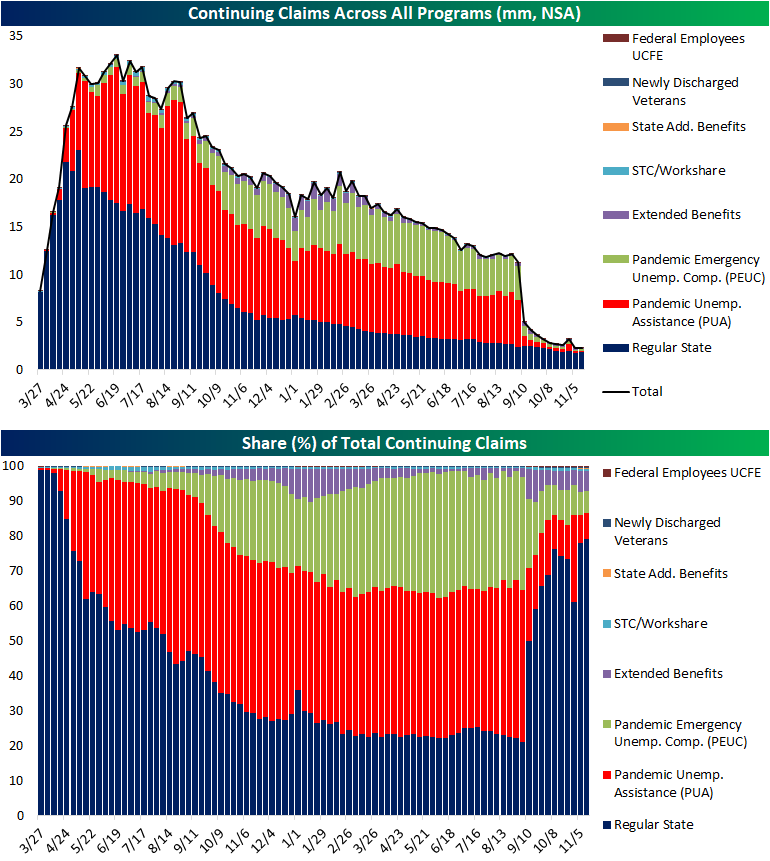
Chart of the Day: S&P 500 (SPY) Roller Coaster Ride Continues
Bespoke’s Morning Lineup – 12/2/21 – Apple (AAPL) Falls
See what’s driving market performance around the world in today’s Morning Lineup. Bespoke’s Morning Lineup is the best way to start your trading day. Read it now by starting a two-week trial to Bespoke Premium. CLICK HERE to learn more and start your trial.
“Our liquidity is fine. As a matter of fact, it’s better than fine. It’s strong.” – Kenneth Lay
Good Morning Subscriber,
Today marks the 20-year anniversary of the Enron bankruptcy, and if you think the last few days in the market have been lousy, it was nothing compared to late 2001 when we were in the middle of the dot-com bust, coming out of 9/11, and heading into another rough year in 2002 when Worldcom eventually collapsed as well.
Futures are higher this morning, but traders aren’t even waiting until the opening bell to raise cash as Nasdaq futures have reversed into the red and the Dow and S&P 500 have also given up much of their earlier gains. One of the main culprits behind the weakness this morning is a report from Bloomberg that Apple (AAPL) has told suppliers that demand for the iPhone 13 after the holidays may not be as strong as previously estimated. AAPL had been a bright spot in the Nasdaq over the last few trading days but is trading down over 3% in the pre-market.
Read today’s Morning Lineup for a recap of all the major market news and events from around the world, including the latest US and international COVID trends.
Yesterday was an extremely disappointing day for small caps as the Russell 2000 rallied more than 2% intraday only to give it all back and a lot more throughout the trading day. By the time the closing bell rang, the Russell 2000 was down over 2% on the day. Since the Russell 2000 tracking ETF (IWM) launched in early 2000, yesterday was just the 9th time that the ETF saw a similar intraday rally (+2%) only to finish the day down more than 2%. Each of those days is shown as a red dot in the chart below. Despite over 20 years of trading history for IWM, all eight prior occurrences were confined to a two-month period in 2008 (six occurrences) and a three-week period in 2020 (two occurrences).
Unlike yesterday’s reversal, most of the other occurrences came well into market declines. The only exception was on 3/3/20. Interestingly enough, that occurrence also followed a period of sideways trading for the Russell where it broke out of a multi-month range (but didn’t reach a new high) only to reverse and sell-off sharply into the COVID crash. It’s unlikely the Omicron variant will cause the same sort of market turmoil that COVID initially created in early 2020, but the Fed is certainly not going to be nearly accommodative going forward as they have been since early 2020.
This morning, Russell 2000 futures are indicated higher by about 1%, but to put that in perspective, the gain isn’t even enough to bring the index back to where it was trading 15 minutes before the close yesterday.

Start a two-week trial to Bespoke Premium to read today’s full Morning Lineup.
Daily Sector Snapshot — 12/1/21
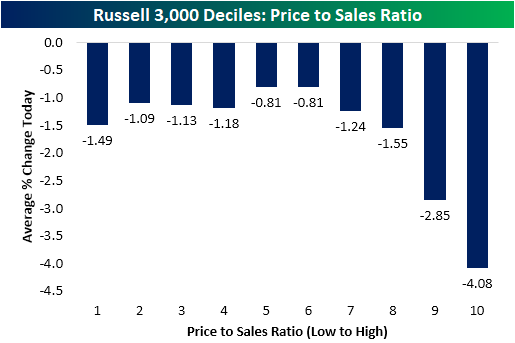
Stocks with Aggressive Valuations Getting Crushed
One theme popping in and out of recent price action has been the underperformance of stocks with higher valuations. That was once again apparent today. In the chart below, we break down the Russell 3,000 into equal-sized deciles (10 groups) based on their price to sales ratios (sorted from those with the lowest ratio to the highest). As shown, the stocks with the highest P/S ratios significantly underperformed today with the decile of the most elevated ratios falling over 4% on average. The ninth decile similarly experienced outsized declines of 2.85% compared to the average stock in the index which fell 1.6% today.
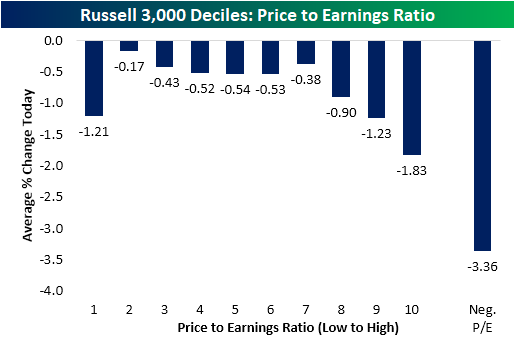
Turning to another common valuation metric, the P/E ratio, the dynamic is just as evident. In the chart below we again broke the Russell 3,000 into equal-sized deciles except we separated out all stocks with negative earnings as well. Nearly a third of the index has a negative P/E ratio at this point! As shown, the stocks with negative earnings (no P/E ratio) got absolutely crushed today with an average drop of 3.36%. Click here to view Bespoke’s premium membership options.
B.I.G. Tips – Earnings Triple Plays
We’ve just published our newest Top Triple Plays report. This season we identified 40 earnings triple plays that we think have attractive price charts right now.
What is a triple play? When a stock reports quarterly earnings, it registers a “triple play” when it beats analyst EPS estimates, beats analyst revenue estimates, and raises forward guidance. We coined the term back in the mid-2000s, and you can read more about it at Investopedia.com. We consider triple plays to be the cream of the crop of earnings season, and we’re constantly finding new long-term buy opportunities from this basket of names each quarter. You can track the newest earnings triple plays on a daily basis at our Triple Plays page if you’re a Bespoke Premium or Bespoke Institutional member. To read our newest report and see the triple plays that we think look the best right now, start a two-week trial to Bespoke Premium!
