Bespoke’s Morning Lineup – 12/29/21 – Quiet Wednesday
See what’s driving market performance around the world in today’s Morning Lineup. Bespoke’s Morning Lineup is the best way to start your trading day. Read it now by starting a two-week trial to Bespoke Premium. CLICK HERE to learn more and start your trial.
“Coaches have to watch for what they don’t want to see and listen to what they don’t want to hear.” – John Madden
After trading with a positive bias overnight, US equity futures have turned lower and are now indicated to open flat to slightly lower. Given the light flow of news and data that is typical of year-end, there isn’t much of a catalyst driving the reversal, although Samsung did announce that it would be adjusting production schedules in China due to an outbreak of the Omicron virus in Xi’an. Any indications of further disruptions to the supply chain because of rising COVID cases would be viewed negatively at the margin by the market even if they are only temporary.
Read today’s Morning Lineup for a recap of all the major market news and events from around the world, including the latest US and international COVID trends.
The S&P 500 is up just under 5% over the last five trading days, and the rally has been led by Consumer Discretionary (thanks mostly to Tesla) and Technology which are both up over 6%. Other sectors that have outperformed the broader market include Energy (+5.75%), Materials (+5.25%), and Industrials (+5.11%). On the downside, four sectors are up less than 4% over the last five trading days, and ironically enough, they are also the only sectors trading more than two standard deviations above their 50-day moving averages as they outperformed the market during the weakness that preceded this latest rally. Even after the big Christmas rally and the fact that the S&P 500 is right near record highs, two sectors – Energy and Financials – are still below their 50-day moving averages while Communication Services is just barely above its 50-day.

Start a two-week trial to Bespoke Premium to read today’s full Morning Lineup.
Daily Sector Snapshot — 12/28/21
B.I.G. Tips – 25 Years of the Dow’s Biggest Winners and Losers
Bespoke Stock Scores — 12/28/21
Chart of the Day – Breadth Boom
Bespoke’s Morning Lineup – 12/28/21 – Green Again
See what’s driving market performance around the world in today’s Morning Lineup. Bespoke’s Morning Lineup is the best way to start your trading day. Read it now by starting a two-week trial to Bespoke Premium. CLICK HERE to learn more and start your trial.
“It’s how tenacious you are that will determine your success.” – Steve Ballmer
After the 69th record high close for the S&P 500 yesterday, equity futures are pointing to a higher open again this morning which would be the fifth straight positive day. After a rocky first half of December, the last four days have put the index firmly into positive territory with 1%+ gains in three of the last four trading days and a gain of 0.62% in the one day where we didn’t reach 1%.
Read today’s Morning Lineup for a recap of all the major market news and events from around the world, including the latest US and international COVID trends.
With the last four days of gains, it didn’t take long for the S&P 500 to move back to what are generally considered ‘extreme’ overbought levels. As shown in the chart below, the S&P 500 made two brief trips below its 50-DMA in December (12/1 and 12/20) but has quickly rebounded. Moves like the last four trading days show how difficult timing the market can be. Even in a year where the S&P 500 is up 27%, nearly one-fifth of the year’s gains have come in the last four trading days alone.

Start a two-week trial to Bespoke Premium to read today’s full Morning Lineup.
Daily Sector Snapshot — 12/27/21
Texas Manufacturing Moderation
The only piece of economic data on the docket today was the Dallas Fed’s read on the region’s manufacturing sector for the month of December. Overall activity continued to grow albeit at a decelerated pace. The index last peaked this past April at one of the strongest levels on record. The grind lower since then that includes a 3.7 point drop in the most recent month leaves the index at 8.1.
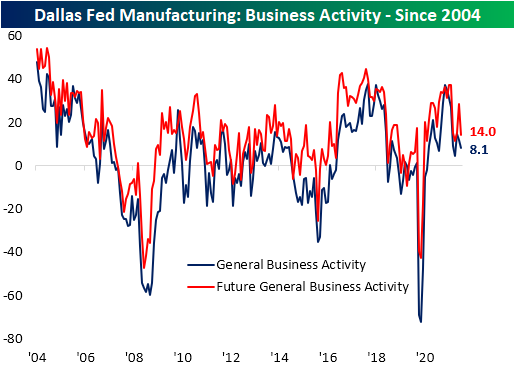
That current reading is in the middle of the historical range, but many other categories of the report remain at far healthier levels from a historical standpoint. In spite of generally elevated readings and given the decline in the headline number, more components fell this month than moved higher. The declines in indices for expectations were both broader and more pronounced with several month over month declines ranking in the bottom decile of all monthly moves.

One general area of weakness in December was demand. New orders decelerated modestly while there was a more substantial decline in unfilled orders. That being said, unfilled orders remains one of the most elevated indices of the report. Shipments were also lower, but the drop in expectations is probably more notable, setting a new post-pandemic low.

The employment situation generally improved with the index for number of employees rising to the second-highest level on record behind the April 2021 reading. Although more people were hired, wage and benefit growth slowed, even as it continues to run at unprecedentedly high levels. Hours worked were little changed. Bigger and inverse moves were seen in expectations and current conditions of Capital Expenditures. The former saw the largest one-month drop since March 2020 while current conditions saw the largest one-month uptick since this past March. In other words, businesses continue to take on new workers, invest in capital, and pay higher prices for labor, but they do not expect this trend to be as strong in the months ahead.

The other notable area of this month’s report concerned prices. Prices Paid experienced the biggest single-month decline since March 2020. That decline ranks in the bottom 5% of all monthly moves and it also is off of a record high. Prices received, meanwhile, moved slightly higher gaining 0.1 point. As for some further insights into supply chains, while firms were paying less they were waiting longer as Delivery Times continue to rebound after declines in the spring and summer. Click here to view Bespoke’s premium membership options.
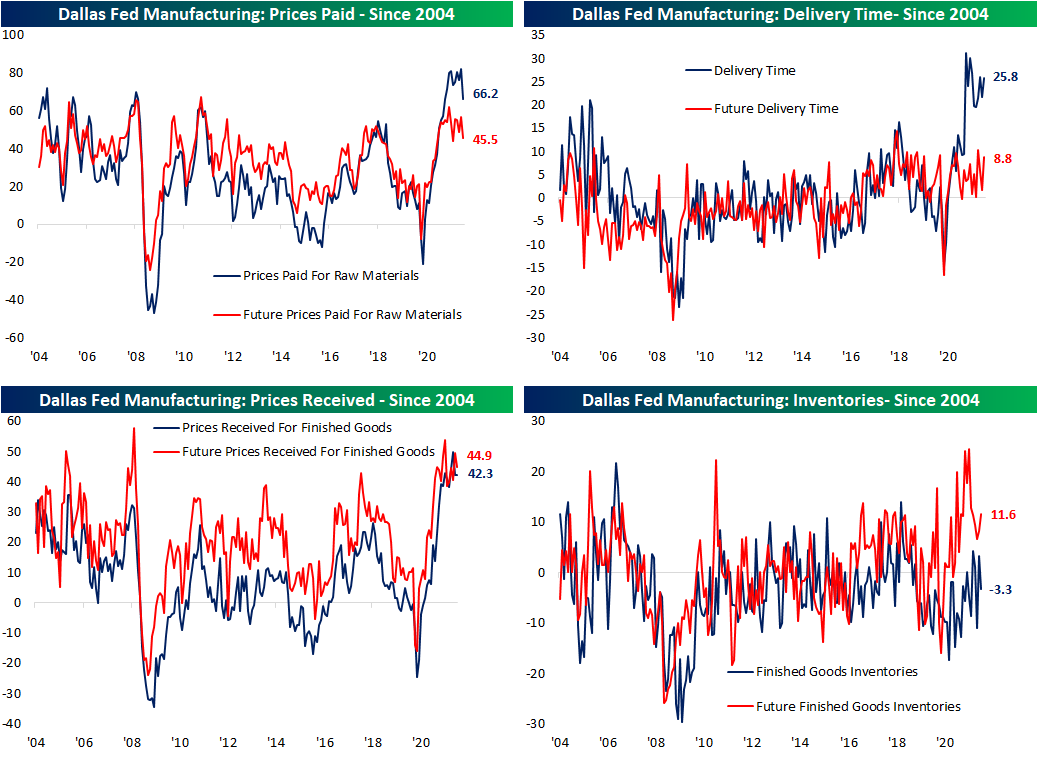
Chart of the Day: Noisy Nasdaq
Bespoke’s Morning Lineup – 12/27/21 – Beginning of the End
See what’s driving market performance around the world in today’s Morning Lineup. Bespoke’s Morning Lineup is the best way to start your trading day. Read it now by starting a two-week trial to Bespoke Premium. CLICK HERE to learn more and start your trial.
“Amateurs want to be right. Professionals want to make money.” – Alan Greenspan
Welcome to the beginning of the last week of 2021. It’s been quite a year and while in some ways, it’s ending just as it started, there’s change afoot as we head into 2022. US futures are trading higher this morning and bitcoin is rallying and gaining strength as it trades back above $51,000. The economic calendar is light today with the Dallas Fed Manufacturing report the only release on the calendar. As one might expect given the time of year, there’s not a whole lot of news driving markets this morning.
Read today’s Morning Lineup for a recap of all the major market news and events from around the world, including the latest US and international COVID trends.
While it didn’t quite hit a new record on an intraday basis last week, the S&P 500 did manage to close at a new record high last Thursday making for the 68th record closing high in 2021. While the all-time record of 77 from 1995 is now out of reach, 2021 is guaranteed to rank second in terms of the most record closing highs in a given year.

Start a two-week trial to Bespoke Premium to read today’s full Morning Lineup.