Energy Stocks to Oil Ratio Below Average
Oil has had a strong start to the year thus far, and Energy has been the best performing equity-market sector on a year to date basis by a wide margin. This is due to the fact that the performance of the Energy sector (XLE) tends to be highly correlated to the price of oil, holding a correlation coefficient of 0.81. Currently, the ratio of the price of XLE versus oil is below historical averages. The current level is 0.77 and the average since XLE began trading is 0.99, suggesting there may be upside in the energy sector should oil hold its current levels. However, the ratio is still in a ‘normal’ range, as it is less than one standard deviation away from the historical average.

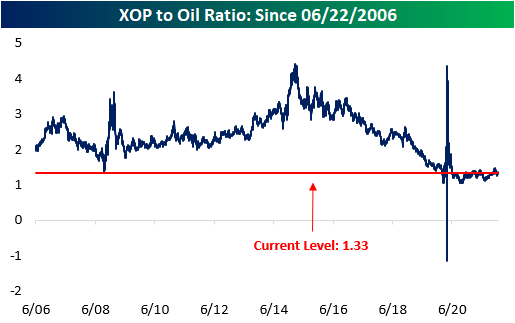
The Oil and Gas Exploration and Production industry (XOP) tends to be correlated with the price of oil as well (coefficient of 0.80). Historically, the ratio of XOP versus Oil has an average of 2.36, but the current level is far lower at 1.33. Additionally, the ratio is 1.7 standard deviations away from the average, which may imply that there is an opportunity to capitalize on a mispricing of XPO relative to the price of oil. However, since the start of 2020, the ratio has been suppressed and there is little evidence to suggest that this will change any time soon. Stay tuned as we will be releasing a deeper dive into oil tomorrow! Stay on top of market trends by becoming a Bespoke subscriber today. Click here to view Bespoke’s premium membership options.
As always, past performance is not a guarantee of future results. This is for informational purposes only and is not a recommendation to buy or sell a specific security.
Bespoke Morning Lineup – 1/13/22 – More Inflation Data
See what’s driving market performance around the world in today’s Morning Lineup. Bespoke’s Morning Lineup is the best way to start your trading day. Read it now by starting a two-week trial to Bespoke Premium. CLICK HERE to learn more and start your trial.
“Today people who hold cash equivalents feel comfortable. They shouldn’t. They have opted for a terrible long-term asset, one that pays virtually nothing and is certain to depreciate in value.” – Warren Buffett
Futures were mixed ahead of the December PPI and weekly jobless claims this morning, and the results were mixed. Regarding jobless claims, initial claims came in higher than expected 233K versus estimates for right around 200K. Continuing claims, however, were much lower than expected coming in at a level of 1.559 million versus forecasts for around 1.7 mln. PPI missed at the headline level, rising just 0.2% compared to forecasts for an increase of 0.4%. That was the smallest m/m increase since November 2020. Core PPI, however, was right inline with forecasts at 0.5%.
In reaction to the news, futures have seen a slight lift with all three major averages getting a bit of a lift on the news while treasury yields are little changed.
Read today’s Morning Lineup for a recap of all the major market news and events from around the world, including the latest US and international COVID trends.
The year is only eight trading days old, but already it has been a tough one for growth stocks as the Nasdaq 100 is down more than three times as much YTD as the S&P 500 (-2.54% vs -0.84%). Despite the underperformance, though, you may be surprised by the fact that on the eight trading days so far this year, the Nasdaq 100 has actually outperformed the S&P 500 (5 days) more often than it has underperformed (3 days). As shown in the charts below showing the daily performance of both indices, the only three days that the Nasdaq 100 has underperformed the S&P 500 were on 1/4, 1/5, and 1/7. The reason for the YTD underperformance, however, is that on those three days the Nasdaq 100 underperformed, it significantly lagged.

Start a two-week trial to Bespoke Premium to read today’s full Morning Lineup.
Daily Sector Snapshot — 1/12/22
Chart of the Day – Unpopular Staples
Targeting Prices By Industry
Below we show how far the average stock is trading versus its consensus analyst price target by S&P 500 industry group. As shown, Media and Entertainment stocks are currently the most depressed versus price targets with the average stock in that industry over 20% below its target. That would indicate analysts either need to revise their targets far lower or those names need to rebound to catch up with expectations. On the other end of the spectrum, after a massive run for Consumer Staples stocks in the final months of 2021 and the first few days of this year, the average stock in that industry is actually above its price target. That is the only group in which that is the case, but Automobiles and Components, Food, Beverage, and Tobacco, and Bank stocks are all low single digit percentage points away from their price targets on average.

Given the sector’s massive weight, Tech is one area worth looking at, and under the surface, it is pretty split with regards to stocks’ current price and price targets. Technology Hardware and Equipment has rallied 23.64% since its recent October 4th low, retracing some of those gains this year. With such a rally over the past few months, the industry’s stocks have on average closed the gap on price targets. At the end of December, a little under half of the industry traded above its price target, and the average stock was only 2.3% away from its price target. Meanwhile, other areas of Tech like the Semiconductors and Software and Services have traded at more of a discount to where analysts believe they should be. Software and Services, in particular, has seen some of the weaker readings of the COVID era.


Consumer Staples and Financials have been two of the strongest performing sectors over the past couple of months. As could be expected given this, their stocks are relatively close to analyst price targets. For Consumer Staples, the Household & Personal Product industry is by far the strongest. While there are a small number of stocks in the industry (only six members), the average stock in this sector has actually traded above its target price the past two months and it ended December without a single stock below its target price.
Turning to the Financial sector, the Banks have put themselves ahead of the pack in a similar way. The average stock is only 3.25% below its price target compared to a 12.38% spread at the end of 2021. Additionally, in November and December there were no members of the industry above price targets, but today that number is nearly a third of the industry. Click here to view Bespoke’s premium membership options.

Communication Services Regaining Its Footing
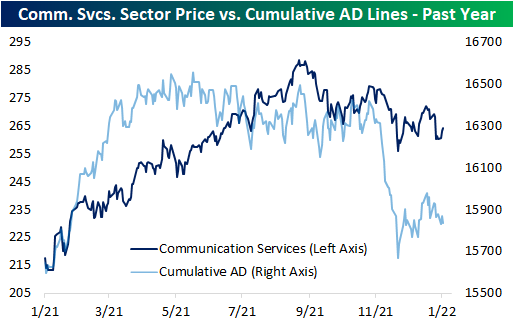
In the past year, one interesting internal disconnect for the S&P 500’s Communication Services sector has been between price and breadth. By the time price peaked in the late summer, breadth, as measured by the cumulative advance-decline (A/D) line, had been trending lower for several months. In other words, in the middle of last year, an increasingly smaller number of stocks were pulling the sector higher. This past fall, bad breadth hit a climax as the cumulative (A/D) line started to collapse just after the sector’s price set a lower high. Since the recent low for both price and breadth in the first days of December, the two lines have been moving more in tandem with each other.
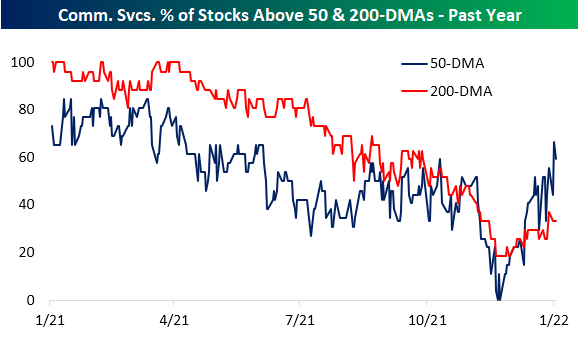
While the cumulative A/D line and price still have plenty of room for further improvement, there has been a significant pickup in the percentage of the sector’s stocks that are trading above their 50 and 200-DMAs. While the reading pulled back slightly to 59.26% yesterday, two-thirds of the sector finished last week above their 50-DMAs which was the strongest reading since April of last year. That reading comes just a little over a month after there was not even a single stock in the sector above its 50-day. The percentage of stocks above their longer-term 200-DMAs has been less impressive with only a third of stocks in the sector currently above that level, but that too has improved in recent weeks. The start of December saw readings in the high teens which marked the worst readings since the COVID Crash. Click here to view Bespoke’s premium membership options.
B.I.G. Tips – Earnings Season on Deck
Another CPI Spike… Now What?
As mentioned in today’s Morning Lineup, the consumer price index (CPI) rose 7.0% year over year in December, the highest rate of increase since 1982. Consumers across America are paying higher prices for everything from bread to gas due to supply chain constraints, labor shortages, easy fiscal and monetary policy, and robust demand. Although this number was in line with estimates, the y/y increase is certainly notable.

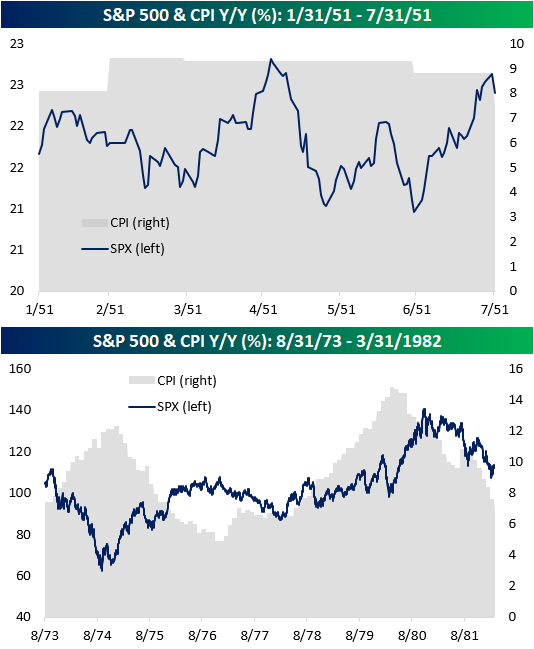
As shown in the chart above, there have only been four other periods since 1950 that y/y CPI reached 7.0% or more (1951, 1973, 1977, 1978), and in the table below we have summarized the performance of the S&P 500 during and after each of those prior periods. Overall, returns were mixed. In January 1951, the S&P 500 was just 0.4% off of its 52-week high when CPI first eclipsed 7%. During the seven months in which CPI remained above 7% on a y/y basis, stocks rallied 3.4%, and one year later, the S&P 500 was up 11.4%.
The longest streak of 7%+ y/y readings occurred between 1978 and 1982 and spanned 46 months. During this streak, the S&P 500 gained just 15.1% over the course of almost four years and just 1.8% in the year following the first reading over 7.0% in May 1978.
In between the 1951 and 1978 periods, there were two other occurrences where CPI eclipsed 7% on a y/y basis in 1973 (28 months) and 1977 (one month), and during both of these periods, equities traded lower.

As you can see from the charts below, the S&P 500 has acted differently each time CPI topped 7.0% on a Y/Y basis. In the first half of 1951, it appeared to trade independently of the elevated inflation readings, moving sideways as CPI readings remained elevated. For much of the 1970’s, however, CPI and the S&P 500 tended to move in opposite directions. Nonetheless, much of the gains experienced in the 70’s were in periods when the rate at which prices were increasing was on the decline. Inflation has typically been considered a negative backdrop of equity prices but a key factor behind that performance is how long-lasting the inflation is. In the early 1950s, when the elevated level of inflation was short-lived, equities, which were already near 52-week highs, performed fine. In the 1970s, though, when inflation was more entrenched, the backdrop for equities was negative. Stay on top of market trends by becoming a Bespoke subscriber today. Click here to view Bespoke’s premium membership options.
The Best and Worst of Q4 Earnings
Earnings season begins this week as corporations report their Q4 results and wrap up fiscal year 2021. Earnings season unofficially begins when the large banks begin reporting their earnings and concludes when Walmart (WMT) releases its results.
We do a lot of earnings season analysis using our Earnings Explorer tool, which is available to Bespoke Institutional subscribers. One type of analysis is tracking how share prices typically react to earnings reports. Since the start of 2011, there have been certain companies that have excelled after reporting Q4 results specifically, while others have historically struggled. Of the companies that have at least five years worth of Q4 reports, Netflix (NFLX), Etsy (ETSY), and SolarEdge (SEDG) have been the S&P 500’s three top performers, averaging 12.4%, 9.6%, and 8.3% gains on their Q4 earnings reaction days, respectively. Charles River Laboratories (CRL), Darden Restaurants (DRI), Signature Bank (SBNY), and Lamb Weston (LW) have beaten Q4 sales estimates every time, while ETSY, Fortinet (FTNT), EPAM Systems (EPAM), Meta Platforms (FB), and LW have beaten Q4 EPS estimates 100% of the time.

Using our Earnings Explorer, below is a look at how Netflix (NFLX) has historically performed on its earnings reaction days broken out by quarter. (For a stock that reports in the morning before the open, that day is its “earnings reaction day.” For a stock that reports after the close, the next trading day is its “earnings reaction day.”) Remarkably, NFLX has historically averaged declines on its earnings reaction days for Q1, Q2, and Q3 earnings releases, but it has absolutely soared on its Q4 earnings reaction days. As shown, the stock has historically averaged a one-day gain of 10.72% on its Q4 earnings reaction day with positive returns 74% of the time. (Conversely, the stock has historically averaged a decline of 6% on its Q2 earnings reaction day (typically in July) with positive returns just 20% of the time.)

As shown, post-COVID, Netflix (NFLX) has had seven quarterly earnings releases, and the only one that the stock reacted positively to was its Q4 2020 report last January when it gained 16.85%. The stock fell 2% or more on each of its six other earnings reaction days post-COVID.

SolarEdge (SEDG) is a stock from the table above that has traded positively on every single one of its Q4 earnings reaction days. Below is a snapshot of SEDG’s historical Q4 reports from our Earnings Explorer tool. As shown, SEDG has historically averaged a one-day gain of 8.3% on its Q4 earnings reaction day with positive returns six out of six times.

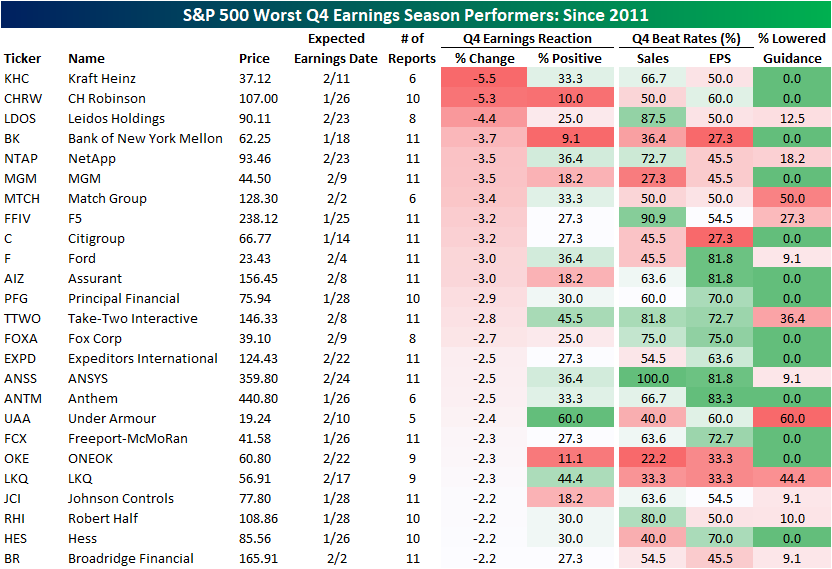
On the other side of the equation, Kraft Heinz (KHC), CH Robinson (CHRW), and Leidos Holdings (LDOS) have historically been the S&P 500’s worst performers after reporting Q4 earnings, averaging a decline of 5.5%, 5.3%, and 4.4% on earnings reaction days since 2011, respectively. None of these names have declined 100% of the time since, but Bank of New York Mellon (BK), CHRW, and ONEOK (OKE) have performed positively less than 15% of the time on Q4 earnings reaction days. Match Group (MTCH) and Under Armour (UAA) have lowered guidance at least 50% of the time on Q4 earnings, and BK, MGM (MGM), Citigroup (C), Ford (F), Under Armour (UAA), OKE, LNQ (LNQ), and Hess (HES) have missed Q4 sales estimates over half of the time.
Turning back to our Earnings Explorer, since the start of the 2020, NetApp (NTAP) has traded lower following an earnings report three times, two of which occurred in Q4. Interestingly, in the Q4 of fiscal year 2020 release, revenues and EPS beat estimates, but the equity still traded lower by nearly 14.5%. NTAP has not experienced gains on a Q4 earnings reaction day in four consecutive years.

As always, past performance is no guarantee of future results, and this is not a recommendation to buy or sell any specific securities.
If you want to stay up to date on earnings reports, we recommend that you start a 14-day trial to our Bespoke Institutional package. With this subscription, you will receive earnings coverage for the most crucial companies through our Conference Call Recaps section.
Bespoke’s Morning Lineup – 1/12/22 – CP-High
See what’s driving market performance around the world in today’s Morning Lineup. Bespoke’s Morning Lineup is the best way to start your trading day. Read it now by starting a two-week trial to Bespoke Premium. CLICK HERE to learn more and start your trial.
“It is a way to take people’s wealth from them without having to openly raise taxes. Inflation is the most universal tax of all.” – Thomas Sowell
The big data release of the day is December’s reading on CPI, and the results came in slightly higher than expected with headline CPI rising 0.5% m/m versus forecasts for an increase of 0.4% while core CPI increased 0.6% compared to forecasts for an increase of 0.5%. On a y/y basis, headline CPI increased 7.0%, and as shown in the chart below, that’s the highest rate of change since 1982.
Despite the higher than expected readings, though, investors must have been expecting worse as futures have legged higher, led by the Nasdaq, in reaction to the report.
Read today’s Morning Lineup for a recap of all the major market news and events from around the world, including the latest US and international COVID trends.
Even as it was expected to be high, the rate of increases in consumer prices for the month of December is still a chart to behold. With the y/y change hitting 7.0%, it is the highest rate of change in CPI on a y/y basis since 1982.

Not only are consumer prices up significantly over the last year, but the pace at which we have reached these levels is nearly unprecedented. A year ago at this time, CPI was only rising at a y/y rate of 1.4%. That rate of increase has now accelerated by a full 5.6 percentage points. Going all the way back to 1951, the only other times that the rate of change in Y/Y CPI increased at a similar or higher rate were in 1951 and 1974.

Start a two-week trial to Bespoke Premium to read today’s full Morning Lineup.