Bespoke’s Morning Lineup – 3/10/22 – Inflation Day
See what’s driving market performance around the world in today’s Morning Lineup. Bespoke’s Morning Lineup is the best way to start your trading day. Read it now by starting a two-week trial to Bespoke Premium. CLICK HERE to learn more and start your trial.
“The best way to destroy the capitalist system is to debauch the currency.” – Vladimir Lenin
It was fun while it lasted. After a much-welcomed rally Wednesday, futures are firmly in the red this morning and set to give up a little more than a third of their gains from yesterday, and as we’ve been typing this the losses have only been mounting. For the S&P 500, that would put this week’s losses at over 2% for the week. Meetings between foreign ministers from Russia and Ukraine did not yield any substantive results, so the fighting looks set to continue. Elsewhere in Europe this morning, the ECB left rates unchanged (as expected), but announced a faster timeline for its plan to wind down asset purchases.
The big economic event of the day is obviously CPI, and it’s not going to be pretty as the headline reading is expected to increase 0.8% relative to January, while the core reading is forecasted to increase 0.5%. Don’t forget about jobless claims, though. The weekly reading on initial claims is expected to come in at a level of 225K. One combination of data that the markets will not want to see is higher than expected readings on both fronts.
Read today’s Morning Lineup for a recap of all the major market news and events from around the world, including the latest US and international COVID trends.
There’s no arguing that the current levels of inflation are high and likely to go even higher in the months ahead. Since the start of 2021, there has only been one month (August 2021) where headline CPI has come in weaker than expected, and the compounded impact of these higher than expected monthly readings is the fact that today’s report for the month of February will mark the 9th straight month that y/y headline CPI has been above 5%. That’s a pretty long streak, but looking back over history, it’s nowhere close to as long as some of the prior streaks we have seen. Late in WWII and into 1920, headline CPI was above 5% for nearly five years. In the early 1940s during WWII through 1951, there were three separate streaks where headline CPI was above 5% y/y for at least a year. Then there was the 1970s coming out of the Vietnam War and into the early 1980s when there were three streaks that lasted at least 20 months including a five and a half year streak ending in 1982.
To put it another way, in the entire decade of the 1970s, more than 75% of all CPI readings were above 5% and the average y/y reading was 7.1%. Inflation is painful right now and will likely get worse from here, but the current period is still nowhere near the 1970s.

Start a two-week trial to Bespoke Premium to read today’s full Morning Lineup.
Daily Sector Snapshot — 3/9/22
B.I.G. Tips – VIX Makes it Seven Straight Above 30
S&P 500 Sector Weightings Report – March 2022
13 Years After the ’09 Bottom
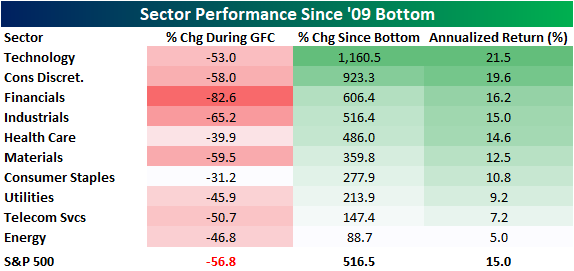
As we highlighted in a post this morning, today marks the thirteen-year anniversary of the 2009 market bottom of the Global Financial Crisis. Since then, the equity market has roared to the upside, rallying 531% (not including dividend) as of yesterday’s close, which constitutes annualized returns of 15%.
As expected, sector performance has been uneven. Technology has led the way to the upside, rising more than 11-fold and booking an annualized return of 21.5%. The Consumer Discretionary sector comes in second, with price appreciation of 923.3% and an annualized return of 19.6%. Energy has been the worst-performing sector, returning just 88.7%, which is an annualized gain of 5.0%. Telecommunication Services is the second-worst, gaining 147.4% (7.2% annualized). Again, all of these returns do not include dividends.
Turning to individual equities, the tables below highlight the thirteen best and worst-performing current members of the S&P 500 since the March 2009 lows. For each stock, we also include how the stock performed during the crisis (10/7/07 through 3/9/09). Starting with the winners, all but two of them fell more than 50% during the crisis with United Rentals (URI) falling more than 90%! All of these stocks have made up for those losses, though, with three rising more than 10,000% (an increase of 100X) over the last thirteen years. Of the current S&P 500 members, DexCom (DXCM) is the best performer in terms of price appreciation, booking an annualized return of 44.1%. NVIDIA (NVDA) and United Rentals (URI) have gained 42.9% and 42.8% annualized, respectively. Apple (AAPL) was already a large company in 2009, but its 35.7% annualized return moved it to the top of the charts in terms of the world’s largest companies.

There are only four current S&P 500 members that have seen negative price action since the bottom of the Global Financial Crisis, with those being Lumen Technologies (LUMN), APA (APA), Viatris (VTRS), and Carnival (CCL). The median annualized return of these names is a loss of 1.8 percent, not including dividends. Just to put this in perspective, only 11 of the 500 names currently in the S&P 500 have performed worse than the current 10-year treasury yield. The only one of these that is higher now than it was at the October 2007 peak is People’s United (PBCT). Click here to view Bespoke’s premium membership options.
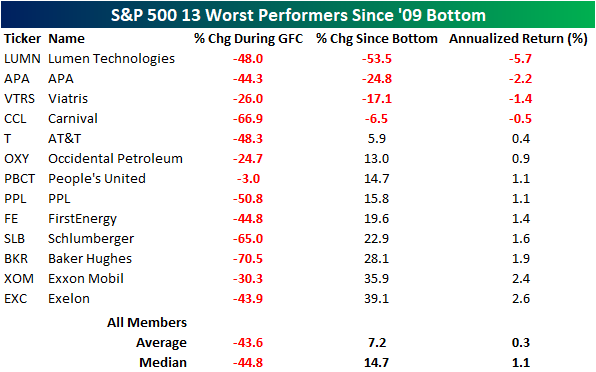
Chart of the Day – Sector Correlation to High Yield Spreads
Bespoke’s Morning Lineup – 3/9/22 – Rally Day
See what’s driving market performance around the world in today’s Morning Lineup. Bespoke’s Morning Lineup is the best way to start your trading day. Read it now by starting a two-week trial to Bespoke Premium. CLICK HERE to learn more and start your trial.
“Your reality is as you perceive it to be. So, it is true, that by altering this perception we can alter our reality.” – William Constantine
Equities are experiencing a monster rally this morning with S&P 500 futures up over 1.5% and the Nasdaq indicated to open higher by more than 2%. European stocks have rallied even more with Germany’s DAX up nearly 5%! As we have pointed out several times over the last several weeks, though, futures are only telling us where the market is now, and where we finish the day can easily look a lot different than it does now. Take the current level of futures, for example. At the open today, the S&P 500 will still be trading below yesterday’s afternoon high. We’ll take what we can get, though.
There’s seemingly not much in the way of a catalyst that can be cited for this morning’s move, but comments from a Russian spokesperson saying that Russia isn’t looking to overthrow the Ukrainian government have been cited by some as contributing to the move. These types of comments have been common over the last two weeks, though, and they differ from what has actually been taking place on the ground in Ukraine.
The only economic report on the calendar this morning is the JOLTS report, but it’s a January report, so it won’t be telling us anything we don’t already know.
Lastly, today marks the 13-year anniversary of the Financial Crisis low in March 2009, ending what was one of the worst bear markets in US history, and if you remember that day, there wasn’t a lot of hope for investors as it looked like there was no way out for the market. The thing to remember regarding bear markets and market corrections, though, is that at the lows, the way out is never obvious.
Read today’s Morning Lineup for a recap of all the major market news and events from around the world, including the latest US and international COVID trends.
Energy stocks have had a rally this year that can only be described as insane. Over the last 50 trading days, the Energy sector ETF (XLE) is up over 40% while the S&P 500 ETF (SPY) is down more than 11%. That works out to a spread of nearly 53 percentage points! Since XLE started trading in 1999, there has never been a 50-trading day period where the XLE outperformed SPY by as wide or wider of a margin.

Looking at the above chart, it’s hard not to argue that the Energy sector has massively gotten ahead of itself. 50 percentage points of outperformance in 50 days? Changing perspective a bit, though, shows just how depressed the Energy sector was relative to the rest of the market. The chart below shows the long-term relative strength of XLE versus SPY since the start of 1999. What a ride it’s been!
Basically from the time XLE started trading to mid-2008, it handily outperformed SPY, but in the 12 years that followed, XLE gave up all of its outperformance and more, only just recently getting back to even. Since the start of 1999, both ETFs have essentially experienced the same returns (+232% for XLE and +238% for SPY). So even after the recent surge in XLE, it is still slightly underperforming SPY over the last 23 years, and if you measure performance since the lows of the Financial crisis, SPY’s performance is more than five times the return of XLE!

Start a two-week trial to Bespoke Premium to read today’s full Morning Lineup.
Happy Anniversary!
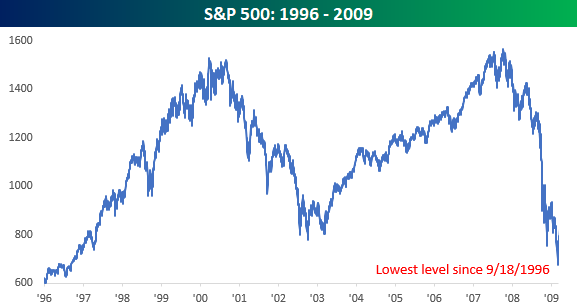
Today marks the 13-year anniversary of the day when things got as bad as they can get for financial markets. After more than a year-long bear market which cut the value of the US stock market by over half, on 3/9/09, the S&P 500 closed at its lowest level since September 1996. A peak to trough haircut of more than 50% is enough, but bear markets are crueler than that, and this one was especially so. A case in point- on its way to zero in 2008, Lehman Brothers saw separate rallies of 24%, 53%, 26%, 70%, 34%, etc. and with each one, investors kept getting sucked back in thinking the worst was over.
Now, replay that scenario with every other stock in the Financials sector and you start to get the picture. On a market-wide basis; in the two weeks after the 2008 Election, the S&P 500 dropped more than 20%. Then, as President-Elect Obama started to announce his cabinet, markets breathed a sigh of relief. The naming of Tim Geithner as Treasury Secretary elicited an especially strong response, and from late November through year-end 2008, stocks recovered and rallied more than 20%. It was a new bull market! But at the start of 2009, any hopes of an enduring rally quickly faded as the S&P 500 resumed its downward slide.
As catastrophic as the stock market declines were, most Americans couldn’t be bothered with it, not because they weren’t busy losing their shirts or retirement saving, but instead because they were too busy wondering if the ATMs would still be working tomorrow or where they would stay when their homes were foreclosed. We hear a lot of market people who consider making it through the COVID Crash as a badge of honor, but for the markets, COVID was just a bad month.
The phrase gets tossed around a lot, but the period spanning the late 1990s through 2009 really was a lost decade for the US equity market and marked the first time since 1941 that the rolling 10-year return for the S&P 500 was negative. In the 1990s, we were all told that stocks only go higher over the long-term, but ten years later we had all just experienced the harsh reality first hand.
If you lived through it, late 2008/early 2009 was as bad or close to as bad as it gets. Financial blood was in the streets and the bodies of failed banks and brokerages were piled up. By March 2009, no one even wanted to hear the word stock, and the mere mention of the stock market was enough to leave you by yourself at a party. As these things often work, March 2009 ended what was a nearly 13-year period of no gains in the stock market and the beginning of a nearly 13-year massive rally. There were bumps along the way, but they were mostly short-lived, and even after this year’s brutal start, the S&P 500 is still up over 500% from those lows.
As much as sentiment has worsened and as painful as the declines from the January highs feel now, they are a blip when viewed in the context of the last 13 years. Just to put things in perspective, on Monday, the S&P 500 fell more than 2.95% for its worst one-day decline since October 2020. From September 2008 through March 2009, though, there were more than 30 one-day declines of 2.95%! For another example, the CBOE Volatility Index (VIX) closed above 30 for the 7th straight day on Tuesday, which is one of just 17 streaks where it has closed over 30 for seven or more days. On 3/9/09, though, the VIX closed at just under 50 in what was the 121st straight day of closes above 30 and ultimately the longest ever streak of closes above 30 (170). In other words, as bad as it feels now, things could get a lot worse.
Conversely, whenever you hear someone say there’s no way out from here for equities, remember March 2009, March 2020 at the COVID lows, and every other bear market or correction low. The way out for the market was never obvious. It never is. Click here to view Bespoke’s premium membership options.
 /
/