Bespoke’s Morning Lineup – 3/24/22 – Energy Back on Top
See what’s driving market performance around the world in today’s Morning Lineup. Bespoke’s Morning Lineup is the best way to start your trading day. Read it now by starting a two-week trial to Bespoke Premium. CLICK HERE to learn more and start your trial.
“I may have been born at night, but it wasn’t last night” – T. Boone Pickens
We’ve had a positive tone in equity futures for most of the night and into this morning, although the magnitude of the implied gains has been waning in the last several minutes. Initial and continuing jobless claims were just released and both came in lower than expected falling to levels not seen in more than 50 years! Durable Goods Orders, however, weren’t as strong with both the headline and ex Transportation readings coming in at negative levels.
On the geopolitical front, today’s NATO summit is likely to result in some headlines later today as more sanctions will be announced. On the ground in Ukraine, Russian troops still appear to be facing much more significant than expected resistance. For more on that, check out our commentary in today’s report. The strong resistance on the part of Ukraine has been impressive and welcome, but also raises the risk of Russia taking more drastic measures to win the war, something none of us hope to see.
Read today’s Morning Lineup for a recap of all the major market news and events from around the world, including the latest US and international COVID trends.
After a brief period mid-month where the sector took a back seat performance-wise, Energy finds itself back on top of the leaderboard with a gain of over 8% in the last week. For the year, Energy is up nearly 40% and once again remains the only sector in positive territory for the year. For much of the year, Energy’s gain meant pain for sectors like Consumer Discretionary and Technology, but both of these sectors are currently ranked in the top four of the eleven sectors with gains of 4.2% and 2.5%, respectively, over the last week. At the bottom of the list, no sectors are down in the last week, but defensive like Real Estate, Health Care, Utilities, and Consumer Staples have lagged with gains of less than 1%. So the market has been in a bit of a risk-on mode lately. Despite their underperformance over the last week, Utilities and Health Care are two of just four sectors that are in overbought territory.

Start a two-week trial to Bespoke Premium to read today’s full Morning Lineup.
The Bespoke Emerging Market 50
The Bespoke Emerging Market 50 tracks emerging market equities that have either strong earnings growth, the potential to recover substantially in the foreseeable future, or unique upside based on the current geopolitical environment. As the name implies, all of these companies are domiciled in emerging market economies (with ADRs). In this report, we highlight risks and opportunities in emerging markets before diving into the differences between our basket and the iShares MSCI Emerging Markets ETF (EEM). The back half of the report involves a brief summary of each of the 50 stocks in the basket, including fundamental insights, growth opportunities, and risks. The Bespoke Emerging Market 50 is updated on a quarterly basis.

The Bespoke Emerging Market 50 is available at the Bespoke Premium level and higher. You can sign up for Bespoke Premium now and receive a 14-day trial to read our Emerging Market 50 report. To sign up, choose either the monthly or annual checkout link below:
Bespoke Premium – Monthly Payment Plan
Bespoke Premium – Annual Payment Plan
Daily Sector Snapshot — 3/23/22
Historic Two Year Rallies
Today marks the two-year anniversary of the COVID Crash low on March 23rd, 2020. After falling 34% from 2/19/20 to 3/23/20, the S&P has seen a gain of exactly 100% since then. Below is a chart showing the rolling 2-year price change in percentage terms for the S&P since index data begins in 1928. Remarkably, this has been the best two-year gain for the S&P since 1937!
As for two other major US indices, the NASDAQ Composite and Russell 2,000 have been on their strongest runs since the period coming out of the Global Financial Crisis. Looking further back, though, the late 1990s saw much larger rallies in two-year spans for the NASDAQ, while the post-GFC era is the only comparable period for small caps.

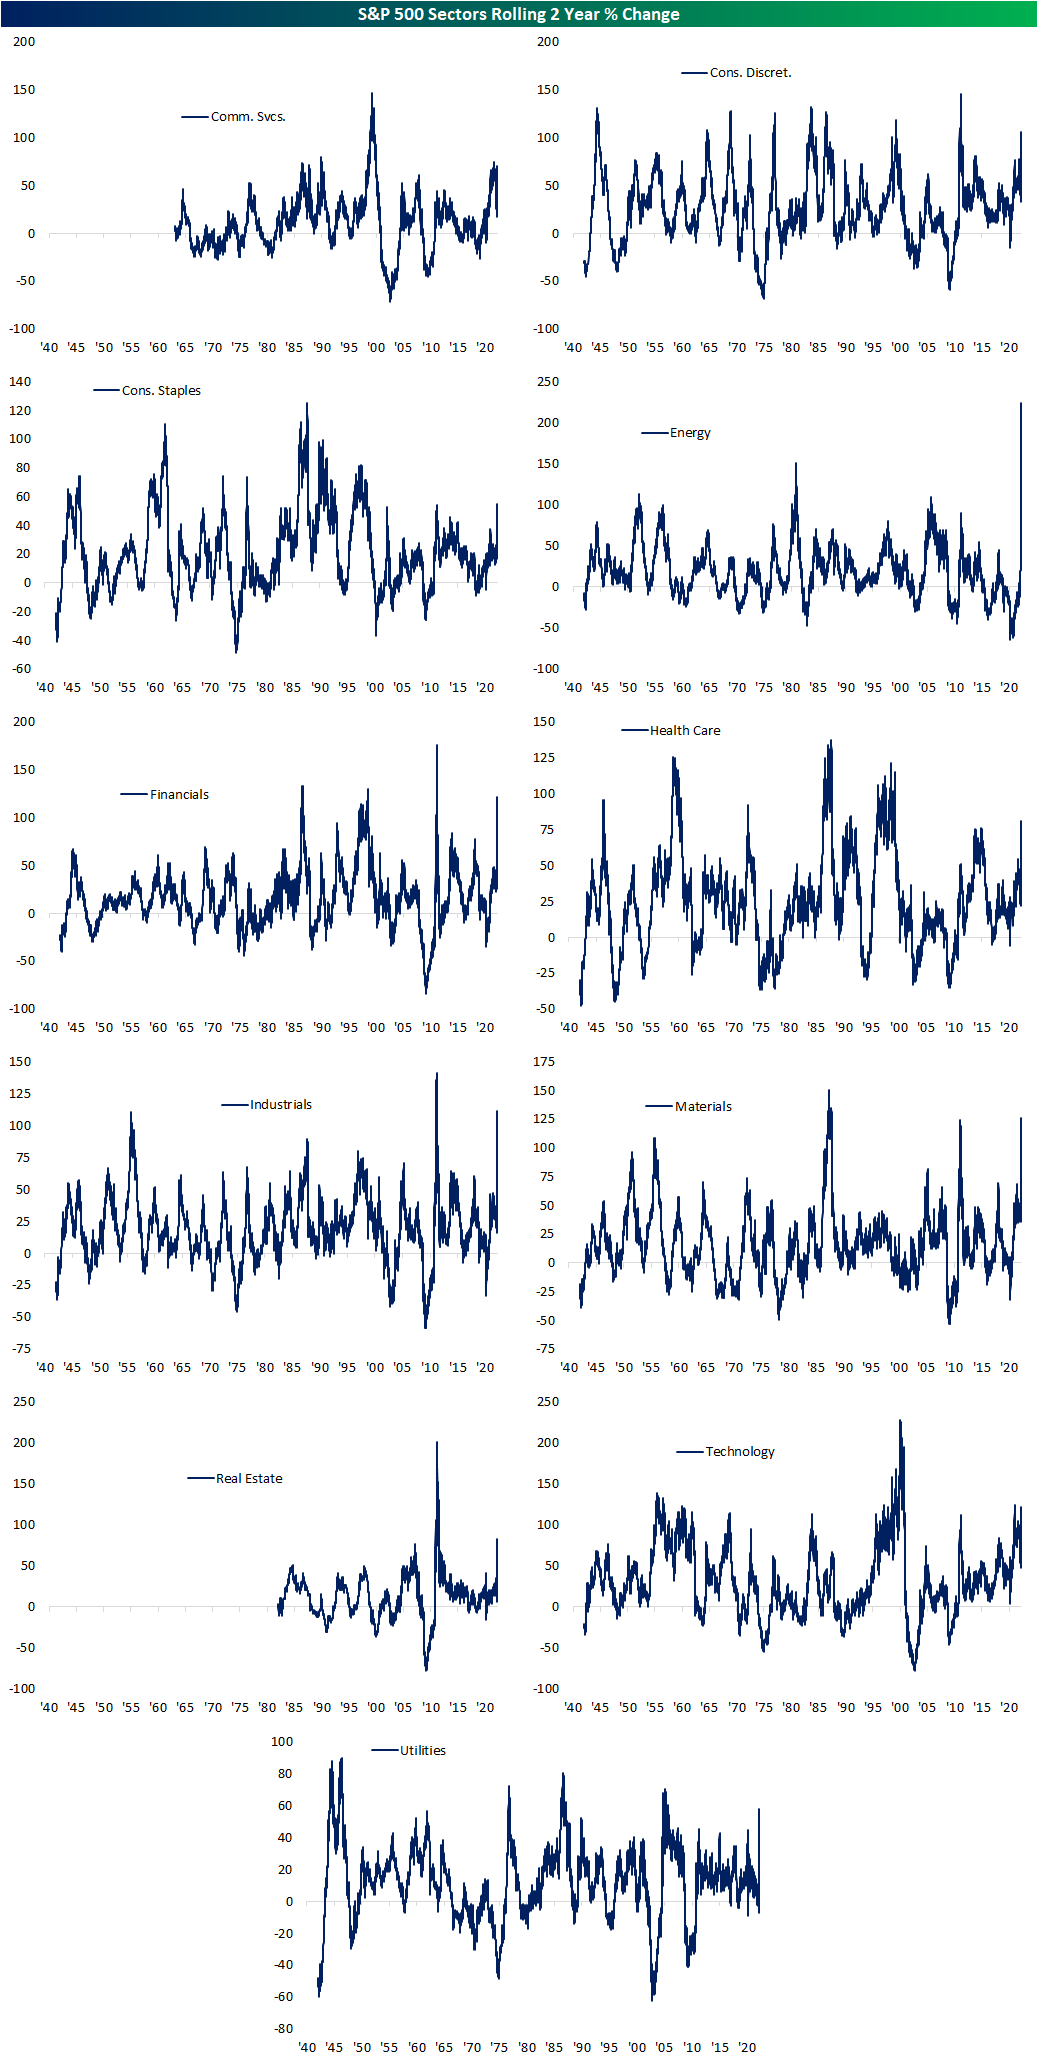
Below we show the rolling 2-year percentage change for the eleven S&P 500 sectors. As you can see, this two-year run stands out as one of the best for most sectors. Energy’s run has blown any previous record out of the water as the sector has risen 224% since the COVID low two years ago. Aside from Energy, the current two-year rallies for most sectors have been the largest since the couple of years coming out of the Financial Crisis or the 1990s for sectors like Technology and Health Care. Click here if you would like to see Bespoke’s premium research.
Best S&P 500 Stocks Since the COVID Crash Lows
Two years ago to the day, the S&P 500 put in a low after a 33.9% pullback from the closing high on 2/19/20. While the S&P 500 is once again off its highs, the index sits just over 100% above that 3/23/20, low and 32.7% above the pre-pandemic high. In the table below, we show the current S&P 500 components which have rallied the most since the COVID Crash low as well as how much each stock declined during the crash.
While it was not a member of the S&P 500 at the time of the COVID crash, being added on 12/21/20, Tesla (TSLA) is currently the S&P 500 member which has risen the most since the broader market low. After being more than cut in half, it has since risen over 1,000%. The next best performers are Devon Energy (DVN) and APA Corp (APA); a couple of Energy sector names that saw even larger declines of 72.8% and 84.86%, respectively from 2/19/20 to 3/23/20. Along since Freeport-McMoRan (FCX), both stocks have risen well over 800% over the past two years. Of the list of the 25 best performers in the S&P 500, the only one that managed to move higher during the COVID Crash was vaccine producer Moderna (MRNA) which had risen 40.43% as the rest of the market collapsed.

By the time of the 3/23/20 low, the index’s worst performers since the pre-pandemic high (2/19/20) had seen monumental declines with many of those stocks dropping over 70%. On the other end of the spectrum, only four stocks had eeked out a gain and only another seven stocks had fallen single-digit percentage points.
As for what those stocks have done since then, below we have created equal weight indices comprised of the S&P 500 members that are still actively traded that were the 20 best and 20 worst performers from 2/19/20 to 3/23/20. Each basket as well as the S&P 500 are indexed to 100 at the COVID Crash low. As shown, what had at one point been the most beaten-down names, have crushed it over the past two years; hypothetically having turned $100 into $481 having even held up well during the recent bout of weakness for equities. For comparison, the biggest winners in the early days of the pandemic bought at the lows would have only seen $100 turn into $137.64 while the S&P 500 as a whole would have a little more than doubled.Click here to view Bespoke’s premium membership options.

“OK” Breadth
With the S&P 500 up over 1% in five of the last six trading days heading into Wednesday, we expected to see some strong breadth readings to go along with the gains, but in looking at the daily readings, since last week’s low, we were a little bit underwhelmed with the readings we saw. Going back to 1990, on days when the S&P 500 was up 1% or more, the average daily advance/decline reading for the index has been +323, and since the lows of the Financial Crisis, the average has been even stronger at +373. Furthermore, an average of one out of every four 1%+ daily gains for the S&P 500 since 1990 have qualified as ‘all-or-nothing’ days (when the net A/D reading for the S&P 500 is greater than +/- 400) while the percentage is 42% since the Financial Crisis low in March 2009. Turning to the five 1%+ days the S&P 500 has had since last Monday, the daily net A/D readings have been +389, +329, +341, +199, and +226, for an average of just +297. That average is modestly below the long-term average, but well below the post-financial crisis average. Not only that but there hasn’t been a single all-or-nothing day since last Monday’s low.
The pace of all-or-nothing days for the S&P 500 hasn’t just been on the low side since the beginning of last week. So far this year, there have only been two all-or-nothing days for the S&P 500 (2/25 and 3/2, both up days), which puts the pace for 2022 at just nine. Normally, when we provide updates on the number of all-or-nothing days in the market, we qualify it with the fact that volatility in the market tends to come in bunches, so the pace of all-or-nothing days usually comes in fits and starts as well. The only difference this time around is that we have already been in what has been a very volatile period for the markets, so if we aren’t getting all-or-nothing days now, how volatile will the market need to get before the pace starts to pick up?
The chart below shows the number of all-or-nothing days in the market by year going back to 1990. While the pace of all-or-nothing days was very slow from 1990 through the early 2000s, once the Financial crisis arrived, the frequency really started to pick up and has stayed elevated ever since. Since 2007, the average number of all-or-nothing days has been 32 per year, but at this year’s rate, the S&P 500 is on pace for just nine all-or-nothing days, which would be the lowest since 2017 and just the second year since 2006 that the total was in the single-digits. Again, there’s still a lot of time left in 2022 for this pace to change, but at the current rate, 2022 is shaping up to be an outlier of a year.
Now that we’ve established that there have been such a low number of all-or-nothing days in the market, what are the implications? One notable one is that with less correlation between individual stocks, there’s less of a tide lifting or sinking all ships environment in the market, and that puts an increased emphasis on stock picking relative to indexing. Click here to view Bespoke’s premium membership options.
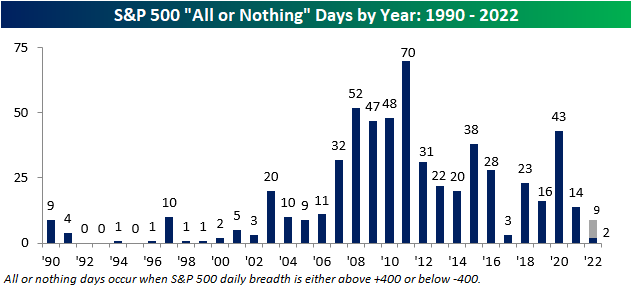
Chart of the Day – Anniversary of COVID Bottom
Bespoke’s Morning Lineup – 3/23/22 – More Fed Speak
See what’s driving market performance around the world in today’s Morning Lineup. Bespoke’s Morning Lineup is the best way to start your trading day. Read it now by starting a two-week trial to Bespoke Premium. CLICK HERE to learn more and start your trial.
“Don’t be afraid to give up the good to go for the great.” – John D. Rockefeller
After Jerome Powell hinted at the possibility of the FOMC hiking rates by 50 bps earlier this week, Cleveland Fed President Loretta Mester became the latest Fed official to throw their hat in the ring in support of a 50 bps hike when she said that she would “find it appealing to front-load some of the needed increases earlier rather than later”. Mester is only the first of a number of Fed officials scheduled to speak today with a roster that includes Powell at 8 AM, Daly at 11:45 AM, and Bullard at 3 PM (all times eastern).
Futures are lower this morning as the Nasdaq leads the declines. There’s been no major news regarding the war in Ukraine. President Biden will be traveling to a NATO summit where the US and EU are expected to issue additional sanctions against Russia, and the White House National Security Advisor warned that the war is not going to be easy or quick. Crude oil and gold are basically flat on the morning, while bitcoin is modestly lower as it continues to trade in what has been a relatively narrow range. Volatility in nickel continues, though, with the metal rallying 15% as that market attempts to find equilibrium.
On the economic calendar, mortgage applications fell more than 8% w/w, and the only other report on the calendar for today is New Home Sales at 10 AM. That report is expected to show an increase of about 1.5% to 814K versus January’s reading of 801K and would be down just under 3% versus last year’s level.
Read today’s Morning Lineup for a recap of all the major market news and events from around the world, including the latest US and international COVID trends.
We have really seen some monumental moves in financial markets over the last few weeks. Since we’re talking about the Federal Reserve, the latest example includes the S&P 500’s performance in the week since last week’s hike. From the close last Tuesday before the Wednesday FOMC announcement, the S&P 500 has rallied 5.85%. Going back to 1994 when the FOMC first started announcing its policy decisions on the day of the meetings, the S&P 500’s performance in the five trading days from the close on the day before last week’s announcement has been stronger than comparable time periods following any other rate hike. Heading into this hike, the S&P 500 was trading down further from its 52-week high than nearly every other rate hike since 1994, so the performance over the last week has helped the market to dig itself out of the hole.
The chart below shows the five-day performance of the S&P 500 following every prior rate hike announcement since 1994. Overall, the average five-day return of the S&P 500 following the 41 rate hike announcements has been a decline of 0.08% with positive returns less than half of the time (44%). The current period is easily the strongest on record, and the only two other periods where the S&P 500’s performance was even close were in March 2000 and before that June 1999. Granted, the S&P 500 was down sharply ahead of this hike, but any time March 2000 is the closest comparison you can find, that’s a comparison bulls don’t want to see.

Start a two-week trial to Bespoke Premium to read today’s full Morning Lineup.
Best Performers Since 3/14 Pivot
Early last week, the US equity market pivoted, gaining 1%+ for four consecutive days between last Tuesday and last Friday (3/15-3/18). Sentiment has shifted amongst the investing community for the time being. For now, it seems that the market may have largely priced in some of the most hawkish Fed tightening scenarios. Remember, we already saw huge drops of 50%, 60%, 70%, even 80%+ in many of the most interest-rate sensitive growth stocks before the Fed even lifted off of 0%. How much further were investors expecting them to go?
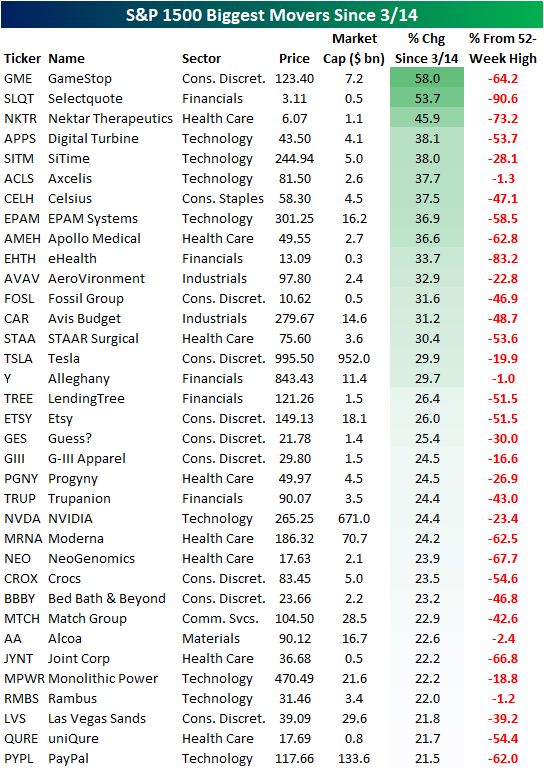
Since the 3/14 pivot, certain members of the S&P 1500 have already gained over 20%, but still remain well off of 52-week highs. Of the top 35 performers since last Monday, the average stock is still 43.4% off of its 52-week highs (median: 47.1%). Although there is much recovery room left for many of these high-flyers, this is a move in the right direction. The top performing stock since the 3/14 close is GameStop (GME), which has moved 58.0% higher on the back of a 30.9% move today. This may imply that investors have increased their risk appetite, or that retail investors viewed the dip as a buying opportunity, which would likely apply to the broader market from a retail perspective. Selectquote (SLQT) and Nektar Therapeutics (NKTR) rank immediately below GME, gaining 53.7% and 45.9% respectively. Both of these stocks are operating at a loss on the bottom line, which tells us that the risk-on trade has performed strongly over the last week. Other noteworthy names on the list include Tesla (TSLA), Avis Budget (CAR), Etsy (ETSY), NVIDIA (NVDA) and PayPal (PYPL).
Breaking this down further, the sectors that help up strongly in the face of a downturn earlier this year have performed the worst since the 3/14 pivot. Utilities and Energy members of the S&P 1500 have only gained 0.6% and 2.6% on average, respectively, since last Monday. On the other hand, Consumer Discretionary, Health Care, and Technology members of the S&P 1500 have gained 7.8%, 8.1% and 10.6% on average, respectively. Based on the data below, the sectors most off their highs have rallied the most aggressively since the pivot, while the sector leaders from pre-3/14 have lagged. Click here to try out Bespoke’s premium research service.

None of the information in this report or any opinions expressed constitutes a solicitation of the purchase or sale of any securities or commodities. This is not personalized advice. Investors should do their own research and/or work with an investment professional when making portfolio decisions. Past performance of any investment is not a guarantee of future results. Bespoke representatives or clients may have positions in securities discussed or mentioned in its published content.
Housing Affordability Slides Out of Reach
After a massive surge in housing prices during the pandemic and recovery, the sticker price of housing has soared. Now, with the Federal Reserve starting to raise interest rates and bond markets creaking under the stress, mortgage rates are up to 4.5% and are nearing the highest levels in over a decade. The result is that the cost of occupying a home (that is, monthly payment needed to cover the cost of a house) has soared. As shown in the chart below, the mortgage payment required to cover the median existing home price at the national average mortgage rate is up nearly 30% over the past year, the fastest advance since at least 1987.

Of course, affordability is also a function of income. If wages are rising rapidly, higher mortgage rates and home prices might be offset by more income to cover those payments. To account for this, we convert the monthly payment implied by the median existing home price and the national average mortgage rate into hours, dividing it by the average hourly earnings of non-managerial workers. As shown in the chart below, at the average hourly wage today, a worker would have to work 51.1 hours to cover a monthly mortgage payment. That’s the highest since August of 2008, and shows that the combination of higher home prices and mortgage rates mean that housing is increasingly outpacing incomes. Of course, with supply still tight, demand could fall quite a bit without a big hit to home prices. But the housing market is getting harder and harder to buy in to for most Americans. That also doesn’t include the fact that down payments are rising rapidly. The median existing home required 2,756 hours worth of average hourly earnings assuming 20% down in February; that’s only been surpassed by the blow-off top for home prices in the mid-2000s. Assuming 5% down, which many first-time buyers are eligible for, the numbers look less scary with 689 hours worth of wages needed. But that’s still rising rapidly. Bottom line: housing prices are rapidly outpacing incomes and that will suppress demand, even if it might not be enough to make up for record low inventories. This analysis was first published last Friday in The Bespoke Report, Bespoke’s weekly newsletter. To receive The Bespoke Report and all of Bespoke’s other reports covering sentiment and positioning, sign up for a two-week trial today.
