Bespoke’s Crypto Report — 4/8/22
Bespoke’s Crypto Report contains numerous technical, momentum, and sentiment charts for bitcoin, ethereum, and other key cryptos. Page 1 of the report includes our weekly commentary on the space and attempts to identify any new trends that are emerging. The remaining pages include important overbought/oversold levels to watch, charts on historical drawdowns and rallies, seasonality trends, futures positioning data, Google search trend shifts, and more. Our weekly Crypto Report is produced so that followers of the space can more easily stay on top of price action, technicals, seasonality, and sentiment.
Sign up for a monthly or annual subscription to Bespoke Crypto to receive our weekly Crypto Report and anything else we publish related to cryptos. Note: If you’re currently a Bespoke Premium, Bespoke Newsletter, or Bespoke Institutional subscriber, you’ll need to subscribe to Bespoke Crypto as an add-on to receive access. The weekly Crypto Report and any additional crypto analysis is not included with our Premium, Newsletter, or Institutional memberships. You can sign up for Bespoke Crypto and receive our Crypto Report in your inbox weekly using the monthly or annual checkout links below. If you sign up for the annual plan, the first year of access is 50% off!
Bespoke Crypto Access — Monthly Payment Plan ($49/mth)
Bespoke Crypto Access — Annual Payment Plan ($247.50 for the first 12 months, then $495/year in year 2 and beyond)

Bespoke Investment Group, LLC believes all information contained in this service to be accurate, but we do not guarantee its accuracy. None of the information in this service or any opinions expressed constitutes a solicitation of the purchase or sale of any securities, commodities, or cryptocurrencies. This service contains no buy or sell recommendations. This is not personalized advice. Investors should do their own research and/or work with an investment professional when making portfolio decisions. As always, past performance of any investment is not a guarantee of future results. Bespoke representatives or clients may have positions in securities discussed or mentioned in its published content.
Bespoke’s Morning Lineup 4/8/22 – Finishing Up a Down Week
See what’s driving market performance around the world in today’s Morning Lineup. Bespoke’s Morning Lineup is the best way to start your trading day. Read it now by starting a two-week trial to Bespoke Premium. CLICK HERE to learn more and start your trial.
“Whenever you see a successful business, someone once made a courageous decision.” – Peter F. Drucker
Equities are looking to finish off what has been a disappointing week on a positive note today, but unless futures build on their early gains during the trading day, the first full week of April looks like it’s going to be a negative one for the S&P 500. For the Russell 2000, the week is already a lost cause as it’s down close to 4%. The economic calendar is light this week with Wholesale Inventories the only release on the calendar. Looking ahead to next week, though, Monday will be quiet, but then in the final three trading days of the week (equity markets are closed on Friday), we’ll get CPI, PPI, Retail Sales, and many other important reports. In addition to a busy week of economic data, next week will also mark the start of earnings season with the major banks kicking things off.
Read today’s Morning Lineup for a recap of all the major market news and events from around the world, including the latest US and international COVID trends.
Bombarded with the same headlines over and over again, it’s easy to become numb to the moves we have seen in the treasury market and lose perspective. In the last five weeks, though, we’ve witnessed an 80 bps increase in the yield on the 10-year US Treasury which ranks as the largest increase during that span in more than 10 years! As shown in the chart below, going back to 1990, there have only been ten other periods where the yield on the 10-year rose 75 bps or more in a five-week span. So moves like this are pretty uncommon, and while we could have gone back further in the analysis, prior to 1990, the yield on the 10-year was consistently much higher, so a 75 bps move was a lot less dramatic. Even in the 1990s, when the 10-year yield averaged more than 6%, a move in the yield of the magnitude we have seen in the last five weeks would have been less dramatic than it has been off the low base of the current period.

Start a two-week trial to Bespoke Premium to read today’s full Morning Lineup.
The Closer – Defensives Lead, Consumer Credit, Intraday Pattern, Supply Chains – 4/7/22
Log-in here if you’re a member with access to the Closer.
Looking for deeper insight into markets? In tonight’s Closer sent to Bespoke Institutional clients, we begin with a look at defensive sector outperformance and bond flows. We also check in on the record in consumer credit creation in February. We follow up with a look at how today’s price action stacks up to other periods of this year. Next, we dive into used car prices and shipping rates. We finish with a review of the crude oil term structure.
If you’re wondering what the Closer is like each day, click here or on the thumbnail image below for a sample of a few pages from the report.

See today’s full post-market Closer and everything else Bespoke publishes by starting a 14-day trial to Bespoke Institutional today!
The Bespoke 50 Growth Stocks – 4/7/22
The “Bespoke 50” is a basket of noteworthy growth stocks in the Russell 3,000. To make the list, a stock must have strong earnings growth prospects along with an attractive price chart based on Bespoke’s analysis. The Bespoke 50 is updated weekly on Thursday unless otherwise noted. There were eight changes to the list this week.
The Bespoke 50 is available with a Bespoke Premium subscription or a Bespoke Institutional subscription. You can learn more about our subscription offerings at our Membership Options page, or simply start a two-week trial at our sign-up page.
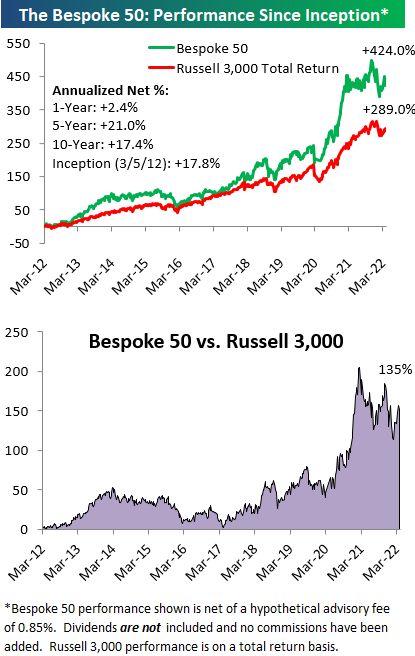
The Bespoke 50 performance chart shown does not represent actual investment results. The Bespoke 50 is updated weekly on Thursday. Performance is based on equally weighting each of the 50 stocks (2% each) and is calculated using each stock’s opening price as of Friday morning each week. Entry prices and exit prices used for stocks that are added or removed from the Bespoke 50 are based on Friday’s opening price. Any potential commissions, brokerage fees, or dividends are not included in the Bespoke 50 performance calculation, but the performance shown is net of a hypothetical annual advisory fee of 0.85%. Performance tracking for the Bespoke 50 and the Russell 3,000 total return index begins on March 5th, 2012 when the Bespoke 50 was first published. Past performance is not a guarantee of future results. The Bespoke 50 is meant to be an idea generator for investors and not a recommendation to buy or sell any specific securities. It is not personalized advice because it in no way takes into account an investor’s individual needs. As always, investors should conduct their own research when buying or selling individual securities. Click here to read our full disclosure on hypothetical performance tracking. Bespoke representatives or wealth management clients may have positions in securities discussed or mentioned in its published content.
B.I.G. Tips – Top Earnings Triple Plays
Bespoke’s Weekly Sector Snapshot — 4/7/22
Bulls Head for the Hills Once Again
After peaking at 32.8% two weeks ago, bullish sentiment continues to roll over as the S&P 500 has erased some of the March gains this week. After this week’s decline of 7.2 percentage points in bullish sentiment, less than a quarter of respondents reported as bullish. While low, that is still a few percentage points above the weaker levels from February.

Bearish sentiment in turn rose 13.9 percentage points which was the biggest one-week uptick since August 2019 when it rose 24.14 percentage points. At 41.4%, bearish sentiment is now at the highest level since the week of March 17th. That is an elevated reading and a big move week over week, but it is also well off recent highs from the past few months that were more than 10 percentage points higher.

The bull-bear spread tipped into positive territory for the first time in 2022 last week, but the big inverse moves between bulls and bears erased much of the past few weeks’ move. The spread is down to -16.7 which is still 13.6 points above the late February low of -30.3.

The big pickup in the number of respondents reporting as bearish didn’t entirely come from the bullish camp. Neutral sentiment also shed a significant amount falling from 40.6% last week to 33.9%. That is essentially mean reversion as neutral sentiment now sits only a couple of points above the historical average. Click here to view Bespoke’s premium membership options.

Treasuries Yields Blow Past Dividend Yields
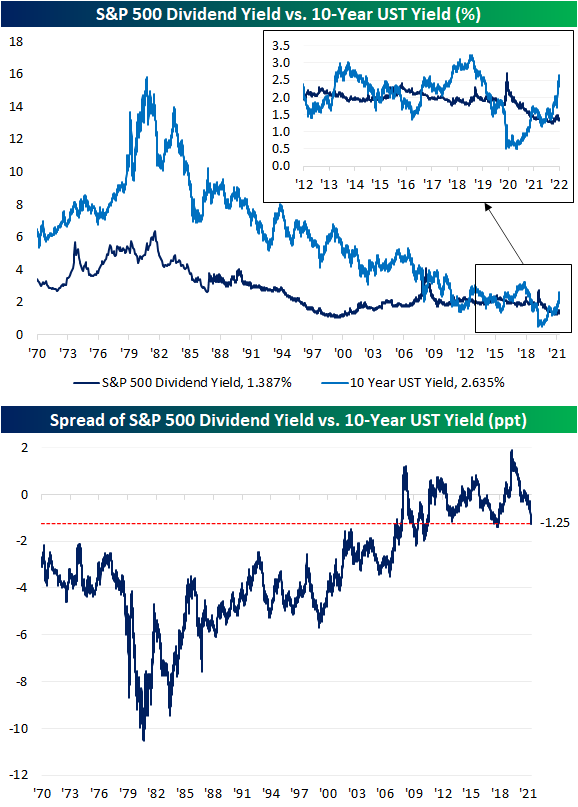
US Treasury yields have experienced a dramatic move higher as the market prices in continued rate hikes in the near future. With the increase in long-term Treasury yields, we’re starting to see what looks like the end of a period where the S&P 500 and the 10-year Treasury fought back and forth over which asset class had a more attractive yield.
As shown in the chart below, from 1970 right up to the period before the global financial crisis, the 10-year yield consistently yielded more than the S&P 500. As the Fed cut rates to zero during the crisis, though, the S&P 500 went on to see multiple periods where its dividend yield was in excess of the 10-year Treasury yield. With the recent surge in yields as the Fed embarks on what the market expects to be an aggressive rate hiking cycle, the script has been completely flipped. The 10-year now offers a roughly 125 bps higher yield than the S&P 500 dividend yield which is the widest spread since the fall of 2018 and before that, the fall of 2011. As the spread between the S&P 500 dividend yield and 10-year Treasury yield hits the low end of the GFC/post-GFC era, we would note that current levels are still roughly 200 bps higher than the historical average going back to 1970. Click here to view Bespoke’s premium membership options.
Near Record Low in Jobless Claims
This week’s jobless claims release was significant in a couple of ways. For starters, the Department of Labor revised seasonal adjustment factors (more on that below) and second, the most recent print for the seasonally adjusted number hit one of the lowest levels on record. Claims came in at 166K which tied the number from two weeks ago (after revisions) for the second-lowest reading on record behind the week of 11/29/68. That week’s reading was only 4K lower.

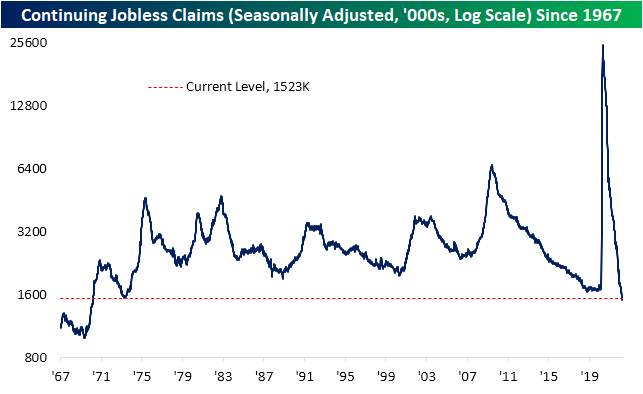
As for continuing claims, this week’s reading was higher rising from 1.506 million to 1.523 million. Having come off last week’s low, that remains one of the strongest levels since 1970.
Pivoting back to initial claims, while adjusted claims are at multi-decade lows, non-seasonally adjusted claims are very healthy but not quite at a record. At current levels of 193.1K, the only year with a lower reading for the comparable week of the year was 1969 (170K) but at the seasonal lows in the few years prior to the pandemic, claims were even stronger than they are now. So while unadjusted claims are strong, the seasonally adjusted number was even more eyecatching this week.
As for why the seasonally adjusted number appears so much stronger, as shown in the second chart below, the current week of the year has historically been the second most consistent week of the year in seeing a week-over-week increase in claims. As a period with consistent seasonal headwinds, the seasonal adjustment would control for this by depressing the level of claims by a relatively strong seasonal factor. That usual increase was not seen this year as NSA claims were actually slightly lower falling from 196.8K to 193.1K. That means seasonal adjustment helped out what was already a strong number.
Additionally worth noting this week is the DOL changed its seasonal adjustment methodology. The DOL fully describes the change in this week’s release and links to further reading on the topic for those interested in going deeper into the weeds, but to briefly summarize: periods when the level of an economic indicator experiences historic shifts in levels as claims did in 2020 and 2021, multiplicative adjustment (which has been used in “normal times” like prior to the pandemic and from here forward) would tend to over or understate adjusted claims. Additive adjustment, on the other hand, is less affected by the actual level of the indicator meaning it would lead to more accurate approximations of seasonally adjusted numbers in times of sudden spikes in the series. This methodology has been used throughout the pandemic period. Now that claims have more or less returned to a more normal range of readings, the DOL sees it justifiable to switch the seasonal adjustment methodology back to multiplicative. While that does not mean too much for interpreting claims, that change in methodology has led to some large downward revisions. Click here to view Bespoke’s premium membership options.
