Daily Sector Snapshot — 4/13/22
Short Interest Trade Mirrors Last Year
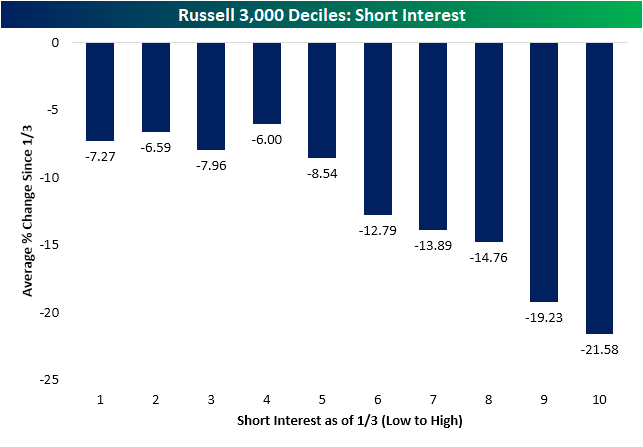
The first quarter of last year was marked by a period of massive short squeezes leading to outperformance of stocks with high levels of short interest. A little over one year later, the opposite has held true. As shown below, the stocks with the highest levels of short interest at the time of the last all time high on January 3rd have been the worst performers over the past few months. The decile of Russell 3,000 stocks with the highest levels of short interest at the start of the year have fallen 21.5% since January 3td while the first four deciles of stocks with the lowest levels of short interest have only fallen mid-single digits.
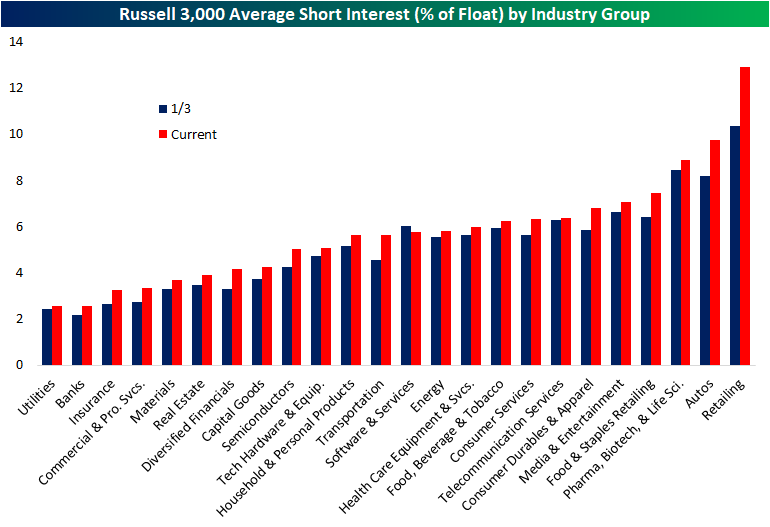
The latest update of short interest data through the end of March hit the tape earlier this week. The average level of short interest as a percent of float for all Russell 3,000 stocks fell sequentially from the mid-March update but with an average short interest reading of 5.78%, current readings are roughly half of one percentage point higher than at the start of the year.
Breaking it down by industry group, retail has seen the biggest increase in average short interest and now has the highest level of any industry group. Autos are the runner-up in both departments as short interest has climbed from 8.2% on January 3rd to 9.75% today. Utilities, Banks, Insurance, Commercial and Professional Services, Materials, and Real Estate, meanwhile, are on the other end of the spectrum as the only sectors with short interest as a percentage of float below 4%.
Turning to individual stocks, Rent the Runway (RENT) now has the most elevated level of short interest as the only stock in the index with over half of its free-floating shares sold short. Conn’s (CONN), however, comes close with 49.16% of its float sold short. Both stocks have seen sharp increases in bearish bets this year as those readings compare to 26.82% and 14.58%, respectively for RENT and CONN. Most of these heavily shorted names have been pain trades this year, but there are a small handful of exceptions. Gogo (GOGO) and Arch Resources (ARCH) have seen substantial rallies of 66.3% and 72.45%, respectively, as the broader market has pulled back. While not as strong of a performance, Dillard’s (DDS) has also rallied solidly gaining 16%.

As previously mentioned, CONN finds itself near the top of the list of the most heavily shorted Russell 3,000 stocks, but it has been the one with the largest increase in short interest of the whole index since the January 3rd high. No other name has seen short interest rise by more than 30 percentage points in that time, but MedAvail (MDVL), Rent the Runway (RENT), and Frontier (ULCC) have seen readings rise over 20 percentage points. Click here to view Bespoke’s premium membership options.

Chart of the Day: Expensive Defensives and Cheaper Cyclicals
Bespoke’s Morning Lineup – 4/13/22 – It Begins
See what’s driving market performance around the world in today’s Morning Lineup. Bespoke’s Morning Lineup is the best way to start your trading day. Read it now by starting a two-week trial to Bespoke Premium. CLICK HERE to learn more and start your trial.
“We remain optimistic on the economy, at least for the short term – consumer and business balance sheets as well as consumer spending remain at healthy levels – but see significant geopolitical and economic challenges ahead due to high inflation, supply chain issues and the war in Ukraine. – Jamie Dimon
Earnings season basically kicked off this morning as JPMorgan Chase (JPM) reported first-quarter results and is trading down 2% in reaction to the release. While top-line numbers were basically in line with forecasts, bottom-line EPS missed consensus forecasts ending a streak of seven straight quarters where the company topped EPS results. While this may sound like an ominous signal, we would note that despite topping EPS forecasts, the stock has traded lower on its earnings reaction day for six straight quarters.
The quote above is from this morning’s earnings release from JPM, and you better get used to it as we think it is likely to be a major theme of the Q1 earnings season. Consumer balance sheets remain strong coming out of COVID (for now) due to increased savings and a flood of stimulus payments but faced with higher costs and geopolitical uncertainty, there is a major disconnect between how consumers feel and the current health of their checking accounts.
Equity futures are basically flat this morning after a much stronger than expected PPI and some relatively hawkish FOMC commentary from Bullard and Barkin, but they were much higher overnight and have been drifting lower all morning as investors simply can’t find much in the way of positive news to grasp lately.
Read today’s Morning Lineup for a recap of all the major market news and events from around the world, including the latest US and international COVID trends.
This morning we wanted to play a little game to test your chart reading abilities and see how good of a technical analyst you are. Take a look at the chart below. It’s a one-year stock chart of a US company in the period spanning January 2016 through January 2017. Looking only at the chart pattern do you think the stock was higher or lower one year later? Make a decision and click on one of the buttons below to find out if you picked the right trade (the answer will appear in a new tab). Good luck!


Start a two-week trial to Bespoke Premium to read today’s full Morning Lineup.
Daily Sector Snapshot — 4/12/22
Bespoke Stock Scores — 4/12/22
Small Business Disconnections
Sentiment on the part of small businesses deteriorated further in the month of March as the NFIB’s Small Business Optimism Index dropped 2.5 points to 93.2. That took out the January 2021 level for the weakest print for the index since the start of the pandemic in the spring of 2020.

Considering the headline index is only a couple of points above the pandemic low, last month’s reading is only in the 16th percentile of all months on record going back to the start of the report in 1986. The month-over-month decline was also historically large ranking in the bottom decile of all monthly changes. The same could be said for multiple other categories. For example, expectations for the economy to improve and expectations for higher real sales came in at or close to record lows as the month-over-month declines were in the bottom 2% of all monthly moves. This downbeat sentiment was a complete disconnect from the levels of actual sales changes (more on this below). On the other hand, there is a wide variation across categories with top decile readings for several indices like plans to increase employment, current inventories, job openings hard to fill, and compensation-related indices.

Many of the strongest readings of the report are related to employment. Plans to increase employment have pulled back significantly from pandemic highs and are back within the range of readings from the few years prior to the pandemic. Regardless, March’s reading was in the top decile of historical readings. Actual reported changes to employment, however, have continued to fluctuate around zero and were negative in March meaning small businesses saw a decrease in hiring. That lack of hiring comes as businesses continue to report historic difficulty in filling open roles. This reading too has been rolling over though. That is echoed by fewer businesses reporting the cost or quality of labor as their single biggest concern. That combined reading has fallen from a high of 40% in September of last year to only 30% today. As other issues (namely inflation) have taken precedent as the main concern of small business owners, cost of labor remains elevated with near-record but peaked readings in compensation and compensation plans.

As employment metrics remain elevated but show signs of rolling over, readings on expectations for general conditions and sales remain weaker. Outlook for general business conditions stands out as the weakest reading of the report as the index dropped another 14 points in March to set the bar even lower for a record low. Given the pessimism surrounding business conditions, the share of businesses reporting now as a good time to expand fell for the third month in a row to match the February 2021 low. One likely reason for the aforementioned pessimism is soaring prices shown through yet another record high set by the higher prices index.
Not only has the outlook for general business conditions soured, but so too have sales expectations. Small businesses reported the worst expectations for sales since the spring of 2020. The only other period in the history of the data going back to 1986 with as weak of an optimism reading for sales was during the Great Recession. That stands in stark contrast with the actual reported sales changes. Small businesses actually reported positive momentum for sales, though, higher costs are likely eating into profitability as actual earnings changes went unchanged at deeply negative levels. In the release, the NFIB highlighted that of those respondents who reported lower profits, 35% blamed higher material costs and 13% reported higher labor costs. Another 23% blamed weaker sales. Click here to view Bespoke’s premium membership options.

Chart of the Day: Inflation Concerns Dominate But What About Sales?
A Lot Can Change in a Year
It was a little more than a year ago that we remember reading the following article in The Wall Street Journal and articles like it all over the place:
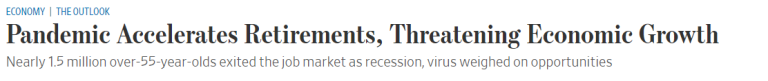
The gist of it was that COVID pushed older Americans out of the labor force in droves, and many of them weren’t coming back. This exodus from the labor force would have major societal implications as it would weigh on overall economic growth, decrease worker productivity, and push labor costs higher. As one economist in the article noted, “Historically, the likelihood of seeing workers who decided to retire come back into the labor force is quite low, so we do think that some of the drop in the participation rate with older workers is likely to remain permanent.”
What a difference a year makes. While inflation, which was supposed to be transitory, has ended up looking a lot more permanent, it appears as though the exodus of older Americans from the labor force, which was initially thought to be permanent, may end up being more transitory in nature. The Wall Street Journal highlighted this trend today:

While it may not be for the best reasons, many older Americans who left the labor force when COVID hit found that after accounting for inflation at multi-decade highs, their nest eggs will not be as supportive of their retirement plans as they originally thought, and that’s pushing them back into the labor force.
While the implication of workers leaving the labor force was for slower growth, lower productivity, and higher labor costs, an influx of workers should increase growth, increase productivity, and put downward pressure on labor costs. It’s all about supply and demand. The reason for workers returning back to the labor force may not be the most favorable for them, but amazingly, the exodus of older Americans from the labor force didn’t even last as long as the “farewell’ tours from the Eagles or The Who! Click here to try out Bespoke’s premium research service.
Bespoke’s Morning Lineup – 4/12/22 – Inflation Not As Terrible As Expected
See what’s driving market performance around the world in today’s Morning Lineup. Bespoke’s Morning Lineup is the best way to start your trading day. Read it now by starting a two-week trial to Bespoke Premium. CLICK HERE to learn more and start your trial.
“In spite of the cost of living, it’s still popular.” – Kathleen Norris
The CPI report that everyone was waiting for has finally arrived and as is usually the case when everyone expects the worst, the results weren’t as bad as feared (although they’re far from good). On a headline basis, CPI rose 1.2% m/m which was right in line with forecasts. Core CPI, however, rose ‘just 0.3%’ compared to forecasts for a gain of 0.5%. Given the weaker than expected core reading, futures have shot higher with the Nasdaq up nearly 1%. As equities have rallied, Treasury yields are falling but still high even relative to where they were last week!
Make no mistake, these readings are still very high relative to recent history. For example, backing out the period since 2020, the 0.3% increase in m/m Core CPI would have been the highest since March 2006. Compared to recent trends and what people were expecting, though, this morning’s report was a positive surprise.
Read today’s Morning Lineup for a recap of all the major market news and events from around the world, including the latest US and international COVID trends.
We all know that recent inflation data has been high, but the consistency of upward pressure has been incredible. It’s a popular narrative that the Fed is behind the curve, but they’re not the only ones. Economists have simply not been able to catch up and get ahead of the persistent trend of rising prices. The chart below shows the rolling 24-month total of the weaker than expected m/m headline CPI reports going back to 2000.
During this span there have only been three months where headline CPI came in weaker than expected. Three!. Going back to 2000, there has never been a period where weaker than expected CPI reports were as scarce as they have been in the last two years.

Start a two-week trial to Bespoke Premium to read today’s full Morning Lineup.