Daily Sector Snapshot — 5/11/22
Precious Metals Harden Up
Little has been safe from heavy selling pressures recently including assets normally considered “safe havens” like precious metals. Gold is currently down over 9% from its March high while silver is down roughly 20% since its spring high. Today, both metals are bouncing from notable levels. For gold, it is finding support at its 200-DMA which also coincides with the rough uptrend line of higher lows of the past year. In addition to dramatic underperformance versus gold, silver’s test of support is perhaps a bit shakier. It is well below its moving averages, but today’s rebound is happening right around the lows from September and December. Granted, on an intraday basis, both yesterday and today’s lows breached those levels.

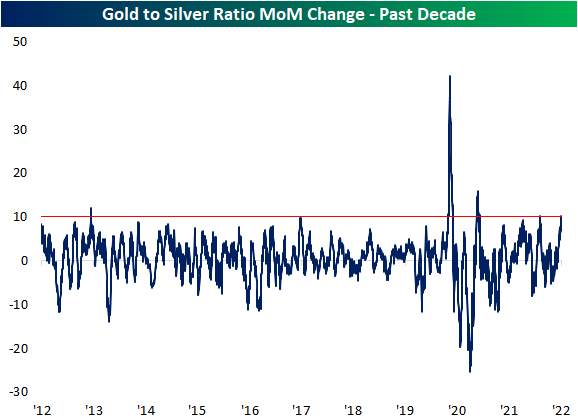
Given silver’s much larger decline, the ratio of gold to silver has ripped higher in the past month. In fact, the ratio has risen over 10% in the past month. The most recent 10% or larger surges were as recent as this past December with two even larger ones in the spring and fall of 2020. Prior to the pandemic, though, these sorts of rapid increases in the gold to silver ratio have been rarer. Before 2020, the only other instances of the past decade were in the springs of 2013 and 2017. Click here to learn more about Bespoke’s premium stock market research service.

Over 40% of S&P 500 Stocks Below Pre-COVID Highs
The world changed dramatically with the onslaught of the COVID pandemic in early 2020. Businesses were forced to digitize, consumers saved at historic rates, the Federal Government and Federal Reserve flooded the economy with cash, new hobbies were picked up faster than a dropped hundred dollar bill, and consumers emerged from the lockdowns financially stronger than ever. Long story short, COVID appeared to permanently alter the ways in which consumers and businesses interact, and companies that stood to benefit from the new way of life saw their stocks surge while the old-economy stalwarts were crushed. That was then.
This is now. As the economy has emerged from COVID, the cost of inputs has skyrocketed, real buying power has diminished, supply chains have become strained, and geopolitical tensions are hot. Not only that, but whereas the rate of fiscal and monetary stimulus was stronger than ever during the pandemic, the headwind from their removal is as intense as it gets.
Given the shifts, a number of stocks that originally surged in the COVID world have been hit hard in the post-Covid environment, and some of the biggest COVID losers during the lockdowns have turned into market leaders. As things currently stand, 40.6% of S&P 500 members are below their pre-COVID highs (closing high price from the start of 2019 through the end of February 2020), even as the index is up 18.0% from its pre-COVID closing high on 2/19/20. Besides the fact that four out of every ten S&P 500 stocks are below their pre-COVID highs, 8.1% of the index members are within 5% of their pre-COVID high and another 7.1% are within 10% of their pre-COVID highs.
At the sector level, three sectors – Communication Services, Real Estate, and Utilities- have more than half of their components trading below their pre-COVID highs. In addition to those three sectors, in both the Consumer Discretionary and Financials sectors, more than 40% of components are below their pre-COVID highs, and another 10% of each sector’s components are within 10% of those former highs. At the other end of the spectrum, the original ‘losers’ from COVID like Energy and Materials have fewer than a quarter of their components trading below their pre-COVID highs. While it seems some days like COVID will never go away, the rallies that a large number of stocks experienced are now nothing more than memories. Click here to view Bespoke’s premium membership options.


Chart of the Day: Nasdaq Down 20% in 30 Days
Bespoke’s Morning Lineup – 5/11/22 – The Most Important CPI Report Ever
See what’s driving market performance around the world in today’s Morning Lineup. Bespoke’s Morning Lineup is the best way to start your trading day. Read it now by starting a two-week trial to Bespoke Premium. CLICK HERE to learn more and start your trial.
“The greatness of a man is not in how much wealth he acquires, but in his integrity and his ability to affect those around him positively.” – Bob Marley

Below is a snippet of content from today’s Morning Lineup for Bespoke Premium members. Start a two-week trial to Bespoke Premium now to access the full report.
The hype surrounding today’s CPI report has reached levels we don’t know if we’ve ever seen for another similar report. Whether it comes in much better or worse than expected, we can pretty much guarantee that like every other report that gets so hyped up, no one will even remember it a few days from now. Outside of the CPI report, energy inventories will be released at 10:30, and given some of the concerns regarding diesel supplies, this report has the potential to be a market mover.
After a back and forth session yesterday, futures are higher again this morning but whether these gains hold or not will largely depend on how CPI comes in relative to expectations. The rally in US futures comes on the heels of a 1%+ rally in major European markets even after German CPI increased at its fastest year/year pace since 1974 (7.4% which was in line with expectations).
Heading into today’s CPI report, treasury yields are lower across the curve, the dollar is lower and WTI is up over 4% and back above $100 to $104 per barrel.
In today’s Morning Lineup, we recap the recent developments in stablecoins (pg 4), overnight earnings (pg 4), Chinese CPI (pg 5), and a lot more.
Inflation running at multi-year highs for the last several months should surprise no one. What sticks out to us is the fact that economists have been so behind the curve in catching up to it. The chart below shows the 24-month rolling number of monthly headline CPI reports coming in lower than expected.
Leading up to today’s report, just three headline CPI reports in the last 24 months surprised to the downside, and the last weaker than expected report was all the way back in September. Before that, you have to go back to the October 2020 report. The current rolling 24-month total of three ranks as the lowest number of weaker than expected reports since at least 2000. There’s been no shortage of criticism for the Federal Reserve and how it has failed to get ahead of the surge in inflation, but economists haven’t fared much better.

Start a two-week trial to Bespoke Premium to read today’s full Morning Lineup.
Daily Sector Snapshot — 5/10/22
The Nasdaq’s Three Day 10% Drop
As of yesterday’s close, the Nasdaq declined more than 10% in the span of just three trading days. Selling pressure has been consistent as well as the Nasdaq notched declines of more than 1% on each of the three trading days. The last time the Nasdaq dropped 10%+ in the three days span with all three days experiencing drops of at least 1% was back in September 2020. Since the Nasdaq Composite started in 1971, there have only been eighteen other occurrences, and nine of those occurred during the bursting of the dot-com bubble.
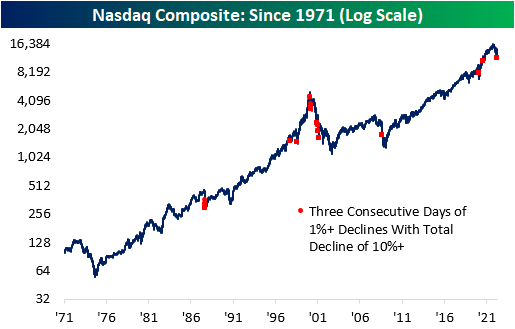
Performance following these prior occurrences has not been very consistent. In the table below, we list each of the 9 occurrences in the chart below that took place without another occurrence in the prior month. One day and one week later, the Nasdaq’s median gain is better than the average and median returns for all periods since 1971. Moving further out though, median performance over the following one and three months has been weaker and less consistent to the upside than the average returns for all one and three-month periods. As has been the case with a lot of analyses lately, while short-term returns have been mixed, the one constant has been volatility. Click here to view Bespoke’s premium membership options.

Bespoke Stock Scores — 5/10/22
Small Business Problems
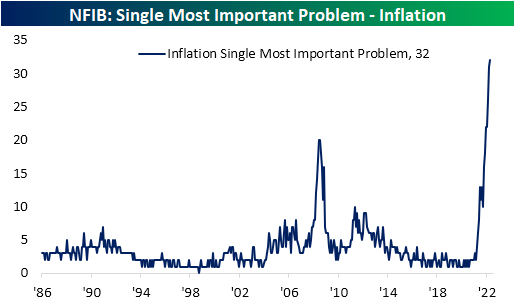
As we noted in an earlier post, inflation appears to be a major driver as to why small businesses are reporting historic pessimism for the US economy. Looking across the most important problems reported by small businesses in the NFIB’s monthly survey, inflation takes the cake as the biggest concern. Nearly a third of responding firms reported higher prices as their biggest problem; the highest level on record in data going back to 1986. That has now surpassed the prior series high of 20% in mid-2008.
Given inflation has stolen such a large share of small business worries, several other problems are now at or near record lows. For example, no firms reported competition from big businesses as the biggest issue. Government requirements and red tape are similarly at a record low after a one percentage point decline month over month. Taxes, poor sales, and financial and interest rates are also not a huge concern according to the survey.

With both government-related concerns dropping yet again, the combined reading between the percentage of respondents reporting taxes and government red tape as their biggest issues hit a new record low of 22%. The past few Presidential administrations have seen this reading more elevated and rising with Democrat presidents while Republican Presidents have coincided with lower readings. The current administration is now an exception with big declines as inflation concerns have come front and center.

The rise of inflation concerns have also resulted in a pullback in the share of respondents reporting cost or quality of labor as the biggest issue. While the combined reading rose one point in April thanks to the quality of labor, the combined reading is well off the peak of 40% from last September. Additionally, for the second month in a row and for the first time in roughly a decade, inflation continues to be the bigger concern. Click here to learn more about Bespoke’s premium stock market research service.

Inflation Slamming Small Business
Sentiment on the part of small businesses held firm in April instead of the further decline that was expected. The headline index came in unchanged at 93.2 versus estimates of a 0.3 point decline to 92.9. That remains some of the lowest readings since the early days of the pandemic.

Under the hood of this month’s report, individual categories were mixed. Like the optimism index, there were four categories that went unchanged month over month while another four were higher. The rest declined with some of those drops resulting in historic lows. Along with other global macro releases, in today’s Morning Lineup we noted the broad weakness in labor market indicators in this month’s report. Businesses reported negative net hiring (unchanged from last month) as there are also still elevated plans to take on new talent but positions are historically hard to fill.

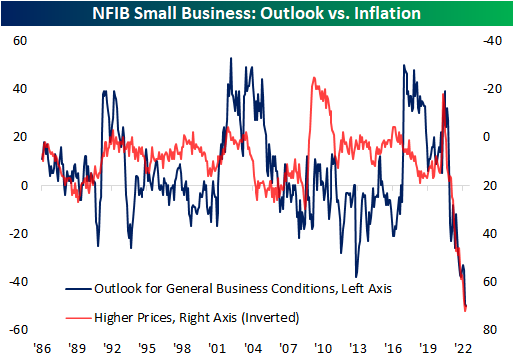
The most stand-out category is the outlook for general business conditions. This index points to record pessimism on behalf of small businesses. A net 50% of responding small businesses reported that they expect the economy to worsen versus improve in the next six months. Meanwhile, the percentage of respondents reporting now as a good time to expand dropped another 2 points and is in the bottom 1% of readings on record; only one point above the April 2020 low. Alongside those record/near record low readings, reported price increases pulled back slightly, though, the index remains at levels well above any precedence.

The NFIB also provided some more granular detail as to why businesses are reporting a lack of plans to expand. As we often note, the survey is often sensitive to politics and that is coming through here. 11% and 8% of responses blamed politics as the reason why now is either not a good time to expand or uncertain that now is a good time, respectively. With few respondents looking to expand on a net basis coinciding with a historic low for expectations for the economy to improve, of course, the dour economic outlook on the part of small businesses is the most widely reported reason to not expand. As shown below, 36% of responses blamed economic conditions as the reason they are not expanding and another 20% that reported uncertainty that now is a good time also blamed economic conditions. While insightful, “economic conditions” is a fairly vague term not providing much further insight into what exact economic conditions are holding businesses back (i.e. inflation or lack of labor).

That being said, we can extrapolate that inflation is likely the biggest reason. For starters, reported higher prices (inverted below) have surged during the pandemic right alongside the free fall in the outlook for general business conditions. Additionally, the percentage of respondents reporting inflation as their firms’ biggest problem hit another record high of 32% this month. Click here to learn more about Bespoke’s premium stock market research service.