Daily Sector Snapshot — 7/13/22
Short Interest Keeps Rising
Over the past few days, equities, including the most heavily shorted stocks, have reversed a good amount of the gains seen since the mid-June lows. A basket of the 100 most heavily shorted stocks in the Russell 3,000 is currently little changed versus its levels at the start of 2020 compared to a roughly 16% gain for the Russell 3000. Whereas heavily shorted stocks saw massive outperformance versus the broader market in the second half of 2020 and early 2021, that outperformance has unwound since last fall. More recently over the past two months, though, highly shorted stocks and the Russell 3000 have been performing more or less in line with each other as the relative strength line has trended sideways and is near similar levels to the COVID Crash.

The most recent short interest data as of the end of June was also updated in the past 24 hours. For the whole of the Russell 3000, the average reading on short interest as a percentage of float currently stands at 6.24%. That is up 20 basis points since the prior update for mid-June and a full percentage point higher versus the start of the year.
Across nearly all industry groups, there have been major shifts in short interest levels since the start of the year. While most have made considerable moves higher, there are others that have actually fallen significantly like Food & Staples Retail and Telecommunication Services. Given the big increases this year, Retail continues to have the highest average reading on short interest followed by the Pharmaceuticals, Biotech &Life Sciences, and the automobile industries. Although their levels of short interest are not as elevated, Software & Services and Energy stocks saw the largest increases from the last report while only the Media & Entertainment industry and Food & Staples Retailing stocks saw declines in average short interest between the two most recent reports. That being said, none of those sequential moves were particularly large with the biggest absolute move being the 0.45 percentage point increase in Software & Services.

Switching over to the individual stocks with the highest levels of short interest, Dillard’s (DDS) currently tops the list with a little more than half of its shares sold short. That reading is only half of a percentage point higher versus mid-June but has nearly doubled since the start of the year. Although it continues to sit near the top of the list, Redbox Entertainment (RDBX), has perhaps seen the most notable shift in levels of short interest versus the last bi-weekly report. Throughout the year, the recent SPAC has seen large swings in its reported short interest levels. Click here to learn more about Bespoke’s premium stock market research service.

Chart of the Day – Notable Streaks of Gains and Losses in Reaction to Earnings
More Burning on Hot Inflation
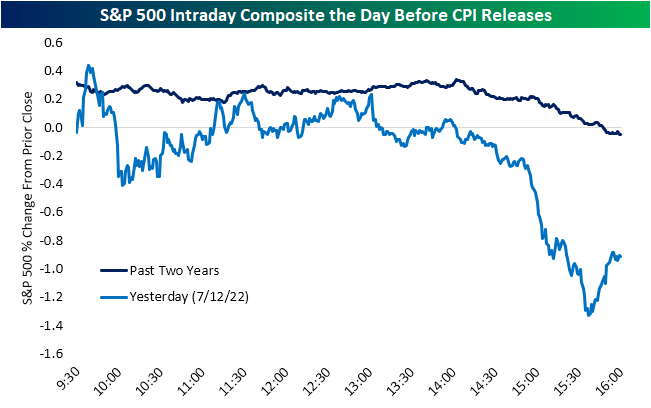
For most of the session yesterday, the S&P 500 was having trouble choosing a direction, but come the final hours of trading with a CPI release looming, the index took a decisive turn lower. Given rampant hot inflation over the past couple of years and its implications for changes to monetary policy, that sort of late day selling ahead of CPI prints has been the norm as shown below. On average for the past two years, the day before CPI releases has typically seen the S&P 500 trade higher for most of the session before turning lower and erasing its gains in the afternoon; just as we saw yesterday.
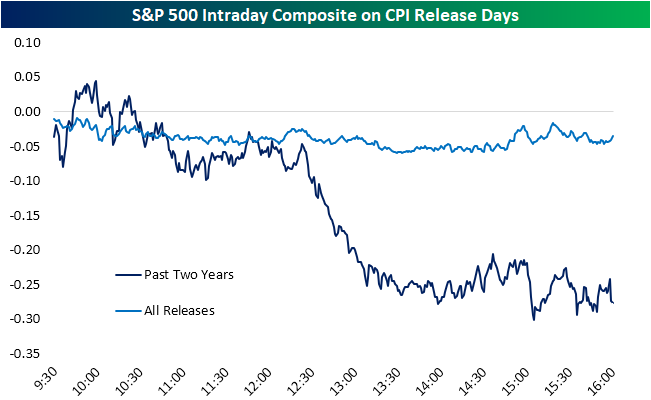
With another hotter than expected print this morning for both headline and core measures of inflation, yesterday’s late day sellers seem to have been on the right side of the trade as the S&P 500 has fallen further and is on pace for the sixth drop on a CPI print in a row. Taking a look at intraday price action of the S&P 500 on CPI release days, historically there has been a downward bias with all releases since 2000 averaging a drop of a few basis points by the close. Over the past two years it has been far worse with an average decline of 28 bps. Most of that drop has actually occurred after a bout of midday selling.
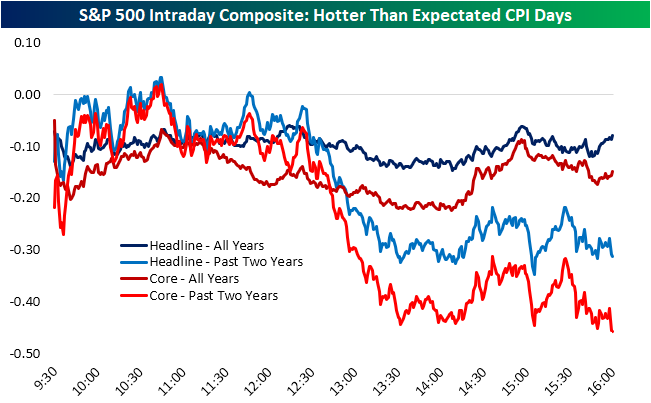
Using data from our Economic Indicator Database, filtering out for only times in which CPI has come in above expectations (on a month over month basis), that same pattern is apparent. The S&P 500 tends to trade in the red for most of the morning but the worst declines occur in the early afternoon before some stabilizing into the close.
In response to today’s hotter than anticipated release, the S&P 500 gapped down 1.2% which ranks as the fourth worst gap down for the index on a CPI day since at least 2000. Going back over the past two decades, there have only been a total of seven gaps down of 1% or more on a CPI day. Including today, four of those releases have occurred this year: February (-1.2%), March (-1%), June (-1.64%), and today (-1.23%). Taking a look at the intraday pattern of the S&P 500 across those 1% or larger gaps, the index has tended to continue to fall throughout the session with the lows of the day tending to occur around 2:30 EST with modest sideways action into the close from there. Click here to learn more about Bespoke’s premium stock market research service.

This Isn’t Normal
With inflation running out of control and markets furiously attempting to re-price Federal Reserve interest rate policy, we’re seeing some truly wild moves in the fixed income markets. This week, the big moves have come at the short-end of the Treasury yield curve as three-month Treasury yields have surged by 35 basis points this week alone. While the 2y10y US Treasury yield curve has been inverted for seven trading days now, the 3m10y curve, which is the FOMC’s preferred measure of the yield curve, has remained positively sloped, but the rate of flattening has really picked up in recent days and since early May has gone from around 225 bps to under 75 bps today. Click here to learn more about Bespoke’s premium stock market research service.

As mentioned above, the bulk of the flattening in the 3m10y curve has occurred more recently. The chart below shows the 20-day rate of change in the 3m10y US Treasury yield curve since 1962. The red line indicates the threshold for 100 bps of flattening in a four-week span which is where we are at now. Prior to the current period, there wasn’t a similar flattening of the 3m10y curve in a four-week span since the Financial Crisis. In August 2011, the rate of flattening got close to 100 bps in a four-week span but came up just shy. In other words, these types of moves in the yield curve don’t happen very often.

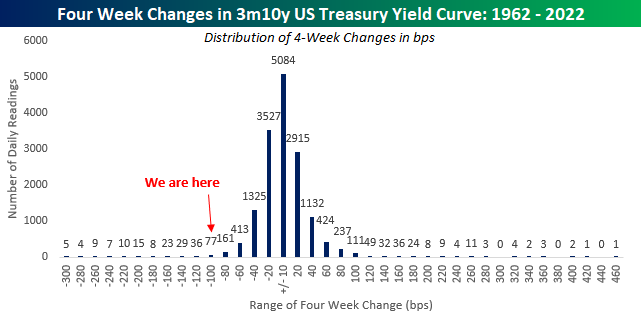
How often are they? The chart below shows the distribution of four-week changes in the 3m10y yield curve over time grouped into 20 bps increments. Including the last few days, where we are at in the current period (-100 to -120 bps of flattening in a four-week span) has only occurred on 77 trading days, and there have only been a total of 223 trading days where the yield curve flattened by 100 bps or more in a four-week period. On a percentage basis, that works out to less than 1.5% of all trading days. When it comes to markets, it seems as though there’s always something unique happening out there, and these days, you don’t see what’s happening at the short end of the Treasury curve very often.
Bespoke’s Morning Lineup – 7/13/22 Buckle Up
See what’s driving market performance around the world in today’s Morning Lineup. Bespoke’s Morning Lineup is the best way to start your trading day. Read it now by starting a two-week trial to Bespoke Premium. CLICK HERE to learn more and start your trial.
“Inflation is like toothpaste. Once it’s out, you can hardly get it back in again.” – Karl Otto Pöhl

Below is a snippet of content from today’s Morning Lineup for Bespoke Premium members. Start a two-week trial to Bespoke Premium now to access the full report.
The big CPI report that everyone is waiting for is finally here, and most investors appear to be leaning on the side of a stronger-than-expected report. However, after two weak days for equities futures are indicated higher in early trading.
Update – The report was just released and headline CPI came in at 1.3% compared to the forecast for 1.1%. On a core basis, CPI rose by 0.7% compared to forecasts for growth of 0.5%.
Earlier this morning, the IMF cut its forecast for US GDP growth down to 2.3% from 2.9%. This news is notable for two reasons. First, it comes less than a month after the IMF downgraded its growth forecast down to 2.9% in late June. Second, given the indication from the Atlanta Fed’s GDPNow model, which is calling for a Q2 contraction of 1.2% following Q1’s decline of 1.6%, the US economy would need to grow by 3.2% in the second half in order to reach that goal. Based on the trend in recent data and the Fed’s tightening bias, that level of growth seems optimistic.
In today’s Morning Lineup, we discuss moves in Asian and European markets, Chinese trade data, and economic data from around the world.
The days of the monthly employment report being ‘the most important indicator’ are long gone, and the new flavor of the month is CPI. Unfortunately for bulls, the trend of recent reports hasn’t been particularly market-friendly. As we have highlighted repeatedly in recent months, the headline CPI report has rarely come in weaker than expected. In the two years through May’s report, there have only been two weaker-than-expected headline CPI reports, which is easily the lowest number over a two-year span in at least twenty years.
When times are tough, there’s a stage in the process where people think that if they only wish hard enough, things will go their way. Unfortunately, elevated levels of inflation are a reality economists can’t simply hope away by consistently low-balling estimates.

Start a two-week trial to Bespoke Premium to read today’s full Morning Lineup.
The Closer – Cranes, Dollars, And Auctions – 7/12/22
Log-in here if you’re a member with access to the Closer.
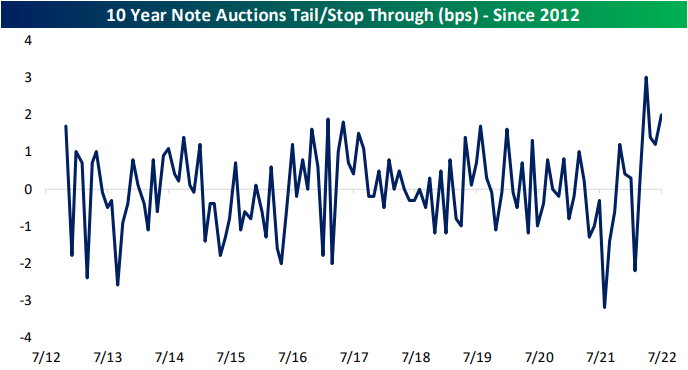
Looking for deeper insight into markets? In tonight’s Closer sent to Bespoke Institutional clients, starting out with some comments on KoneCranes and the stock’s usage as a read on global industrial activity, we then take a quick glance across the moves in markets today (page 1). Next, we take a look into the dollar’s 52-week high and the implications for various sectors (page 2) as well as dollar correlated portfolios (page 3). We then turn to the USDA’s outlook for wheat crops (page 4) before finishing with a recap of another bad 10 year note sale (page 5).
See today’s full post-market Closer and everything else Bespoke publishes by starting a 14-day trial to Bespoke Institutional today!
Daily Sector Snapshot — 7/12/22
Growth at a Reasonable Price (GARP) Basket
Today we are debuting our Growth at a Reasonable Price (GARP) Basket, which utilizes a proprietary algorithm in an attempt to find stocks that may be mispriced relative to their growth. In this report, we highlight some of the flaws of pure growth and value strategies before diving into the potential benefits of a GARP strategy. There are 50 stocks included in the GARP Basket, with brief descriptions provided for each one. This basket is weighted in proportion to S&P 1500 sector weightings and will be updated on a quarterly basis, which gives each company the ability to report an additional quarter of earnings.

Bespoke’s GARP Basket is available at the Bespoke Premium level and higher. You can sign up for Bespoke Premium now and receive a 14-day trial to read our GARP report. To sign up, choose either the monthly or annual checkout link below: