The Bespoke Report – 7/15/22 – Inversion, Earnings, Oh My!
This week’s Bespoke Report newsletter is now available for members.
Earnings started this week, offering updates from corporate America as economic data and macroeconomic policy points towards a looming recession. Commodity prices have continued on their recent declines, while interest rates have been torn between growth concerns and a Fed that feels pressed to do more amidst high inflation. While consumer and producer prices this week we higher than expected, inflation expectations fell and presented a challenge to how the FOMC will communicate its plans for July rates policy amidst broadening core inflation, falling gasoline prices, volatile expectations numbers from consumer surveys, and big declines for market-based measures. We also discuss growth in China, retail sales data, Canada’s own 100 bps tightening this week, Italian political drama, and more in this week’s Bespoke Report.
To read this week’s full Bespoke Report newsletter and access everything else Bespoke’s research platform has to offer, start a two-week trial to one of our three membership levels.


B.I.G. Tips – Retail Sales Bounce Back
Bespoke’s Morning Lineup – 7/15/22 – Crisis of Confidence 43 Years Later
See what’s driving market performance around the world in today’s Morning Lineup. Bespoke’s Morning Lineup is the best way to start your trading day. Read it now by starting a two-week trial to Bespoke Premium. CLICK HERE to learn more and start your trial.
“The erosion of our confidence in the future is threatening to destroy the social and the political fabric of America.” – President Jimmy Carter 7/15/79

Below is a snippet of content from today’s Morning Lineup for Bespoke Premium members. Start a two-week trial to Bespoke Premium now to access the full report.
43 years ago today, President Carter addressed the nation in what has become the now famous crisis of confidence speech. Today, we find ourselves in a very similar situation with rampant inflation and sentiment among Americans at multi-decade lows. Reading through Carter’s speech today, you would have thought he was talking about the present-day United States.
Unfortunately, from an economic perspective, Carter’s speech was followed by two separate recessions (the double-dip) in the next four years. The first started five months later in January 1980 and lasted just six months. The expansion that followed lasted only a year, and in January 1981 a second contraction began lasting 16 months in what at the time was tied for the longest recession since the Great Depression. On a more positive note, there have only been 35 trading days where the S&P 500 closed at a lower level than where it was at the time of Carter’s speech, and the maximum downside was 4%.
This morning, futures are indicated higher in what bulls hope will end a five-day losing streak for the S&P 500, but first, we’ll have to get through the July Empire Manufacturing report, Retail Sales, Industrial Production, Capacity Utilization, Business Inventories, and Michigan Confidence. In other words, look out for landmines.
Speaking of confidence, the Michigan Confidence index is at lower levels now than it was when Carter gave his ‘malaise’ speech and for that matter, at any time since the survey started in the late 1970s. As we all remember, in the preliminary release of that report last month, inflation expectations ticked higher leading to a more aggressive rate hike from the Federal Reserve. Ultimately, that uptick in inflation expectations was revised away, so that will be the key aspect to watch of that report today.
Today’s Morning Lineup discusses policy moves out of DC ahead of the midterms, earnings, news, action in Asian and European markets, and economic data from China.
Carter’s ‘Crisis of Confidence’ speech focused a lot on high energy prices and his proposals to help reduce the US dependence on foreign oil. Ironically, today President Biden is in the Middle East asking Saudi Arabia to pump out more oil into the global market. Thankfully for Americans, we’ve already started to see relief as oil prices are well off their highs from earlier in the year and below $100 per barrel. That has negatively impacted the Energy sector where prices have cratered in recent weeks. Just yesterday, the sector fell another 1.9% taking its peak to trough decline (on a closing basis) down to 26.3% which is actually five percentage points more than the S&P 500 is down from its peak!
In the process of yesterday’s decline, the Energy sector also closed below its 200-DMA for the first time in over 200 trading days (September 2021). While it has been nearly ten months since the Energy sector last traded below its 200-DMA, the streak that just ended wasn’t particularly extreme relative to history. As recently as early 2017, there was a slightly longer streak, and back in August of last year, there was a streak that lasted 185 trading days. The most extreme streaks for the sector occurred back in the late 1990s and early 2000s when there were two separate periods that stretched roughly three years each!

Following its 25% haircut, the Energy sector may have broken support at its 200-DMA yesterday, but it is also right around two other potentially important levels. As shown in the chart below, yesterday’s close coincided with the high from 2019 and is now only modestly above its uptrend line from late 2020 which began when the sector made a higher low following the COVID crash.

Start a two-week trial to Bespoke Premium to read today’s full Morning Lineup.
Bespoke’s Weekly Sector Snapshot — 7/14/22
The Bespoke 50 Growth Stocks — 7/14/22
The “Bespoke 50” is a basket of noteworthy growth stocks in the Russell 3,000. To make the list, a stock must have strong earnings growth prospects along with an attractive price chart based on Bespoke’s analysis. The Bespoke 50 is updated weekly on Thursday unless otherwise noted. There were no changes to the list this week.
The Bespoke 50 is available with a Bespoke Premium subscription or a Bespoke Institutional subscription. You can learn more about our subscription offerings at our Membership Options page, or simply start a two-week trial at our sign-up page.
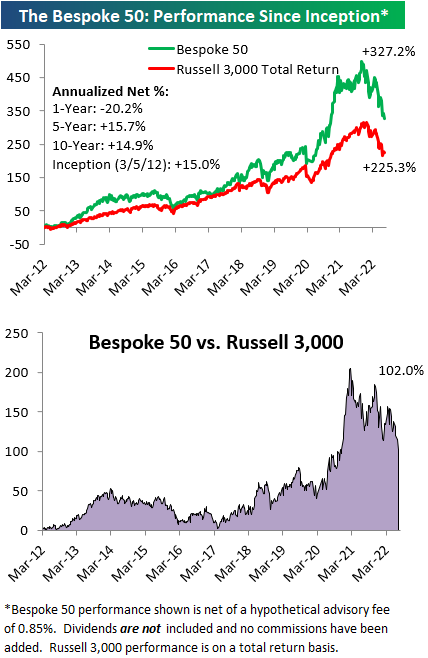
The Bespoke 50 performance chart shown does not represent actual investment results. The Bespoke 50 is updated weekly on Thursday. Performance is based on equally weighting each of the 50 stocks (2% each) and is calculated using each stock’s opening price as of Friday morning each week. Entry prices and exit prices used for stocks that are added or removed from the Bespoke 50 are based on Friday’s opening price. Any potential commissions, brokerage fees, or dividends are not included in the Bespoke 50 performance calculation, but the performance shown is net of a hypothetical annual advisory fee of 0.85%. Performance tracking for the Bespoke 50 and the Russell 3,000 total return index begins on March 5th, 2012 when the Bespoke 50 was first published. Past performance is not a guarantee of future results. The Bespoke 50 is meant to be an idea generator for investors and not a recommendation to buy or sell any specific securities. It is not personalized advice because it in no way takes into account an investor’s individual needs. As always, investors should conduct their own research when buying or selling individual securities. Click here to read our full disclosure on hypothetical performance tracking. Bespoke representatives or wealth management clients may have positions in securities discussed or mentioned in its published content.
Bulls Back Above 25%
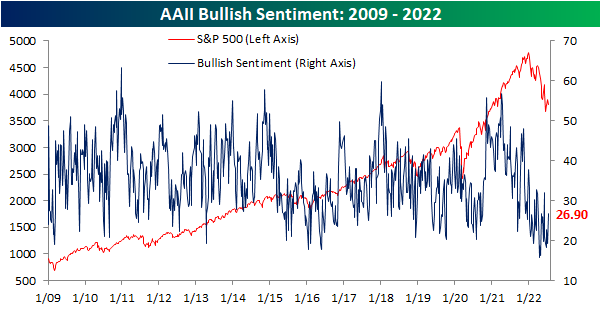
In spite of the S&P 500’s consistent declines in the past week as it failed to take out its late June highs, investor sentiment has turned around (relatively speaking) with this week’s reading from the AAII showing 26.9% of respondents reporting as bullish for the first time since early June. The 7.5 percentage point increase in the percentage of bullish responses this week was a large week-over-week increase by historical standards, although there have been multiple even bigger larger weekly increases over the past few months.
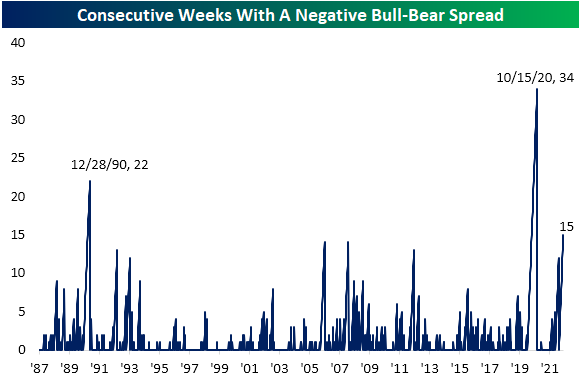
With the increase in bullish sentiment, over a quarter of respondents reported as bullish for the first time in five weeks. Such extended streaks with as depressed readings have been few and far between with the last five-week streak occurring all the way back in the summer of 1993. Overall, there have now only been six streaks in which bullish sentiment remained below 25% for at least 5 consecutive weeks. The longest of these was in December 1990 when it went on for 9 weeks in a row. Albeit a small sample size, historically the end of these streaks have not been raging buy signals for the S&P 500 in the short term with inline performance versus all periods and somewhat weak returns one month out. However, three, six, and twelve months later the S&P 500 has been higher almost every time with slightly stronger than normal performance (six months out from the March 1990 occurrence was the only decline).

The increase in bullish sentiment was met by bears falling back below 50% to 46.5%. Mirroring bullish sentiment, that made for the lowest reading since the first week of June.

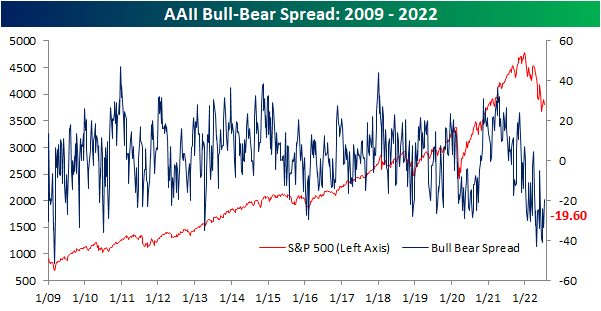
As a result of those moves, the bull-bear spread remains firmly in favor of bears. With the percentage of bearish responses outnumbering bulls by 19.6 points, for the 15th week in a row the bull-bear spread remains negative. That steak has grown to be the third largest on record behind a 22-week streak ending in late 1990 and a 34-week streak ending in October 2020.
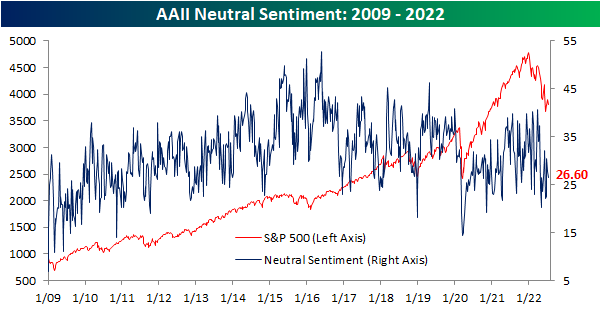
Neutral sentiment has managed to avoid major shifts in sentiment in recent weeks and this week was no exception. This reading fell modestly from 27.8% to 26.6%. That is well within the range of the past couple of years’ readings and is only the lowest since three weeks ago. Click here to learn more about Bespoke’s premium stock market research service.
Seasonal High is Here for Claims
Jobless claims have continued to rise hitting the highest level since November this week. Claims rose from an unrevised 235K up to 244K this week. With consistent increases in claims over the past few months, the reading has gone from multi-decade lows to levels that would have been the highest since late 2017/early 2018 pre-pandemic.

As we have noted each week recently, the current week of the year has historically marked a seasonal peak in claims. As such, the current week of the year has also seen a sequential rise in claims 80% of the time including a rise this week. NSA claims now are at 241.3K which is inline with the comparable readings for the three years prior to the pandemic. Although part of the recent increase in claims is likely seasonal in nature, given evidence of a slowing economy including weakness in other labor market data like under the hood of Friday’s nonfarm payrolls report, how much that seasonal uptick unwinds in the weeks ahead will be something to watch.

As for continuing claims, there has not been as notable of an increase recently when compared to initial claims. Continuing claims have only risen marginally from the low of 1.306 million in the week of May 20th to 1.331 million in the most recent reading as of July 1st. That most recent reading also saw a sizable improvement from the prior week with claims falling from 1.372 million. Click here to learn more about Bespoke’s premium stock market research service.
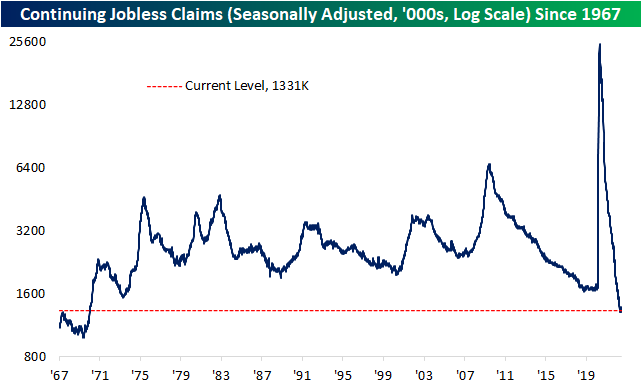
Chart of the Day: Bank Reports Kick Off
Volatile Stocks in Reaction to Earnings
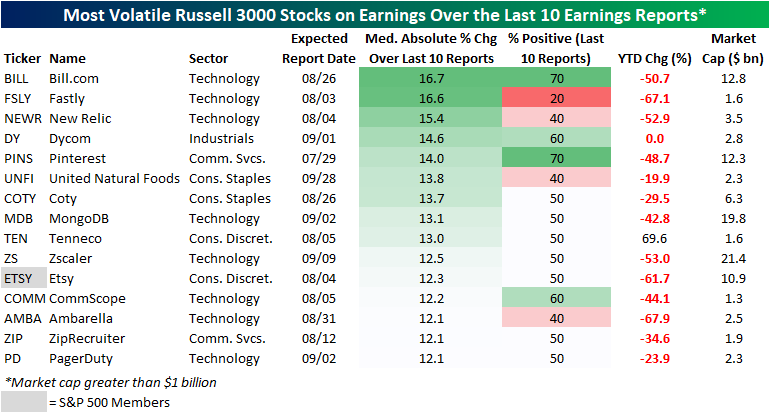
With earnings season kicking off, we wanted to highlight Russell 3000 stocks that in recent history have been the most volatile in reaction to earnings (over the last ten quarters). In order to be included in this list, a stock must have reported at least ten quarters since going public and must also have a market cap over $1 billion. The list includes tech companies, e-commerce players, food producers, and more. On average, these stocks are down 35.1% on a YTD basis (median: -44.1%), which is notably worse than the overall market. We measured volatility by the median absolute percent change on earnings reaction days over the last ten quarters, and these names averaged a move of 13.6% in either direction on their earnings reaction days. The most volatile name has been Bill.com (BILL), followed by companies like Fastly (FSLY), New Relic (NEWR), Dycom (DY), and Pinterest (PINS). Only one of the stocks outlined below is in the S&P 500 (Etsy), and none have a market cap of more than $21.4 billion.
Of course, volatility does not imply direction. Of the 15 stocks outlined below, two – BILL and PINS – have seen seven of their last ten reports result in gains on their earnings reaction day. On the other end of the spectrum, four stocks have seen positivity rates of 40% or less over the last ten reports: Fastly (FSLY), New Relic (NEWR), United Natural Foods (UNFI), and Ambarella (AMBA). If you own any of these names, be prepared for a potentially sharp reaction to earnings (in either direction) when they report this earnings season. Click here to learn more about Bespoke’s premium stock market research service.
Just to show you what we mean, the graphic below shows BILL’s (the most volatile name on the above list) earnings reactions over the last 10 quarters. As you can see, eight of its last ten reports have been followed by a one-day reaction of 10%+, including four moves of more than 20%! Click here to learn more about Bespoke’s premium stock market research service.

Bespoke’s Morning Lineup – 7/14/22 – Streaky
See what’s driving market performance around the world in today’s Morning Lineup. Bespoke’s Morning Lineup is the best way to start your trading day. Read it now by starting a two-week trial to Bespoke Premium. CLICK HERE to learn more and start your trial.
“I am struck that so many of our leaders in the U.S. forget how strong our country can be.” – Jamie Dimon
Below is a snippet of content from today’s Morning Lineup for Bespoke Premium members. Start a two-week trial to Bespoke Premium now to access the full report.
The market has taken on a bit of a streaky vibe in the last few weeks. After four straight down days to close out June where the S&P 500 fell 3.2%, the month of July started out with a four-day win streak where the S&P 500 rallied 3.1%. Since those four days ending last Thursday, the S&P 500 has been down four straight days falling 2.6%. The current four-day losing streak looks like it’s going to extend to five days as futures are indicated another 1.35% lower.
Besides the litany of issues facing the market all year, the catalyst for this morning’s weakness is weak results from Conagra (CAG), JP Morgan (JPM), and Morgan Stanley (MS). CAG is down 2.5% after reporting weaker than expected EPS and lowered guidance, MS is only down fractionally, and JPM is poised to open more than 3% lower putting it on pace to fall in reaction to earnings for the eighth straight quarter.
The commentary from the earnings release for JPM wasn’t particularly uplifting:
“The U.S. economy continues to grow and both the job market and consumer spending, and their ability to spend, remain healthy. But geopolitical tension, high inflation, waning consumer confidence, the uncertainty about how high rates have to go and the never-before-seen quantitative tightening and their effects on global liquidity, combined with the war in Ukraine and its harmful effect on global energy and food prices are very likely to have negative consequences on the global economy sometime down the road. We are prepared for whatever happens and will continue to serve clients even in the toughest of times.”
In economic news, PPI came in higher than expected on both a headline and core basis, while initial jobless claims ticked up to 244K which was the highest level since last November. The rise in jobless claims hasn’t been particularly steep, but it has been consistent ever since, bottoming out in Mid-March.
Today’s Morning Lineup discusses earnings from JPMorgan (JPM) and Morgan Stanley (MS), moves in Asian and European markets, and economic data from around the world.
It’s not just stock prices that have been on the decline this week. Crude oil prices have fallen sharply and WTI briefly traded below its 200-DMA this morning as it trades down near $93. As shown in the chart, while prices did run up in anticipation of the event, all of the increases in crude oil prices since Russia invaded Ukraine have now been erased.

The fact that oil prices are back to levels they were trading at right before Russia invaded Ukraine has been taken as a win by investors, and we wish we could say the same thing about the S&P 500. Unlike crude oil, which has managed to return back to pre-invasion levels, stock prices have kept falling.

Start a two-week trial to Bespoke Premium to read today’s full Morning Lineup.