Claims Better Behind Seasonality
Seasonally adjusted initial jobless claims came in well above expectations today rising from 202K to 229K. Only an increase of 4K had been penciled in by economist forecasts. Although that increase brings claims up to the highest level in about six months, looking back historically it is still within the range of readings in the few years prior to the pandemic and that is also well below the typical readings for much of the history of the data.

Turning over to non-seasonally adjusted claims, recent readings have been much less volatile. In fact, compared to the seasonally adjusted number whose 27K increase was the largest since July of last year, unadjusted claims experienced a meager 1K uptick relative to last week. While the 1K increase during the current week of the year is very much normal (since 1967 72% of the time the 23rd week of the year has seen NSA claims rise WoW), it wasn’t a particularly large increase. On average, the same week of the year has seen unadjusted claims rise 31K. With the caveat that it covered a holiday week and revisions are still possible, that basically means the bulk of the move this week in the adjusted number was due to that seasonal adjustment rather than a material increase in claims. Taking another look at the unadjusted number, the current week of the year is well below the readings for comparable weeks in the years before the pandemic. In other words, the non-seasonally adjusted number points to a bit more strength than the adjusted number leads on.

Taking another look at the effects of seasonal adjustment, below we show the current series for seasonally adjusted and unadjusted claims as well as the adjusted numbers but using 2019 seasonal factoring (essentially removing any impacts on seasonal adjustment of the outlier-like high readings of the pandemic). While there are some minor discrepancies like how the current series had been understating claims relative to 2019 factoring earlier this year and the 2019 factoring was much more volatile around the holidays last year, overall the adjusted series have tracked one another well indicating that the extremely elevated readings of 2020 and 2021 have not had a major impact in undermining the effectiveness of seasonal factoring.

As the unadjusted initial claims number saw little change, continuing claims—lagged an additional week to the initial claims number— were unchanged week over week. Remaining at 1.306 million, it continues to be the strongest reading in several decades. Click here to learn more about Bespoke’s premium stock market research service.

Bespoke’s Morning Lineup – 6/9/22 – Stuck in a Range
See what’s driving market performance around the world in today’s Morning Lineup. Bespoke’s Morning Lineup is the best way to start your trading day. Read it now by starting a two-week trial to Bespoke Premium. CLICK HERE to learn more and start your trial.
“Everything must be taken into account. If the fact will not fit the theory—let the theory go.” – Agatha Christie

Below is a snippet of content from today’s Morning Lineup for Bespoke Premium members. Start a two-week trial to Bespoke Premium now to access the full report.
Well. it was looking like a positive day. Futures were comfortably higher earlier but have pulled back as we approach the opening bell following the ECB’s monetary policy announcement. The European central bank will be ending asset purchases on July 1st, and hiking rates by 25 bps in July and at least another 25 bps at the September meeting.
The only economic data on the calendar today are initial and continuing jobless claims. Initial jobless claims came in at 229K which was more than 20K above forecasts and the highest level since January. Continuing claims, meanwhile, were unchanged at 1.306 million. While initial claims are still at the low end of their historical range, they have also been trending steadily higher now for 12 weeks.
In today’s Morning Lineup, we discuss market and economic developments in China (pgs 4 & 5), the latest ECB rate decision (pg 5), and economic data out of Asia, Europe, and Mexico (pg 6).
With all the volatility that has emblematized 2022, the Memorial Day weekend seems to have really flipped a switch to the Summer doldrums. Over the last eight trading days, the S&P 500 has traded in what has been a relatively tight trading range. During this period, the S&P 500 has traded on either side of 4,125 each day, and the total spread between the intraday high and low has been 2.5% which represents the narrowest eight-day trading range of the year. Investors have been longing for a period of calm in the markets, and for now, at least they’re getting it.

Start a two-week trial to Bespoke Premium to read today’s full Morning Lineup.
Daily Sector Snapshot — 6/8/22
B.I.G. Tips – Economic Malaise
Mortgage Activity Falling Off A Cliff
The economic calendar was light today with the only US releases of note being wholesale trade sales and inventories on top of the regularly scheduled weekly releases for Wednesday. Perhaps the most notable data point was the weekly reading on mortgage applications from the Mortgage Bankers Association. As the national average for a 30 year fixed rate mortgage has resumed its move higher and is once again above 5.5%, mortgage refinance applications continue to fall as fewer homeowners are balking at the highest rates in over a decade. The MBA’s index tracking refinance applications fell for a fifth week in a row. On top of all the other declines over the past year and a half, the index currently sits at the lowest level since December 2000.
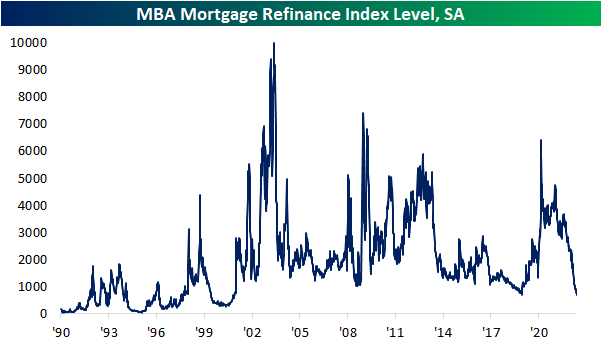
While refinancing activity has completely turned a corner from the historically impressive readings earlier in the pandemic, purchase applications are not as historically depressed, but the picture hasn’t been particularly promising. Falling another 7.1% week over week, today’s reading is one of the worst levels since the spring of 2020, and excluding those early days of the pandemic, it would be the worst reading since November 2016.

Taking a look at the non-seasonally adjusted number, claims have been running at a healthy level relative to the past decade, albeit below the pace of the past couple of years. Late spring is typically when applications set an annual peak as was the case this year (blue dots in first chart below). The high was now exactly one month ago which brings to question how the current decline from the seasonal high stacks up to prior years. As shown in the second chart below, the unadjusted number has fallen just short of 30% over the past four weeks which is one of the most rapid declines from a high of any year since at least 1990. The largest and last time with a comparable drop was in 2010 when it fell almost 40%. 1995, 1999, and 2001 are the only other years that have seen even larger declines from an annual peak than this year.


While the macro backdrop for housing continues to deteriorate, S&P 1500 stocks that are part of various housing-related industries have underperformed the broader market over the past year. Below we show the relative strength lines of a handful of these industries’ S&P 1500 indices versus the S&P 1500 since this time last year. Some groups like Mortgage REITs, Household Appliances, and Home Furnishing have been steady underperformers over the past year while there were others that had managed to hold out. For example, Residential REITs and home improvement stores were actually outperforming handily up until only a few months ago. Of course, the past few months have seen a complete unwind of that outperformance as they have now posted inline returns to the broader market. Click here to learn more about Bespoke’s premium stock market research service.
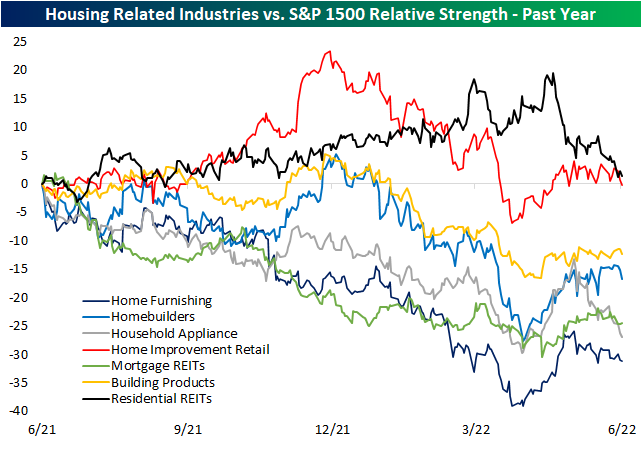
Chart of the Day – Japanese Yen Weakness
Bespoke’s Morning Lineup – 6/8/22 – A Yen for the Dollar
See what’s driving market performance around the world in today’s Morning Lineup. Bespoke’s Morning Lineup is the best way to start your trading day. Read it now by starting a two-week trial to Bespoke Premium. CLICK HERE to learn more and start your trial.
“You must always examine what’s working, evolve your ideas, and change the way you do things.” – Marc Benioff
Below is a snippet of content from today’s Morning Lineup for Bespoke Premium members. Start a two-week trial to Bespoke Premium now to access the full report.
Treasury yields and crude oil are moderately higher this morning and that has put pressure on equities which are just modestly lower. There’s not a lot of economic data to speak of, but weekly mortgage applications fell 6.5% to their lowest level, outside of the early COVID days, since 2016. There isn’t much in the way of a catalyst for this morning’s weakness on the equity side of things, but the fact that the OECD lowered economic growth forecasts for this year and next hasn’t helped.
In today’s Morning Lineup, we discuss the OECD’s downgrade of global growth forecasts (pg 4), central bank actions in emerging markets (pg 4), market activity in Asia and Europe (pg 4), and economic data out of Asia and Europe (pg 5).
The US Dollar is up over 1% versus the yen this morning as the one-way trade in that currency pair continues. Over the last year, the dollar has rallied more than 20% versus the yen, and since the start of the year, the gain has been more than 16%. From a longer-term perspective, the dollar’s rally puts it at the highest level versus the yen since February 2002, and if it rallies another half of one percent, it will be at the highest level since 1998. This rally spells trouble for Japanese consumers, but for manufacturers in the country, the weak yen is a welcome trend.

Start a two-week trial to Bespoke Premium to read today’s full Morning Lineup.