Claims Rise With Single State Surges
Jobless claims have undergone further deterioration in the latest week’s data as the seasonally adjusted number topped 250K for the first time since November, and it has now been over four months since the cycle low. As we discussed in a B.I.G. Tips report earlier, that streak without a new low in claims is not particularly long from a historical standpoint, but it is notable when taking into account past increases in claims prior to recessions. While last week’s reading went unrevised, this week’s reading rose 7K to 251K which is 85K above the early April low.

On a non-seasonally adjusted basis, claims were also higher rising 7.9K to 249K. As we have frequently noted, while adjusting for seasonality claims have reversed trend and have been moving higher during a time of year when they typically rise. Historically, last week would have marked the high, although, that has not always been the case. For example, in 2010 and 2011, and potentially again this year, the seasonal high came during the current week of the year instead. In other words, the continued move higher in claims this week on a non-seasonally adjusted basis is somewhat unusual but not without precedent. While that increase could be on account of residual seasonality, it is hard to parse if it is also potentially on account of the material worsening in claims.

Delayed an additional week to the initial claims number, seasonally adjusted continuing claims jumped 51K this week. While that is not exactly a massive jump, bringing claims only to the highest level since April, the week-over-week increase was the largest uptick since late November.

Below we provide a state-level breakdown of the initial and continuing claims numbers (both non-seasonally adjusted). While there are likely some seasonal factors playing into week-to-week movements, this week there were two unusual moves weighing on the national number. Whereas the net national move in claims was an increase of 7.8K, Massachusetts saw a move nearly double the size of that national change. That state’s initial claims went from under 9K all the way up to 23K; the ninth largest weekly increase on record going back to 1986. While less remarkable of a move but also ranking in the top decile of all periods, South Carolina also saw a peculiar increase with claims more than doubling. While these readings could very well be genuine, we would caution that given their outlier nature, a revision down the road is possible, and that would make this week’s release look somewhat better after revisions than it does today. That being said, revisions likely would not be enough to alter the overall national trend in recent months. Click here to learn more about Bespoke’s premium stock market research service.
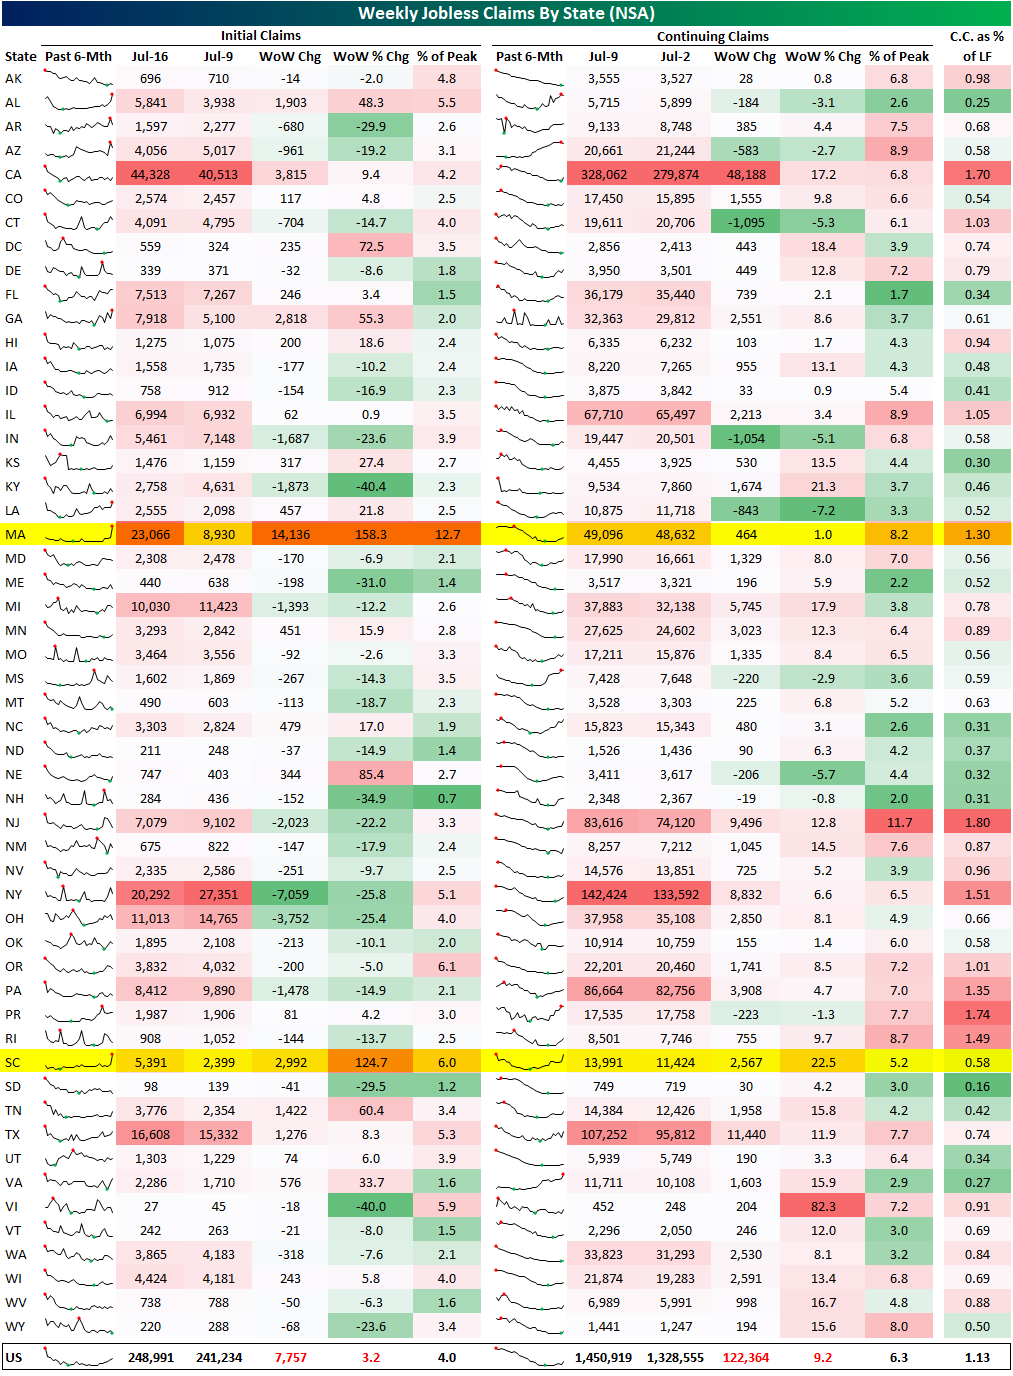
Chart of the Day: Historic Downtrend For Bitcoin Ends
B.I.G. Tips – Jobless Claims Drift Above 250K
Bespoke’s Morning Lineup – 7/21/22 – Another Bull Run Battle
See what’s driving market performance around the world in today’s Morning Lineup. Bespoke’s Morning Lineup is the best way to start your trading day. Read it now by starting a two-week trial to Bespoke Premium. CLICK HERE to learn more and start your trial.
“I like liquor — its taste and its effects — and that is just the reason why I never drink it.” – Stonewall Jackson

Below is a snippet of content from today’s Morning Lineup for Bespoke Premium members. Start a two-week trial to Bespoke Premium now to access the full report.
On this anniversary of the battle of Bull Run, the first major conflict of the Civil War, and as bulls wage another battle against the bear market trend, the above quote from Stonewall Jackson seems applicable. As investors and/or traders, it’s always important to recognize your weaknesses and take steps to avoid them. Those who tend to overtrade or get emotional in reaction to market headlines should take a step back and keep things in perspective. Earnings season is a time of heightened volatility where each major earnings report tends to get extrapolated to the broader economy until the next earnings report sends a different contradictory message.
The market has strung a number of good days together as bank stocks have rallied in reaction to their reports kicking the earnings season off on a positive note. Overall, results have generally been better than expected which has been a good sign. Next week, we’ll get into the heart of earnings season; not only will the pace of reports pick up, but we’ll also hear from the largest companies in the market.
This morning’s market tone is biased to the downside as all the major US averages are indicated to open flat to modestly lower, but there has been some volatility following news of the ECB’s 50 bps rate hike (hinted at earlier this week) hitting the tape. The big move has been in crude oil which is trading down over 4% and near its lowest levels since the first quarter as supplies from Libya ramp up and Russia has resumed the supply of natural gas on the Nord Stream pipeline. On the economic front, it’s a busy day for data with Jobless Claims and the Philly Fed report at 8:30 eastern and leading indicators at 10.
Today’s Morning Lineup discusses earnings news out of Europe and the US, the latest ECB decision, events in the Ukraine and Italy, and economic data from around the world including UK home prices and weekly US mortgage application data.
The rally we have seen in stocks over the last week has been a textbook example of risk-on. Take a look at sector performance below. Besides cyclical sectors leading while defensives have lagged, outside of the Energy sector, the leading sectors over the last week (Consumer Discretionary, Technology, and Communication Services) are also the ones down the most YTD. Conversely, sectors that have declined or seen the smallest gains over the last week have all outperformed YTD. On the topic of energy, while it has been a leader over the last week, today’s 4.5% decline in crude has the sector trading down 2.5% in the pre-market.

Start a two-week trial to Bespoke Premium to read today’s full Morning Lineup.
The Closer – EV Boom, Credit Spread Collapse, Home Sales Plunge – 7/20/22
Log-in here if you’re a member with access to the Closer.
Looking for deeper insight into markets? In tonight’s Closer sent to Bespoke Institutional clients, we start out with an overview of Tesla (TSLA) earnings as well as the United Airlines (UAL), CSX (CSX), and Las Vegas Sands (LVS) earnings (page 1). We then provide an update on the rapid narrowing of credit spreads (page 2) and the changing dynamics of growth relative to value (page 3). After a recap of today’s historic 20 year bond reopening (page 4), we go over existing home sales (Page 5 and 6) before closing out with an update of the latest EIA stockpile data (page 7).

See today’s full post-market Closer and everything else Bespoke publishes by starting a 14-day trial to Bespoke Institutional today!
Daily Sector Snapshot — 7/20/22
Bespoke Baskets Update — July 2022
Best Performers Since Mid-June Low
Since June 16th, the market has reversed course higher, making the date at least a near-term bottom. From a technical perspective, the Russell 1000 broke through its 50-day moving average yesterday and broke above its upper downtrend line today. The 50-DMA is still moving lower, but this is the first time that the Russell 1000 has been above the 50-DMA since April 20th. However, the index is still 9.7% below its 200-DMA. These moves come as commodity prices have pulled back and earnings season begins.

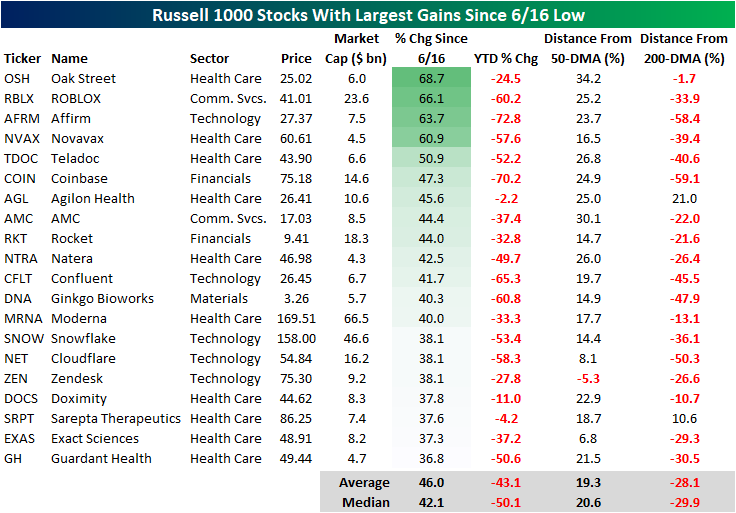
As we highlighted in a Chart of the Day earlier this week, the lagging sectors during bear market declines tend to be the leaders in bear market rallies, which is holding true in the bounce since 6/16. The table below shows the 20 best performing stocks in the Russell 1000 Index since the 6/16 low. As you can see, these stocks are all still down considerably on a YTD basis, declining a median of 50.1%. However, these stocks have rebounded by a median of 42.1% since the low on 6/16. Only one of these stocks is below its 50-DMA, and only two are above their respective 200-DMA. If you think that the bear market has concluded, these would be some of the names worth looking deeper into.
On the other hand, the best performing sectors during bear market declines tend to be the worst performing sectors during bear market rallies. Of the 20 worst performing Russell 1000 stocks since 6/16, 14 belong to the energy sector (which has been the best sector on a YTD basis by a wide margin). On a median basis, these 20 stocks are still up 13.6% on a YTD basis, but they’ve shed 13.7% of their value since the market bottomed in mid June. Notably, these stocks (on a median basis) are closer to their 200-DMAs than they are to their 50-DMAs. If you think that we are currently in a bear market rally that is bound to reverse course, these names would be worth looking deeper into.

Declines Abound in Mortgage Data
Roughly one month ago, the national average for a 30 year fixed rate mortgage peaked above 6%. Since then, the rate has pulled back and stabilized around 5.75% in the past several weeks. Although mortgage rates have stabilized a bit, they remain at some of the highest levels since 2008 and have been heading marginally higher in the past week.

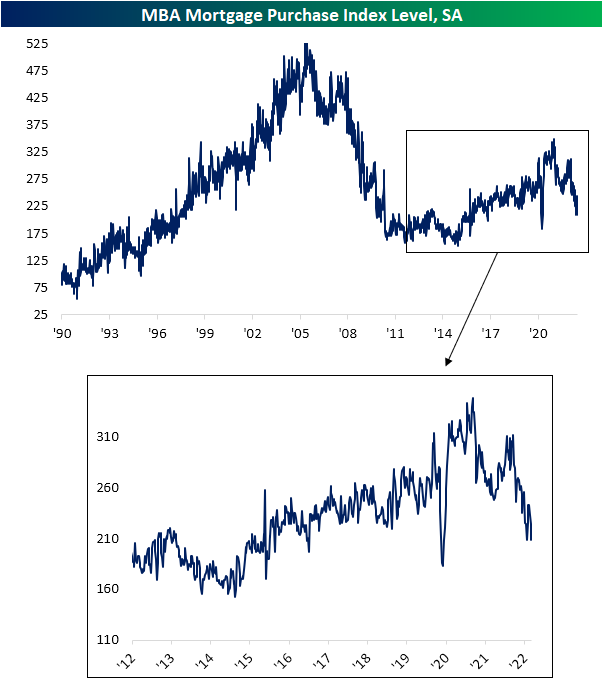
Given the slight rise in rates, demand for mortgages continues to predict further weakness in upcoming home sales data as we noted in today’s Morning Lineup. The MBA’s Mortgage Purchase index released this morning came in at a slightly lower reading than the June 3rd low for the weakest reading in the index since March and April of 2020. This week’s low is also below the range from the few years prior to the pandemic.
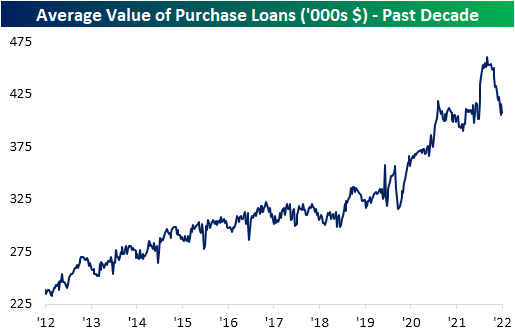
Not only has there been a lower volume of mortgages being applied for, but the actual dollar value of those loans has also plummeted amidst higher rates. As shown below, the average value of purchases reached a high of $460K back in March after a big increase in the first few months of this year. Since then, it has entirely reversed that move with the average value of loans having fallen all the way back down to $406K. That echoes the findings in other recent housing data which has similarly shown declines in home prices.
Higher rates have had an even more significant impact on refinance activity. Following another drop this week, the MBA’s index tracking refinancings has now reached the lowest level since November 2000. Click here to learn more about Bespoke’s premium stock market research service.
