Chart of the Day: Summer Rally Decile Analysis
Initial Claims Back to the Highs
Initial jobless claims came in matching expectations at 260K this week, up from last week’s downward revision of 254K. That reading leaves claims 1K below the pandemic high set two weeks ago. Those levels are above the pre-pandemic range and consistent with where claims stood in the fall of 2017.
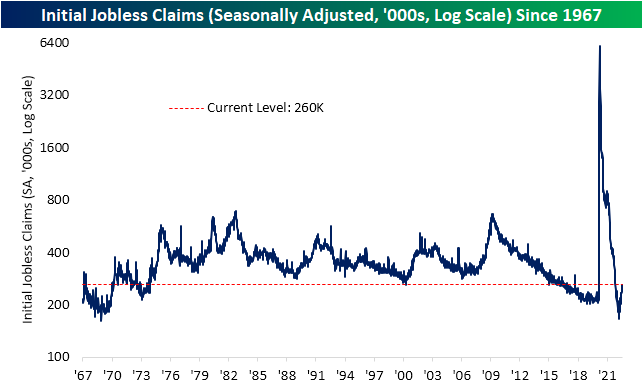
On a non-seasonally adjusted basis, claims have the benefit of seasonal tailwinds at this point of the year as the mid-summer peak works itself out. Given this, unadjusted claims have dropped to 205.6K from the high of 258.9K two weeks ago. Although that is a strong level of claims, it is above the readings from the comparable week of the year in 2018 and 2019.

Continuing claims are lagged an additional week to the initial claims number meaning the most recent reading is as of the week of July 22nd. Although initial claims had fallen that week, continuing claims moved back above 1.4 million for the first time since mid-April. Unlike initial claims, and as we will discuss further in tonight’s Closer, the deterioration in continuing claims has been relatively modest as current levels are not only well below levels from the two years pre-pandemic, but this week’s reading would still make for some of the best readings since 1970. Click here to learn more about Bespoke’s premium stock market research service.

Bespoke’s Morning Lineup – 8/4/22 – Fading into the Open
See what’s driving market performance around the world in today’s Morning Lineup. Bespoke’s Morning Lineup is the best way to start your trading day. Read it now by starting a two-week trial to Bespoke Premium. CLICK HERE to learn more and start your trial.
“Far and away the best prize that life offers is the chance to work hard at work worth doing.” – Theodore Roosevelt

Below is a snippet of content from today’s Morning Lineup for Bespoke Premium members. Start a two-week trial to Bespoke Premium now to access the full report.
Futures were higher earlier but have given up much of their gains as we head into the open. Initial Jobless Claims were just released and came in at 260K which is just 1K shy of a post-COVID high. Continuing Jobless Claims saw a larger increase hitting the highest levels since April. In the UK, the BoE raised rates by 50 bps which was the largest hike since 1995. What’s ironic about the move is that at the same time the central bank raised rates by the most in more than 25 years, it also warned of a long recession.
Today’s Morning Lineup discusses earnings and market news out of Europe and the Americas, rate hikes in Brazil and the UK, a look at LNG markets on news of a sooner-than-expected restart at the Freeport terminal, and much more.
Yesterday was the 58th time in 2022 that the Nasdaq experienced a one-day rally or decline of 2% or more, and it is only August 4th! To put that in perspective, we’re just under 150 trading days into the year, so at the current pace, we’re seeing an average of about two 2%+ daily moves per week! How does that stack up relative to history? Going back to 1971, even if there aren’t any more 2% moves for the rest of the year, 2022 would rank as the 6th highest number of 2% days in a calendar year in the Nasdaq’s history. That’s just four less than the total for 1999, 25 behind the total for 2008, but well more than 40 below the triple-digit totals seen in 2000, 2001, and 2002. The record for the greatest number of 2% days in a calendar year came in 2000 when the 2% threshold was crossed 134 times or more than once every other day.

2022 already ranks as the sixth highest number of 2% days in a calendar year in the Nasdaq’s history, but when we compare the number of 2% days this year through the end of July to the first seven months of all other years, it ranks as the third most. As shown in the chart below, the only two years that had more 2% daily moves YTD through 7/31 than 2022 (57) were 2000 (84) and 2001 (74). Other years that were close were 2002 (54) and 2009 (51).

Start a two-week trial to Bespoke Premium to read today’s full Morning Lineup.
Daily Sector Snapshot — 8/3/22
Chart of the Day: Triple Plays Get More Love
The July Respite
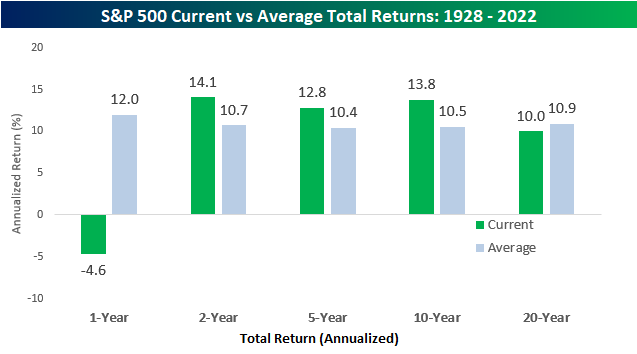
After what had to be one of the worst combined first halves of a year for stocks and bonds on record, July provided a respite as the S&P 500 rallied more than 9% and long-term treasuries, as measured by the BofA/Merrill 10+ Year US Treasury Index, jumped over 3%. Even after those rallies in July, though, trailing 12-month returns for both asset classes remain firmly in negative territory and well below the historical average.
The chart below compares the S&P 500’s annualized total return over the last one, two, five, ten, and twenty years to the historical average for all other periods since 1928. Historically, the S&P 500’s average annual total return has been a gain of 12.0%. With a decline of 4.6% over the last year, the current period ranks in just the 19th percentile relative to all other one-year periods. While one-year returns have been below average, it follows a period of strength for stocks which is evident by the fact that two, five, and ten-year returns are all still at least two full percentage points above their historical averages. Over a 20-year window, however, the S&P 500’s annualized total return of 10.0% is nearly one percentage point below the historical average of 10.9%. The last year has been bad for stocks, but it follows what has been a very good period for investors. Click here to learn more about Bespoke’s premium stock market research service.
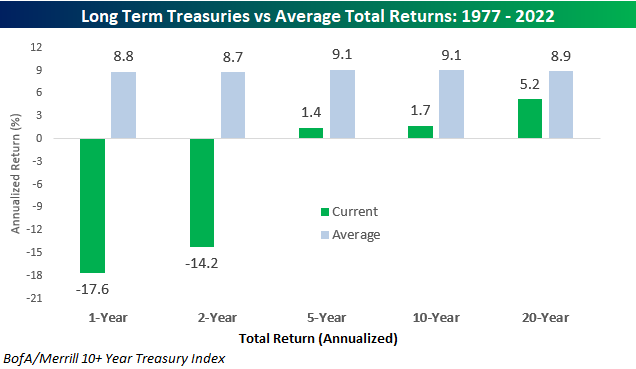
The experience of fixed-income investors has been an entirely different story. While bonds, and US Treasuries specifically, are supposed to be considered a safe asset class, over the last year, long-term US Treasuries are down over 17.5%, and the two-year annualized performance is a decline of 14.2%. Yup, that’s a cumulative decline of 26.4%- in Treasuries! Longer-term, the performance of long-term US Treasuries isn’t negative, but with annualized gains of less than 2% over the last five and ten years and just 5.2% over the last twenty years, calling the recent history of investing in this asset class the dark ages, wouldn’t be an understatement.
Big Moves in Treasuries
It’s the way things always work out in the market. Just when everyone starts to think one thing, the complete opposite occurs. It happened in the US Treasury market yesterday when the yield on the 10-year traded down near 2.5% prompting some sell-side firms to suggest a move to 2% was in the cards. 24 hours later, though, yields have reversed higher, and at just under 2.8%, the 10-year yield is now closer to 3% than 2.5%. After starting out the week with a rally of 2.22%, the iShares 20+ Year US Treasury ETF (TLT) pulled back over 2% Tuesday. You may be used to back-to-back 2% moves in the stock market, but they’re much less common in long-term US Treasuries. Before this week, the last time TLT had 2%+ daily moves on consecutive days was all the way back in March 2020 at the depths of the COVID crash, and since TLT was launched in 2002, there have only been 16 other periods where the ETF had back-to-back moves of 2%. Of those, just six went on for a third day, and only two of those (both in March 2020) went on to more than three days. Click here to learn more about Bespoke’s premium stock market research service.

The red dots in the chart below show every time that TLT had a 2%+ daily move on back-to-back days. Of the prior occurrences, the majority all took place during and in the year or two after the Financial Crisis, but besides that, the only other occurrences were in June 2016 (Brexit) and the COVID crash. We probably don’t need to spell it out, but prior back-to-back 2%+ moves in TLT have occurred during periods of short and/or long-term stress in the markets. Click here to learn more about Bespoke’s premium stock market research service.

It isn’t just individual days where Treasuries have experienced volatility lately. TLT’s average daily move over the last 50 trading days has now moved to above 1% (red line), and since its launch in 2002, the only periods where its average daily move was higher was during the Financial Crisis (Q4 2008 through Q4 2009), after the US debt downgrade (Q3 2011 to Q1 2012) and during the COVID crash (Q1 2020). If you were looking for an August slowdown, Treasuries don’t look like they’re ready to chill.

Bespoke’s Morning Lineup – 8/3/22 – Yields on the Move
See what’s driving market performance around the world in today’s Morning Lineup. Bespoke’s Morning Lineup is the best way to start your trading day. Read it now by starting a two-week trial to Bespoke Premium. CLICK HERE to learn more and start your trial.
“Economics is extremely useful as a form of employment for economists.” – John Kenneth Galbraith
Below is a snippet of content from today’s Morning Lineup for Bespoke Premium members. Start a two-week trial to Bespoke Premium now to access the full report.
Normally on the first Wednesday of the month, we’d be discussing the release of the ADP Private Payrolls, but that report is still on the DL as economists work on revising its methodology to make it a more accurate gauge of payroll trends in the economy. The only reports on the calendar today are Durable Goods, Factory Orders, and the ISM Services report which will all be released at 10 AM Eastern. It’s been another busy day for earnings, and the results continue to surprise to the upside with EPS and revenue beat rates that are higher than most analysts and strategists would have expected heading into earnings season.
Equity futures are higher this morning, oil is higher as OPEC+ only agreed to a small increase in daily output, and Treasury yields are continuing their steep run higher which began yesterday morning at right around this time. After trading well below 2.6% yesterday, the yield on the 10-year is now pushing 2.8%.
Today’s Morning Lineup discusses earnings and market news out of Europe and the Americas, Pelosi’s visit to Taiwan, a detailed look at PMI and economic data from around the world, and much more.
As oil prices have pulled back in the last couple of months, stocks in the Energy sector have also experienced a hiccup as growth-oriented names have enjoyed some time in the sun. Technology is one sector that has experienced a rebound, and that bounce has shown up in the chart of Energy’s relative strength versus the Technology sector. From the summer of 2020 through late last year, there was a push and pull with lots of noise between the two sectors, but neither one had anything to show for it as they essentially performed in line with each other during that entire period. Beginning in late 2021, though, when the Fed apparently got religion with respect to surging inflation, tech stocks plunged while energy names surged. That run essentially continued uninterrupted right up to mid-June. In the span of under two months, though, Energy has given up 40% of its outperformance versus Technology. Easy come easy go.

Given its outperformance in the years coming out of the Financial Crisis, there’s almost a Pavlovian instinct for investors to look towards the technology sector for outperformance. Over the last two years, though, the sector has essentially generated zero alpha. Comparing the sector’s relative strength to the S&P 500, Technology is barely positive versus August 2020.

Start a two-week trial to Bespoke Premium to read today’s full Morning Lineup.