Bespoke’s Morning Lineup – 8/30/22 – Lack of Imagination
See what’s driving market performance around the world in today’s Morning Lineup. Bespoke’s Morning Lineup is the best way to start your trading day. Read it now by starting a two-week trial to Bespoke Premium. CLICK HERE to learn more and start your trial.
“Logic will get you from A to Z; imagination will get you everywhere.” – Albert Einstein

Below is a snippet of content from today’s Morning Lineup for Bespoke Premium members. Start a two-week trial to Bespoke Premium now to access the full report.
After two days of losses, futures have made an attempt to rally today, but as the opening bell approaches, the rally has lost some steam. Treasury yields are still lower on the day as the 10-year yield remains below 3.10%, while crude oil is down over 2%. On the economic calendar this morning, we’ll be getting house price levels from the FHFA (for June) at 9 AM Eastern and then Consumer Confidence and JOLTS at 10 AM.
It seems these days that the market is solely focused on the Fed, but at the individual stock level, it’s Bed Bath & Beyond (BBBY) and everyone else. Over the last 12 trading days, shares of BBBY have either been the best or worst-performing stock in the S&P 1500 on nine different trading days. Not only that, but on one of the three trading days where it wasn’t the best or worst performing stock in the S&P 1500, it was the 2nd worst on one of those days and in the bottom ten on the other two. There are literally hundreds of stocks in the S&P 1500 that will go months or years without cracking the top ten best or worst daily performers list, but for some reason, BBBY has been making it an everyday occurrence lately. Maybe instead of the S&P 1500, we should call it the S&P Bed Bath & Beyond! It’s often tempting for investors to go where the ‘action’ is, but no one ever gets rich following the crowd. Use your imagination. It will take you places.

Our Morning Lineup keeps readers on top of earnings data, economic news, global headlines, and market internals. We’re biased (of course!), but we think it’s the best and most helpful pre-market report in existence!
Start a two-week trial to Bespoke Premium to read today’s full Morning Lineup.
Daily Sector Snapshot — 8/29/22
Google Searches Show Consumers Still Getting Out and About
More than two years ago during the summer of 2020, we used Google search trend data to build a US consumer activity index to gauge the strength of the re-opening of society after COVID lockdowns. The index is an aggregation of Google search trend activity for various terms like hotel, cruises, flights, bars, and restaurants, to name a few. When we first started looking at trends in searches for activities that get people out of the house and doing things again, we were trying to see how long it would take to get back to pre-COVID levels. As shown in the chart of the index below, it took until the summer of 2021 to get back to pre-COVID levels, but then activity receded again as we went into the fall last year as Omicron began to spread rapidly.
This summer we saw our Google Trend consumer activity index surge past 2021 highs as people have really started to go out and travel again. Recently, however, we’ve seen a dip in activity. As shown, this appears to be seasonal as we saw the same thing happen last year at this time. Even still, the activity index remains above the level it was at prior to the first COVID cases on US soil, so it’s hard to argue that the consumer has pulled back much — if any — this year, even with inflation raging and some economic indicators flashing recession warnings signs. Click here to learn more about Bespoke’s premium stock market research service.
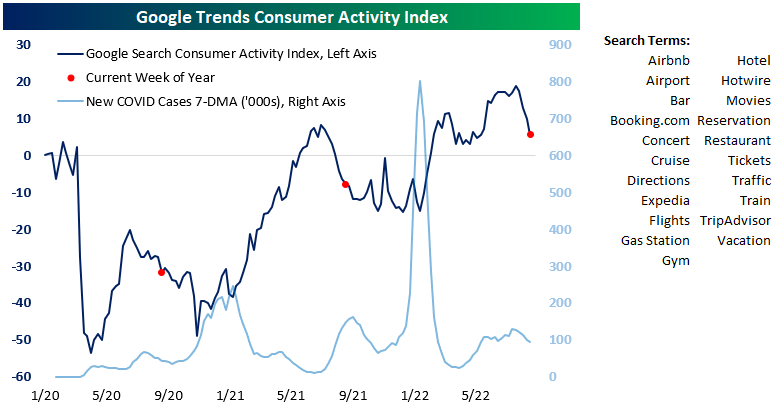
Chart of the Day – Prices Paid Losing Momentum
Testing of the 50-DMA
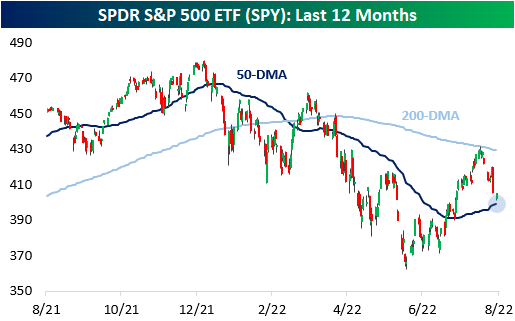
After Friday’s 3%+ sell-off, the major US indices have been bouncing around in Monday’s session as investors weigh Powell’s hawkish comments. With this sell-off comes a test of the 50-DMA, which the major indices broke above in mid-July. For those who follow technicals, this is a critical level where bulls want to see support and bears want to see price break definitively below. On the bright side, most major indices are holding up, at least for now.
Starting with the S&P 500 (SPY), the ETF is currently trading just 1.4% above the 50-DMA just two weeks after testing the 200-DMA on the upside. SPY didn’t quite touch the 50-DMA in Monday’s trading but came close enough to make the occurrence notable, and as of now is more range-bound between these moving averages than anything else. Click here to start a two-week trial to Bespoke Premium and receive our paid content in real-time.
The Nasdaq 100 ETF (QQQ), on the other hand, did test the 50-DMA in Monday’s session. It found support at this level and is now trading 64 basis points above it. QQQ has a very similar technical setup to SPY, as both have been range-bound by the 200 and 50-DMAs. QQQ currently has the widest spread between the 200 and 50-DMAs of the major US index ETFs due to higher volatility.

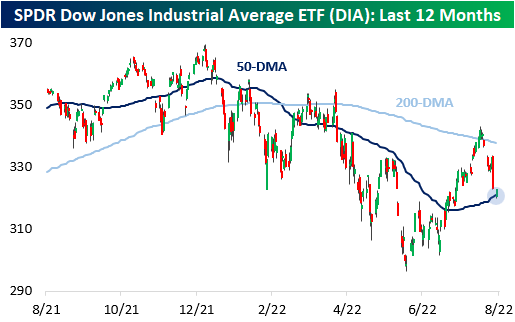
The Dow Jones Industrial Average ETF (DIA) did cross below the 50-DMA Monday, trading 35 basis points below the level at its intraday lows. Unlike SPY and QQQ, DIA never fully tested the 50-DMA in late July and was able to break the 200-DMA in mid-August. Unfortunately for bulls, the brief stint above the 200-DMA did not last. DIA also has the narrowest spread between the 200 and 50-DMAs at 5.2% due to lesser volatility. Click here to start a two-week trial to Bespoke Premium and receive our paid content in real-time.
Interestingly, the small-cap Russell 2000 ETF (IWM) is relatively distanced from the 50-DMA, trading 3.1% above this level as of this writing. This is more than twice the distance than the next closest major index ETF (SPY: 1.4%). Although this may imply that IWM has further downside before finding support, the index is actually outperforming QQQ on the day. However, IWM is having a worse day than both SPY and DIA. The technical setup on IWM is quite similar to DIA.

Long-story short, investors should watch how the major indices trade around their respective 50-DMAs. Further recovery tomorrow would imply support around the 50-DMA, which would be bullish in the near-term. If we see this support tomorrow, we would not be surprised to see the major indices retest the 200-DMA, but the potential results of that test is a topic for another day. Click here to start a two-week trial to Bespoke Premium and receive our paid content in real-time.
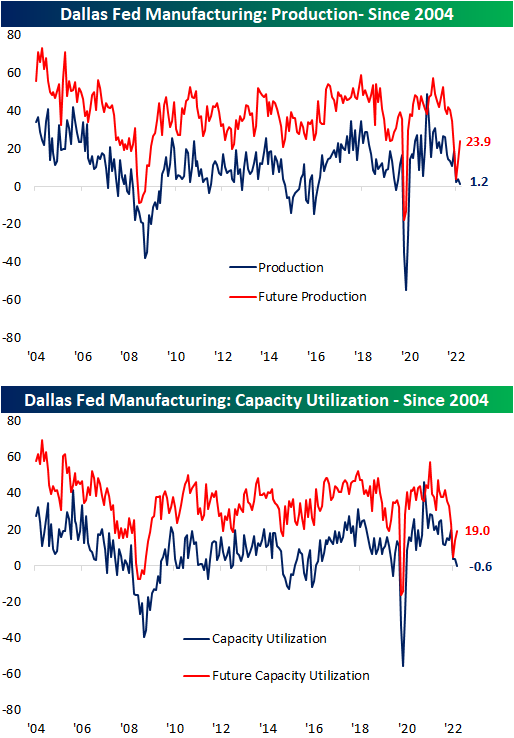
Texas Manufacturing Comes Back
The Dallas Fed updated the final of the regional Fed manufacturing indices this morning. Business Activity remains in contraction but improved versus July. The headline index came in at -12.9, slightly worse than expectations of a reading of -12.7. Expectations saw a similar move with a large bounce off of the worst levels of the post-pandemic period.

Although the headline reading was higher, breadth was disappointing with only five other categories rising month over month. With broad declines across other categories, three indices—Unfilled Orders, Capacity Utilization, and Delivery Times—fell from expansion and into contraction. As has been the case with other regional Fed indices, expectations are generally far more pessimistic with ten of the sixteen indices in the bottom decile of their historical ranges and two others only half of one percentage point away. For comparison, there is not a single current conditions index at that low of a reading.

As demand has pulled back with New Orders seeing the third straight monthly contractionary reading, Production and Capacity Utilization are two of the most depressed indices of the report. These indices are in the 18th and 17th percentiles of their historical ranges, respectively. After this month’s declines, those two indices have reached the lowest levels since May 2020. In other words, consistently weak demand in recent months has resulted in production to go little changed. Ironically, the region’s firms reported much healthier expectations with significant increases in those indices. For Production, the 10.3 point month-over-month increase ranks in the top 7% of all monthly readings.
Likely another result of weakened demand, both Prices Paid and Received have continued their sharp declines across both current conditions and expectations. Prices Paid fell for the third month in a row and is now at the lowest level since October 2020 whereas Prices Received has fallen five months in a row and is down to the lowest level since February 2021. Not only are firms seeing a deceleration in price increases, but Delivery Times actually fell into contraction for the first time since June 2020. Paired with that, Inventories are also signaling improvements in supply chains as this month marked the fourth consecutive expansionary reading; the longest such streak since a six-month streak ending in January 2019. Expectations, however, are now calling for that dynamic to remain for much longer as the drop to -9.7 is the lowest reading since April 2020. Click here to learn more about Bespoke’s premium stock market research service.

Bespoke Morning Lineup – 8/29/22 – No Doldrums Here
See what’s driving market performance around the world in today’s Morning Lineup. Bespoke’s Morning Lineup is the best way to start your trading day. Read it now by starting a two-week trial to Bespoke Premium. CLICK HERE to learn more and start your trial.
“The greatest education in the world is watching the masters at work.” – Michael Jackson
Below is a snippet of content from today’s Morning Lineup for Bespoke Premium members. Start a two-week trial to Bespoke Premium now to access the full report.
If you planned on a quiet week of trading ahead of the unofficial last week of summer, you might want to adjust your plans. After plunging Friday, the only ones seemingly on vacation this morning are the dip buyers. Equity futures are down nearly 1% while US Treasury yields are moving higher. The 10-year yield has moved back above 3.1% which is still below the highs from June, but the 2-year yield briefly took out those June highs, so the upward direction in rates has resumed following Powell’s hawkish speech on Friday. The economic calendar is quiet today with the Dallas Fed Manufacturing report coming out at 10:30 Eastern. Economists are expecting a negative print but an improvement from July’s level of 22.6.
In many ways, last week was a normal one for the stock market- at least in terms of 2022 performance. To put it succinctly, Energy was up and everything else stunk. As shown in the graphic below from our Trend Analyzer, Energy was up over 4% taking its YTD gain back above 50%, while every other sector fell at least 1% and, in most cases, much more than that. Leading the way to the downside, Technology, Consumer Discretionary, Communications Services, and Health Care all fell more than 4%.
Despite the sharp declines last week, most sectors remain above their 50-day moving averages (DMA) with the only two exceptions being Communications Services and Health Care. It remains to be seen whether last week was a pause in the sharp rally off the June lows or a resumption of the bear market, but if the majority of sectors can stay above their 50-DMAs, the bulls still have some hope to cling to.

Our Morning Lineup keeps readers on top of earnings data, economic news, global headlines, and market internals. We’re biased (of course!), but we think it’s the best and most helpful pre-market report in existence!
Start a two-week trial to Bespoke Premium to read today’s full Morning Lineup.
Bespoke Brunch Reads: 8/28/22
Welcome to Bespoke Brunch Reads — a linkfest of the favorite things we read over the past week. The links are mostly market related, but there are some other interesting subjects covered as well. We hope you enjoy the food for thought as a supplement to the research we provide you during the week.
While you’re here, join Bespoke Premium with a 30-day free trial!
Utilities
America’s trash flow isn’t signaling a recession, CEO explains by Luke Carberry Mogan (Yahoo! Finance)
The CEO of a large trash hauler is reporting very strong demand from consumers, industrial customers, and commercial customers. Typically trash production leads or is at least coincident with weaker economic data that comes with a recession. [Link; auto-playing video]
A ‘Tsunami of Shutoffs’: 20 Million US Homes Are Behind on Energy Bills by Will Wage and Mark Chediak (Bloomberg)
Roughly one in six homes has fallen behind on utility bills, with unpaid utility balances rising through the pandemic and continuing to move upwards this summer. [Link; soft paywall]
National Defense
The Family That Mined the Pentagon’s Data for Profit by Mark Harris (Wired)
How to build a family business based on national secrets? Step one is an aggressive use of the Freedom of Information Act to fill your inventories. [Link; soft paywall]
How China Could Choke Taiwan by Chris Buckley, Pablo Robles, Marco Hernandez and Amy Chang Chien (NYT)
A detailed analysis of how the geography of Taiwan leaves it vulnerable to blockade by China…should China take that step as part of an effort to bring the island back under its control. [Link; soft paywall]
EVs
The Only Electric Car Worth Buying Right Now Is Used by Kyle Stock (Bloomberg)
As the EV supply chain ramps up, high prices and lack of availability may mean the best way to get your hands on a battery-powered car is via the used market. [Link; soft paywall]
California Approves Rules to Ban Gasoline-Powered Cars by 2035 by Mike Colias and Christine Mai-Duc (WSJ)
Wit the support of automakers, California’s Air Resources Board will phase out internal combustion engines over the next decade and a half as the nation’s largest auto market does away with engines. [Link; paywall]
Food At Scale
The Mysterious, Stubborn Appeal of Mass-Produced Fried Chicken by Adam Clair (Vice)
An investigation into the mysteries of industrially manufactured fried chicken and why it beats more artisanal approaches to deep fried bird. [Link]
There’s a Carbon Dioxide Shortage, and Food and Drink Makers are Scrambling by Jesse Newman (WSJ)
Carbon dioxide is a byproduct of ethanol and fertilizer manufacturing, which have both been disrupted by supply chain issues. The result has been a scramble for supplies across the food and beverage industry. [Link; paywall]
Real Estate
The Sellers Strike and Housing Inventory by Bill McBride (Calculated Risk)
The flow of new listings on to the market is slowing as potential sellers decide to hold supply back from housing markets where inventories have soared amidst weak demand; it remains to be seen how long the “seller’s strike” can continue. [Link]
Home Sellers Are Slashing Prices in Pandemic Boomtowns by Paulina Cachero (Bloomberg)
Almost three-quarters of homes on sales in Boise had price cuts in July as the soaring prices of the pandemic era Zoom town boom start to roll over and even reverse. [Link; soft paywall, auto-playing video]
Great White North
The best places to live in North America (The Economist)
A ranking of major cities across 30 different metrics for education, culture, the environment, health care, infrastructure, and stability suggests Canadian cities are the most livable in North America. [Link]
Hurricane Season
Hurricane season on the verge of rarely seen August without a named storm by Chris Perkins (South Florida Sun Sentinel/ArcaMax)
Hurricane season is off to a slow start; it’s on track to be only the third August since 1961 without a named hurricane in the Atlantic. [Link]
Read Bespoke’s most actionable market research by joining Bespoke Premium today! Get started here.
Have a great weekend!
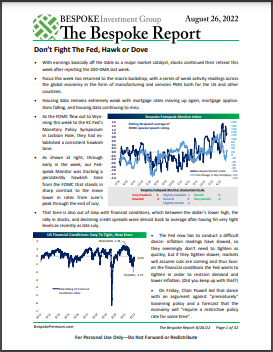
The Bespoke Report – 8/26/22 – Don’t Fight The Fed, Hawk or Dove
This week’s Bespoke Report newsletter is now available for members.
The Federal Reserve is trying to engineer tighter financial conditions, and investors that don’t heed the commitment to avoiding an early pivot laid down by Chair Powell today will be on the wrong side of the aggressive Fed. We talk about the hawkish tilt in Fed speakers, underperformance of both stocks and bonds this year, commodity markets and how they impact the dollar, euro parity, stock exposure to the buck, European power markets, technical readings from major equity markets around the world, recent sentiment analysis, a full recap of US economic data released this week as well as global indicators, analysis of the rapidly shifting political backdrop ahead of US midterms, and much more in this week’s Bespoke Report.
To read this week’s full Bespoke Report newsletter and access everything else Bespoke’s research platform has to offer, start a two-week trial to one of our three membership levels.