Brazil and Russia Go In Opposite Directions
Earlier today, we updated our Global Macro Dashboard highlighting major economic data points of 22 major global economies. In the table below, we show the ETFs tracking the stock markets of those same countries and their performance YTD, since their 52-week high, and where that leaves them within their trading ranges (standard deviations from the 50-DMA).
With only four ETFs up in a meaningful way year to date, heavy selling has not just been isolated to the US. Brazil (EWZ) has bucked the trend, though, rallying 10.33%. Despite the strong start to the year, EWZ is still one of the ETFs down the most from its 52-week high. The huge rally this month leaves EWZ deeply overbought alongside South Africa (EZA). While there are only two overbought countries, nearly half of the list is oversold. South Korea is the most oversold of these, but it has not experienced the largest decline this year. Russia (RSX) takes that crown as RSX has fallen 16.65% YTD as geopolitical tensions with Ukraine arise and the threat of sanctions weighs on that market

As previously mentioned, two of the biggest movers are the first half of the BRIC countries. While the decline for RSX recently has been severe, it is a leg lower in a longer-term downtrend that has been in place since the fall. Brazil, meanwhile, has been in a downtrend since last spring, but the recent surge has resulted in it definitively breaking that trend. China’s (MCHI) downtrend is approaching a year in length, but there has not been much in the way of technical improvements. The same can also be said for India (INDA) which has failed to reclaim its 50-DMA.
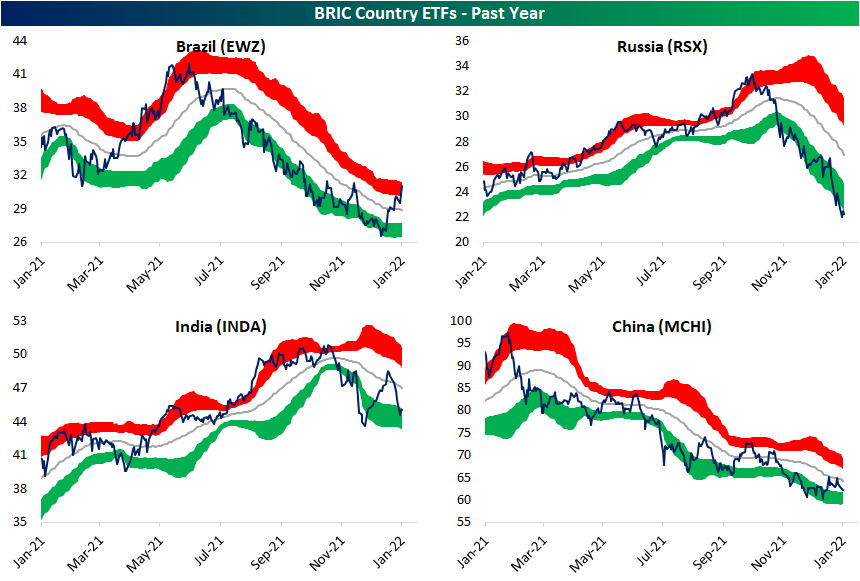
While no other BRIC country ETF has broken out of its downtrend, Hong Kong (EWH) and South Africa (EZA) have both been stronger. That being said, EWH has begun to reverse lower after reaching overbought territory, and EZA failed to take out resistance at the fall highs and has since been consolidating. Click here to view Bespoke’s premium membership options.


Mortgage Rates Surge, Refis Slump
The recent rise in rates has lifted the national average for a 30-year fixed-rate mortgage to 3.68% which is nearly a half percentage point higher than it was just one month ago. That is also the highest rate since April 2020.

Such a large jump in rates in only a month’s span is not totally without historical precedent, but it is on the large side of monthly moves. Going back to 1998, the current one-month change in rates stands in the top 2% of all periods. It is also the largest jump since March 2020.

Weekly data from the Mortgage Bankers Association released this morning has reflected that rise in rates. Mortgage applications fell over 7% WoW on a seasonally adjusted basis. Refinance applications experienced a sharper 12.6% WoW decline as the index hit the lowest level since the first week of 2020 bringing the total decline over the past month up to 17.5%. While applications are falling somewhat dramatically, current levels are now only slightly above the historical average.

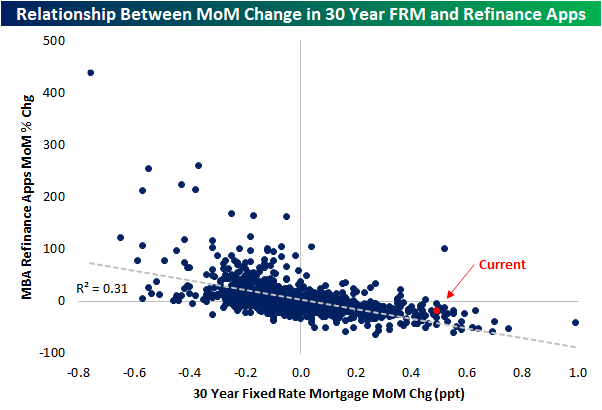
The moves in refinance applications relative to mortgage rates are consistent with what could be reasoned. As the price to (re)finance a home rises, there will be fewer applications, and the data is consistent with that line of thought. In the chart below, we show the relationship between the MoM changes in mortgage rates and refinance applications. Typically as rates rise, mortgage apps fall and vice versa. The most recent week’s data sits toward a more extreme end of things though the drop in refinance applications is not as large as might have been expected.
Pivoting over to related stocks, the iShares Home Construction ETF (ITB) is up half of one percent today, albeit having come off of the morning’s highs on the weaker than expected MBA numbers and stronger than expected new home sales figures. The bounce over the past few days brings ITB back up toward its 200-DMA which acted as support back in the early fall. Overall, ITB’s pandemic uptrend is also still more or less in place.
Meanwhile, mortgage REITs (which is a more direct play on MBA data) proxied by the iShares Mortgage Real Estate ETF (REM) have gotten hit harder recently with a more defined downtrend since the late fall. While it too is bouncing in the past few sessions with a 1.6% gain today, the technical damage has been more severe than the homebuilders.Click here to view Bespoke’s premium membership options.


Chart of the Day: Gaps Higher After Recent Market Weakness
Bespoke’s Morning Lineup – 1/26/22 – All Eyes on the Fed
See what’s driving market performance around the world in today’s Morning Lineup. Bespoke’s Morning Lineup is the best way to start your trading day. Read it now by starting a two-week trial to Bespoke Premium. CLICK HERE to learn more and start your trial.
“The path to innovation begins with curiosity.” – Robert Iger
It’s not often that one of the top stories on the lead into a mainstream show like “The Today Show” is a Fed Meeting (don’t ask us how we know), but that was the case this morning as market volatility has made its way into the mainstream zeitgeist. Futures are sharply higher this morning with S&P 500 futures trading up 1.5% and the Nasdaq up by over 2%. After dropping sharply immediately after it reported results last night, shares of Microsoft (MSFT) reversed course and are now up over 5%.
The economic calendar is light today with Wholesale Inventories at 8:30 and New Home Sales at 10 AM, but the Fed will take center stage this afternoon with its 2 PM announcement and 2:30 Powell presser.
Read today’s Morning Lineup for a recap of all the major market news and events from around the world, including the latest US and international COVID trends.
It’s been a volatile start to 2022 so far as the Nasdaq is currently on the pace for its 11th 1%+ daily move in 17 trading days so far this month. At a rate of just under 65%, this would rank as the most volatile month for the S&P 500 since March 2021 but is nowhere near the levels of volatility that were experienced during the COVID crash. While this month hasn’t been nearly as volatile as early 2020, looking back all the way to the start of 2010, there have only been a handful of other months where the percentage of daily 1% moves for the Nasdaq in a given month was higher.

Looking further back, though, investors have been relatively spoiled by the lack of volatility. During the Financial Crisis and before that, leading up to the peak of the dot-com bubble, the Nasdaq routinely experienced 1% daily moves during many months.

Start a two-week trial to Bespoke Premium to read today’s full Morning Lineup.
Daily Sector Snapshot — 1/25/22
Bespoke Stock Scores — 1/25/22
B.I.G. Tips – Extreme Drawdowns
Another Regional Fed Index Declines
The latest regional manufacturing index out of the Richmond Fed was released today covering the month of January. Whereas the Empire Fed reading plummeted and the Philly Fed bounced, the Richmond Fed’s index more went the way of the former. The index was cut in half falling 8 points to a level of 8. The current level continues to indicate expansionary activity but at a slower rate.

Breadth was weak in the report with most categories falling month over month across both current conditions and expectations. A handful of these were historically large declines too. For example, the decline in the Service Expenditure expectations index was the largest on record. Whereas last month many categories saw readings in the upper few percentiles of their historical ranges, this month most were more middling. But there are some exceptions as prices, vendor lead times, and wages all remain at or close to record highs.
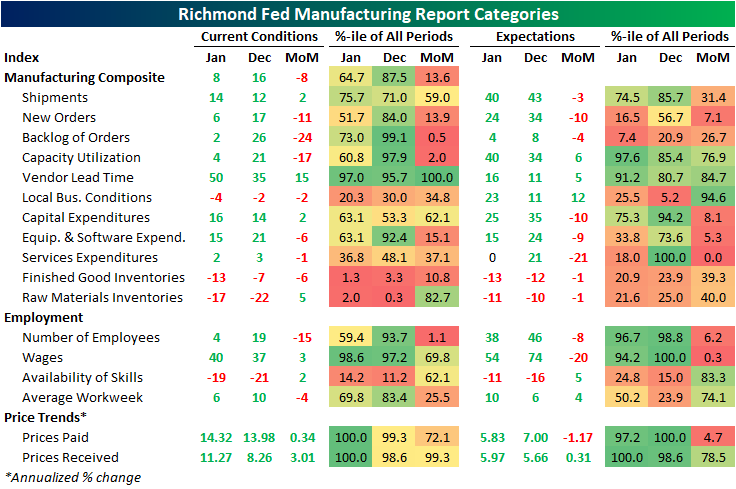
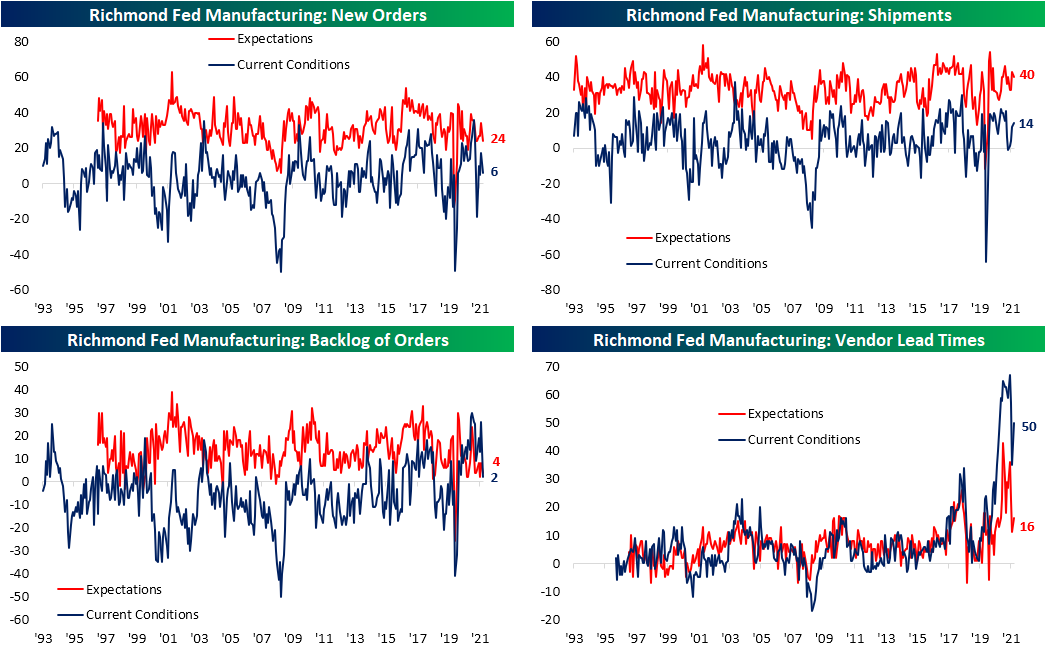
Growth in new orders slowed significantly. The 11 point drop ranks in the 13th percentile of all monthly changes. The drop in backlogs was much more dramatic, though, with its 24 point decline ranking as the third-largest on record. Even though shipments accelerated, so too did vendor lead times with a record 15 point MoM increase. While there was that sharp increase, the index remains below the levels it sat at for most of last year.
Another area to experience a sharp decline in January was the index for the number of employees. The 15 point decline ranks as the sixth-largest on record indicating a rapid deceleration in hiring. The average workweek also declined meaning existing employees worked fewer hours. The index tracking the availability of skills continued to recover off of historic lows, but the current levels still point to a large talent gap. Wages also saw a minor bump this month, but expectations fell sharply with the month-over-month decline tied for the second-largest drop on record.

Not only were prices for labor higher but so too were prices paid and received. Both indices set new record highs well above any reading observed prior to the pandemic. Expectations moved in opposite directions though. Expectations for prices paid fell to a 5.83% annualized rate while expectations for prices received rose to a record high of 5.9%. Click here to view Bespoke’s premium membership options.

Chart of the Day – Big Declines Leading Up to the FOMC
Semis Slide Below 200-Day
Breadth has been all-around bad recently. For example, as we highlighted in our Sector Snapshot, the 10-day advance-decline lines for the S&P 500 and the Tech sector are hovering close to the lowest levels since March 2020. We’re about as oversold as it gets from a short-term trading perspective. The semis are starting to break down too. Today, assuming it keeps up the pace of declines, the Philly SOX index is looking to close below its 200-DMA for the first time since the spring of 2020 as the uptrend off the COVID lows is on the ropes.

It has been well over a year since the Philadelphia Semiconductor index, or the SOX, has last closed below its 200-DMA. Assuming no historic jaw-dropping afternoon rally the likes of which haven’t been seen since…yesterday, the group is looking to end a 435 trading day streak of closes above its 200-DMA. Going back through the history of the index beginning in the mid-1990s, there have only been three streaks that have gone on for longer.

While it is not a particularly large sample size, given its reputation as a leading sector, we wanted to highlight the performance of the semis and the broad market after long streaks above the 200-DMA for semis come to an end. The only outright consistently negative performance in the following weeks and months was in 2000 during the dot com bust following the end of the streak in August 2000. Overall, median performance one week and one month later has been far stronger than the norm for the semis, Tech, and S&P 500. Going further out, things are more mixed relative to each index’s respective norm. For example, the semis are typically worse than normal 3 and 6 months out but have a larger than normal median performance one year out. Technology and the S&P 500 more broadly, meanwhile, have seen worse than normal performance 6 and 12 months out and inline performance 3 months later.
