Claims Peak Early
Jobless claims were anticipated to reverse much of last week’s improvement as forecasts were calling for initial claims to rise from 205K to 214K. Instead, there was a sub-200K print as claims fell to the lowest level since the end of September.
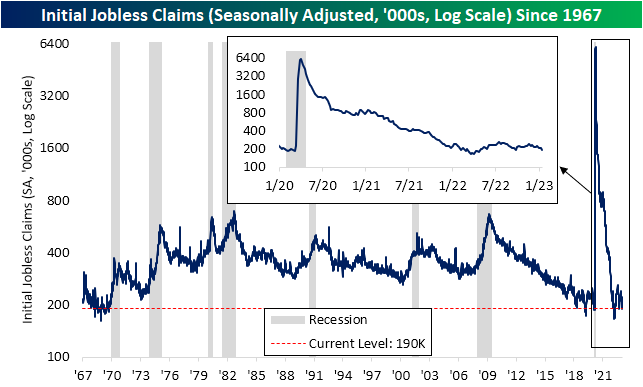
Before seasonal adjustments, claims fell to 285.58K from a seasonal peak of 339.16K last week. As shown below, a decline in the second week of the year is not unheard of but is not exactly the norm either. In most years, the second week of the year has marked the annual high for claims as the week has historically seen a week-over-week increase in claims 85% of the time. 2017 and 2018 are the two other most recent examples of claims peaking in the first rather than the second week of the year.
All that is to say, the week-over-week drop in the seasonally adjusted number per today’s print is perhaps a bit overstated. The end and start of the year tend to be volatile for seasonality thus the weeks ahead will help to provide a clearer picture of where claims really stand.

Turning over to continuing claims, the first week of the year saw claims rise by 17K up to 1.647 million. That is still below higher levels observed throughout late November and December as the deterioration in claims over the past month has subsided. Click here to learn more about Bespoke’s premium stock market research service.

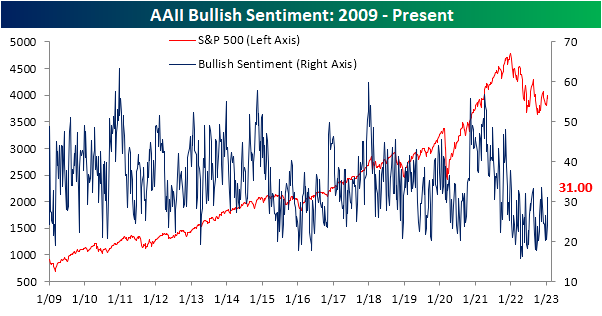
Bulls and Bears Almost Evenly Split
As we noted in last night’s Closer, the S&P 500 has seen a bit of technical damage done in the past few sessions. In spite of the turn lower, sentiment readings have improved. For the AAII sentiment survey, bullish sentiment has risen up to 31%. That 7 percentage point jump makes for the largest week-over-week increase and the highest reading since the week of November 17th.
Bearish sentiment plummeted to 33.1% of respondents which is down sharply from just a month ago when more than half of those responding reported as pessimists. The four straight weeks of declines is now the longest such streak since August leaving bearish sentiment only 0.2 percentage points above the second half of 2022’s low reached in the first week of November.
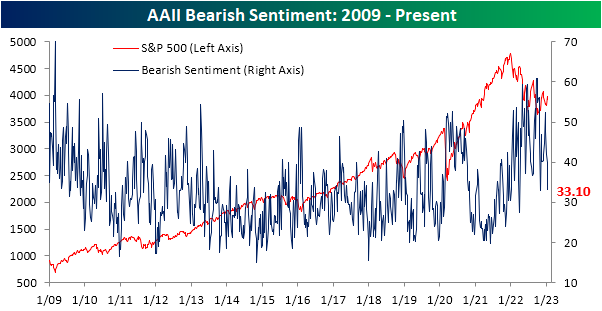
As a result of the big moves, the bull-bear spread has narrowed all the way to -2.1. As we have frequently noted over the past few months, we are currently on a record streak of 42 weeks in a row with a negative bull-bear spread. This week’s reading is now the narrowest reading in the spread during that streak.

Taking into account other sentiment surveys, this week’s readings also showed a healthy improvement in sentiment, putting a record streak on the ropes. Below, we show our sentiment composite combining the AAII bull-bear spread with that same spread from the Investors Intelligence survey as well as the NAAIM Exposure index. At the moment, sentiment is only slightly more bearish than the historical norm with the composite at -0.14. While that does extend the streak of negative readings to 54 weeks in a row (tying an identically long streak that ended in June 2009), it is one of the least pessimistic readings of the current streak. In other words, across surveys sentiment may not have turned bullish, but it appears to be much less bearish than at other points in the past year. Click here to learn more about Bespoke’s premium stock market research service.

Bespoke’s Morning Lineup — Early Misses — 1/19/23
See what’s driving market performance around the world in today’s Morning Lineup. Bespoke’s Morning Lineup is the best way to start your trading day. Read it now by starting a two-week trial to Bespoke Premium. CLICK HERE to learn more and start your trial.
“Be brutally honest about the short term and optimistic and confident about the long term.” – Reed Hastings

Below is a snippet of content from today’s Morning Lineup for Bespoke Premium members. Start a two-week trial to Bespoke Premium now to access the full report.
We continue to follow closely an emerging trend of “misses” when it comes to companies that have reported earnings so far this season.
In the year leading up to the current earnings season that began last week, our Earnings Explorer shows 8,424 individual quarterly earnings reports. Of those 8,424 reports, 67% reported EPS that were better than consensus analyst expectations, while 70% reported sales that were better than expected. So far this season, which began last Monday, we’ve seen just 40% of companies beat consensus EPS estimates and just 34% beat consensus sales expectations.
It’s still very early in the reporting period, but so far it looks like analysts — who were already cutting estimates at a rapid pace leading up to this earnings season — may not have cut forecasts enough.
By the end of next week when another 200+ companies will have reported, we’ll have a much firmer look at where beat rates stand this season. Below is a look at the rolling 3-month average of beat rates for both EPS and sales throughout the history of our Earnings Explorer.
After COVID hit, beat rates initially skyrocketed as analysts became overly pessimistic, but we’ve seen downside mean reversion in beat rates for the last 18 months or so. Based on early trends, we could see a return down to the long-term average this quarter, or even a move below average. Over the last 22 years going back to 2001, 59.4% of stocks reporting have beaten EPS estimates, while 56.45% have beaten revenue estimates. As mentioned earlier, we’ve seen a 40% beat rate for EPS so far this season and a 34% beat rate for revenues. We’d note that the only time we saw EPS beat rates fall to the low 50s over a three-month period was in Q1 2009 near the depths of the Financial Crisis lows.

Continue reading today’s Morning Lineup with a new Bespoke Premium trial.
Our Morning Lineup keeps readers on top of earnings data, economic news, global headlines, and market internals. We’re biased (of course!), but we think it’s the best and most helpful pre-market report in existence!
Start a two-week trial to Bespoke Premium to read today’s full Morning Lineup.
Daily Sector Snapshot — 1/18/23
Bespoke Baskets Update — January 2023
Is the Surge in Purchases and Refis Believable?
Early this morning, the weekly release of mortgage purchases and refinance applications from the Mortgage Bankers Association posted outright impressive week-over-week increases for both metrics. Beginning with a look at purchases, the reading surged almost 25% week over week for the highest reading in the index since 9/23. Even though that was a massive move higher, the purchases index remains at the low end of the past several year’s range and would be only slightly better than those readings observed in the spring of 2020.
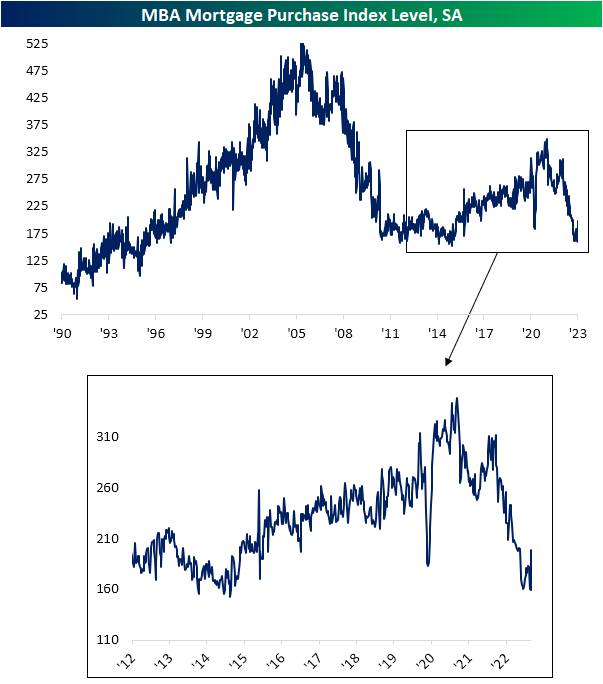
Refinance applications have been at some of the lowest levels in more than 20 years, and that continues to be the case even after rising well over 30% versus last week. Similar to purchases, that massive increase only brings refis back up to levels last seen in September.
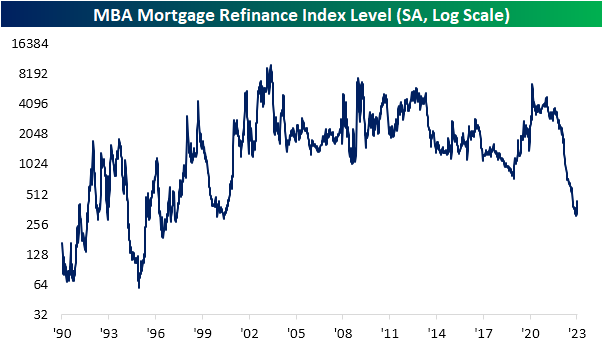
While a portion of those large improvements could potentially be the result of mortgage rates dropping to some of the lowest levels in the past few months, seasonality appears to be another and more plausible factor. Likely as a result of backlogs built up during the holidays, the second week of the year has plenty of precedent for outlier-like jumps in applications. As shown below, multiple times since the early 1990s the second week of the year has seen mortgage and refinance applications rise by at least 20% and 30% week over week, respectively. In other words, even if the surge in mortgage applications is eye-catching, we would caution against jumping to the conclusion that these increases are material without further follow-through in the weeks to come. Click here to learn more about Bespoke’s premium stock market research service.
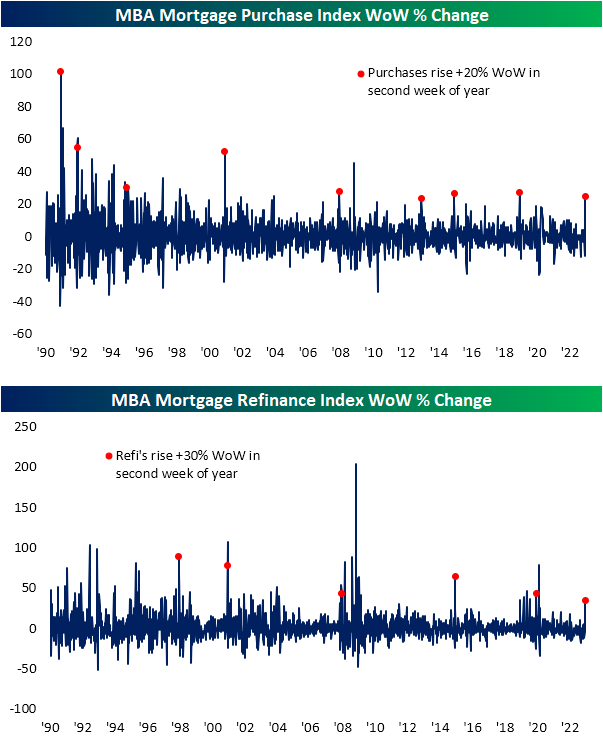
Chart of the Day – Sectors With High Levels of Negative Revisions
B.I.G. Tips – Charts We’re Watching
Bespoke Morning Lineup — 1/18/23
See what’s driving market performance around the world in today’s Morning Lineup. Bespoke’s Morning Lineup is the best way to start your trading day. Read it now by starting a two-week trial to Bespoke Premium. CLICK HERE to learn more and start your trial.
“It seems like people don’t learn from the past.” – Thomas Peterffy
Below is a snippet of content from today’s Morning Lineup for Bespoke Premium members. Start a two-week trial to Bespoke Premium now to access the full report.
Earnings so far this week have been pretty negative, with 10 of the 16 stocks that have reported missing EPS estimates. We won’t get a good read on things until next week when the pace of reports picks up dramatically, but it’s not common to see more EPS misses than beats.

As we highlighted in last night’s Closer, the iShares Europe ETF (IEV) has outperformed the S&P 500 (SPY) over the last three months by the widest margin on record since IEV began trading in 2000. European equities are trading slightly higher once again this morning along with US futures.

As shown below, the charts for European and other international index ETFs now look drastically different than those of the S&P (SPY) and the Nasdaq 100 (QQQ). While SPY and QQQ have yet to break out of long-term downtrends, Europe (IEV, FEZ), emerging markets (EEM), and the all world ex-US ETF (CWI) have formed new uptrends as they break out to six-month highs.

Continue reading today’s Morning Lineup with a new Bespoke Premium trial.
Our Morning Lineup keeps readers on top of earnings data, economic news, global headlines, and market internals. We’re biased (of course!), but we think it’s the best and most helpful pre-market report in existence!
Start a two-week trial to Bespoke Premium to read today’s full Morning Lineup.