ETF Trends: US Sectors & Groups – 10/20/16
In something of a flip, natural gas has been down the most over the past week and junior gold miners have been up the most – a reversal of what was true for several weeks. South Africa, the Philippines, and Brazil have all continued to rally while biotechs have lead the charge lower. Other US sector or group exposures have also continued to underperform and almost half of the 52 ETFs in our Sectors & Groups category are in downtrends as of today.

Bespoke provides Bespoke Premium and Bespoke Institutional members with a daily ETF Trends report that highlights proprietary trend and timing scores for more than 200 widely followed ETFs across all asset classes. If you’re an ETF investor, this daily report is perfect. Sign up below to access today’s ETF Trends report.
See Bespoke’s full daily ETF Trends report by starting a no-obligation free trial to our premium research. Click here to sign up with just your name and email address.
Trump vs. Clinton — One Word to Describe — Round 3
Each month, Bespoke runs a survey of 1,500 U.S. consumers balanced to census for their views on the broad economy as well as their personal finances. (Please see the bottom of this post for more details on our survey work.) Since our May 2016 survey, we’ve been asking participants in each month’s survey to fill in one word to describe each of the current US Presidential candidates. In early June, we published our first word cloud of the survey responses, which you can view here. Then last month we published our second word cloud post, which you can view here.
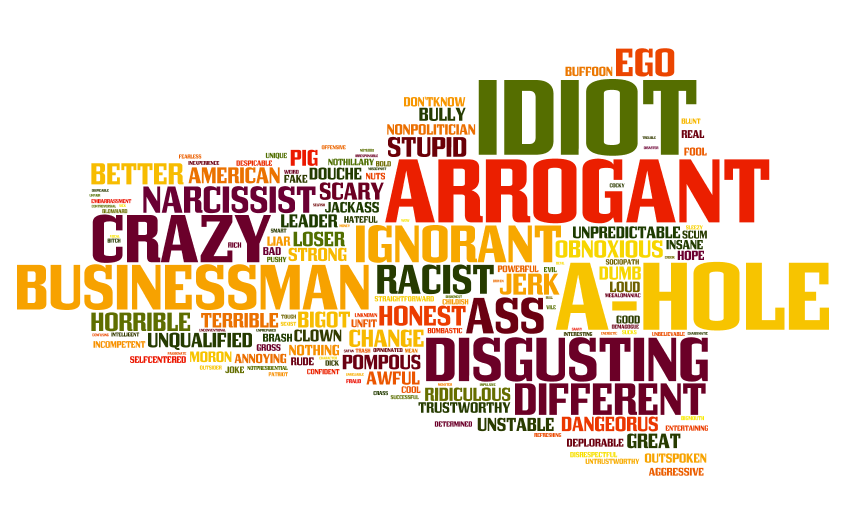
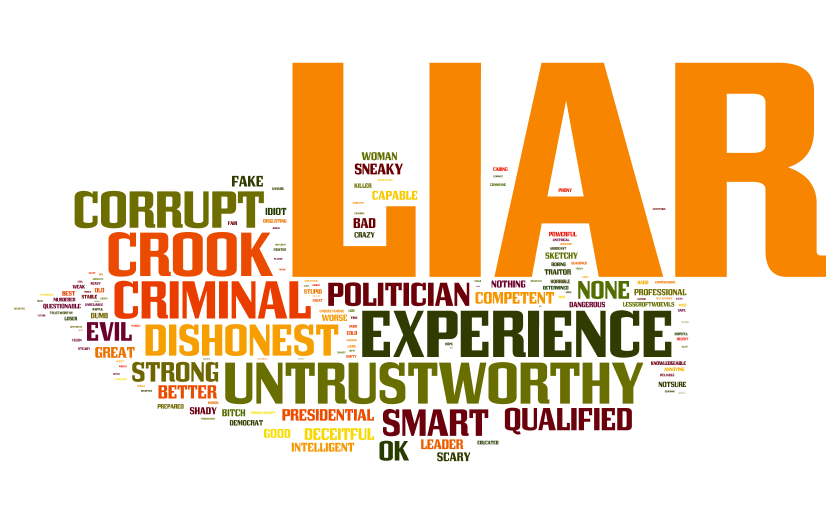
In our September survey, the most commonly used word to describe Trump was “idiot” at 4%. The most common word used to describe Clinton was “liar” at a whopping 15%. This month, with a completely new set of survey-takers, the top word used to describe each candidate stayed the same. Once again, 4% of survey-takers described Trump as an “idiot,” while 17% of survey-takers described Clinton as a “liar,” which is a 2 percentage point increase from last month. Overall, a large majority of responses were negative, which says a lot about the state of this election. As you can see in Trump’s word cloud below, other negative words used to describe the candidate included a**hole, arrogant, crazy, ignorant and disgusting. In last month’s survey, “racist” was the third most used word for Trump, but this month that actually dropped down to the 10th most used word. “Businessman” is one of the few words that can be viewed as a positive that showed up quite a bit. In last month’s survey, “businessman” was cited by 1% of respondents, while this month it was cited by 3% of respondents.
Below is Clinton’s word-cloud, where you can see that “liar” stands out as the most-used word. Other negative words used quite a bit include corrupt, crook, criminal, dishonest, and untrustworthy. There were some positive responses, though. “Experience” was used by 3.6% of survey-takers, which was the second most used word. “Smart” and “qualified” also ranked in the top ten. Overall, Clinton received more positive responses than Trump, but “liar” was by far the most used word overall.
Heading into this year’s election, Americans have deeply negative views about both candidates, and one of them — most likely Clinton at this point — is going to be our next President. With these kinds of numbers, whoever wins is going to have a tough time winning over the public once they take office.
If you’d like to see the rest of our data and analysis from our monthly consumer survey, please read on below:
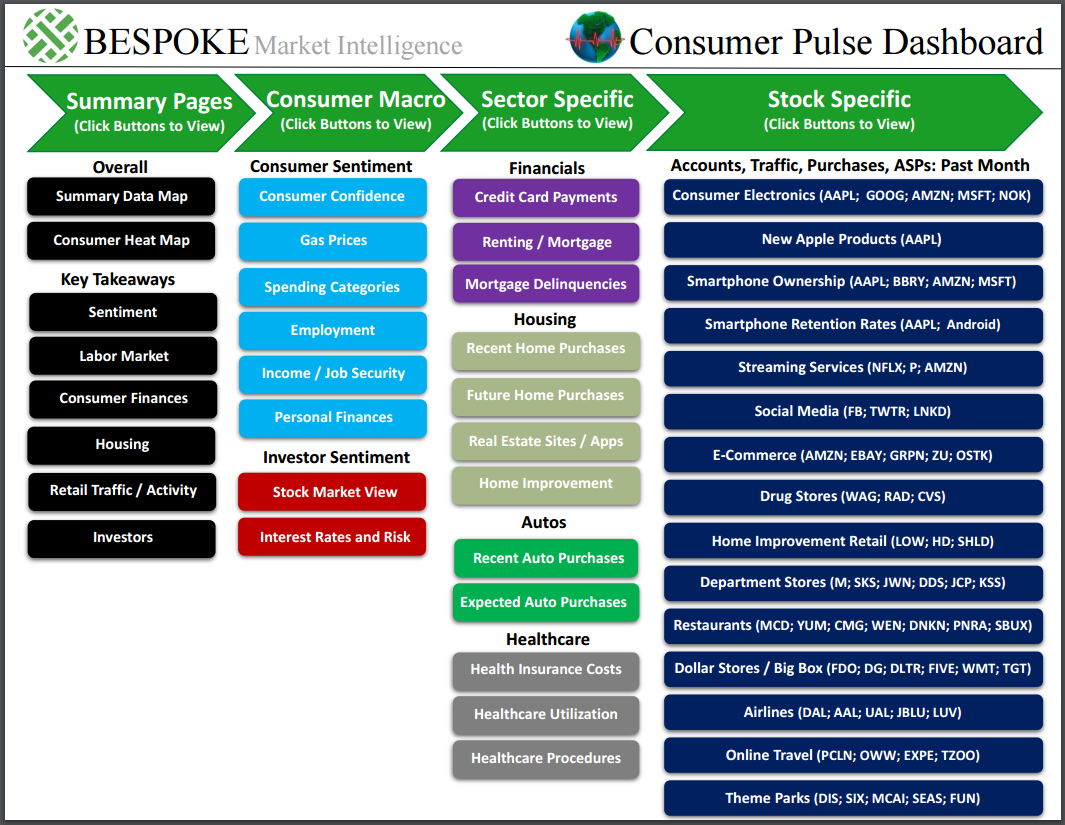
Along with our unique and thought-provoking stock market coverage, Bespoke has another research offering geared towards investors looking to stay ahead of economic and consumer-related trends. Each month, Bespoke surveys thousands of consumers balanced to census to get basically a real-time look at every aspect of the economy. We then package the survey results into our extremely insightful Consumer Pulse Report, which is available as part of our Pulse subscription offering. Below is a snapshot of page one of this month’s Pulse report that was just sent to Pulse subscribers. This is our interactive dashboard that subscribers use to browse through the report. As you can see, the breadth of coverage is remarkable. If you’d like to read it, you can do so for free by signing up for a 30-day trial to our monthly or annual Pulse package below. Also included with a subscription is access to two Pulse Model Portfolios and additional content released throughout the month!
Annual — Bespoke Consumer Pulse — $365/Year w/ 1-Month Free Trial
Monthly — Bespoke Consumer Pulse — $39.99/Month w/ 1-Month Free Trial
Dynamic Upgrades/Downgrades: 10/20/16
Stocks Reacting Positively to Earnings Reports So Far
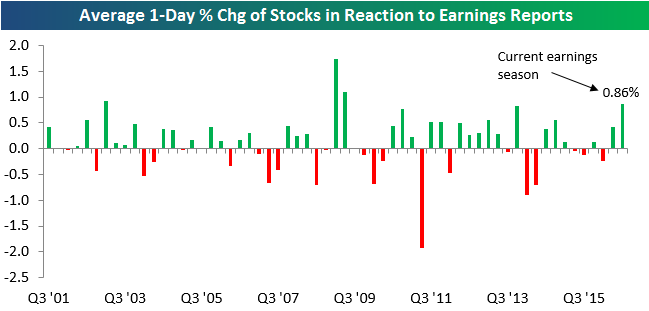
We keep track of every single individual earnings report throughout the quarter with our Interactive Earnings Report Database. One thing we track is how stock prices react on the first trading day following their earnings release. For companies that report in the morning before the open, we look at that day’s price change. For companies that report after the close, we look at the next day’s price change.
So far this earnings season, which began back on October 11th, the average stock that has reported earnings has gained 0.86% on its earnings reaction day. As shown below, that’s a relatively strong number an dif it holds would be right up there as the strongest of the current bull market. While it’s still very early in this quarter’s reporting period, so far, investors have been buyers instead of sellers on earnings news.
Get all of Bespoke’s earnings season analysis with a 14-day no-obligation free trial to our premium research platform.
Strong Internals in Philly Fed Report
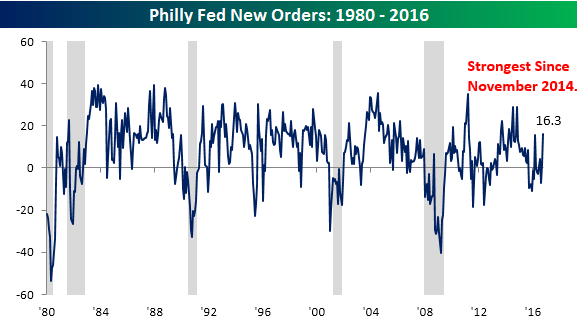
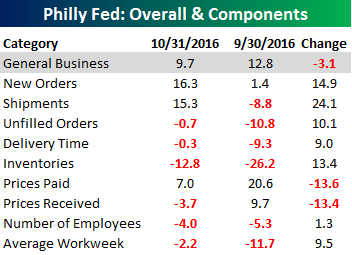 Today’s report on manufacturing in the Philadelphia region showed a decline in General Business conditions compared to September (9.7 vs 12.8), but still managed to beat consensus expectations (5.0). What is noteworthy about this month’s headline reading, though, is that manufacturing activity has now been positive for three straight months. That’s the first time we have been able to say that since August 2015. What was most impressive about this month’s report, though, was the internals. As shown in the table to the right, besides Prices Paid and Prices Received, every other sub-sector showed a month/month increase in October. “New Orders” was especially positive as this reading rose to its highest level since November 2014.
This month’s report was succinctly summed up by the Philadelphia Fed: “Responses to the October Manufacturing Business Outlook Survey suggest continued improvement in the region’s manufacturing sector. Indexes for general activity, new orders, and shipments all indicated expansion this month. However, firms reported continued reductions in overall employment. Firms remained optimistic about increases in overall business activity over the next six months.”
Individual Investors Still Not Feeling It For Equities
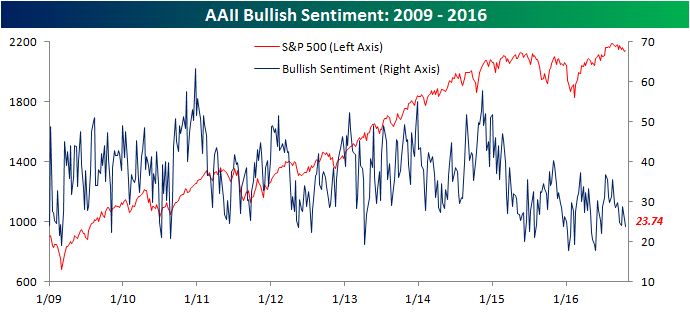
Well, it’s Thursday morning, so that must mean it’s time for another downbeat sentiment survey from AAII (American Association of Individual Investors). In this week’s update, bullish sentiment declined just under two percentage points, which is hardly anything major, but when it comes as part of a six-week slog where bullish sentiment has declined in five of those, it says a lot about just how negative individual investors are towards the equity market. At a level of 23.74%, bullish sentiment is the lowest it has been since the Brexit vote, even as the S&P 500 is within 2.5% of a 52-week high. This now makes it 51 straight and 85 out of the last 86 weeks where bullish sentiment has come in below 40%.
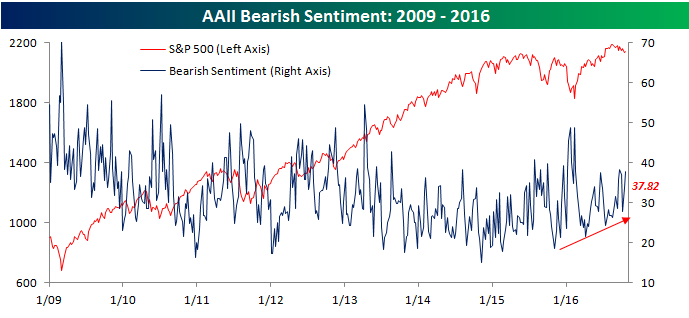
The bulls didn’t just move to the sidelines and turn neutral either. While bullish sentiment declined just under two percentage points, bearish sentiment ticked up over four points to 37.82%, and that comes on the heels of last week’s 5.8 point increase. Besides the week ending 9/22 where bearish sentiment was slightly higher at 37.82%, negative sentiment hasn’t been this high since the February lows.
The Closer 10/19/16 – Housing Hobbled, Oil Drawn
Looking for deeper insight on global markets and economics? In tonight’s Closer sent to Bespoke clients, we summarize our view of the supply side of the housing market while updating the most recent data from the US Census on residential construction. We also discuss today’s EIA report on the petroleum market.

The Closer is one of our most popular reports, and you can sign up for a trial below to see it and everything else Bespoke publishes free for the next two weeks!
Click here to start your no-obligation free Bespoke research trial now!
Chart of the Day: High Yield Bond ETF Approaching New Highs
B.I.G. Tips – Last Hour Winners and Losers
In yesterday’s Chart of the Day, we highlighted the pattern within the S&P 500 since the August high where there has been a steady stream of sellers coming into the market in the final hour of trading. To further illustrate the last hour weakness we have seen, consider the fact that YTD through 8/15 the S&P 500 traded higher in the last hour of trading 62% of the time. Additionally, in the 35 trading days following the two-day Brexit sell-off, the last hour of the day was positive 74% of the time. In the 44 trading days since the 8/15 closing high, however, the S&P 500 has traded lower in the last hour of trading more than half of the time (52%).
In order to get a better understanding of what has been driving the last hour weakness in equities over the last two months, in our most recent B.I.G. Tips report, we analyzed the last hour performance of individual stocks during this period to see which ones, and collectively which sectors, have been driving the weakness. Conversely, we also wanted to get a read on what areas of the market were potentially bucking the trend. To view this report, sign up for a monthly Bespoke Premium membership and get 10% off for life ($89/month).
The Bespoke Market Calendar — 2016/2017
 The Bespoke Market Calendar — 2016/2017 is now available for purchase! Whether it’s for you or someone that you’re trying to find the perfect gift for, the Bespoke Market Calendar is a must-have for anyone with even a passing interest in the stock market. Traders and investors keep this printed calendar booklet at their desks and use it throughout the year to stay on top of everything going on in financial markets. Every year we get amazing feedback from those that purchase the calendar, and the requests for this year’s calendar have been rolling in!
Here’s a snippet from a prior year’s calendar to get an idea of all the information that’s covered in this must-have booklet.
The 2016/2017 Bespoke Market Calendar is available for just $19.95 either on its own or using the special offer below:
Basically, you pay $19.95 and get the Bespoke Market Calendar mailed to your door (no shipping charges) plus one month of Bespoke Newsletter, Bespoke Premium, or Bespoke Institutional. Bespoke Newsletter is our lowest level of service at a normal rate of $49/month. Bespoke Premium is our most popular level of service at a normal rate of $99/month. And Bespoke Institutional is our highest level of service at a normal rate of $195/month.
 If you purchase the Bespoke Market Calendar to go along with one month of our subscription offerings below, you can cancel your subscription at any time at no additional charge. If you’d like to continue with the subscription past the first month, simply do nothing and you’ll renew at our normal rates. You’re not locked into any kind of long-term agreement; we’re just using this as a chance to show you our quality research product. You can also receive a free copy of the Bespoke Market Calendar by signing up for any of our annual subscription offerings.
Bespoke Market Calendar w/ one month of Bespoke Newsletter (pay $19.95 now, then $49/month after first month)
Bespoke Market Calendar w/ one month of Bespoke Premium (pay $19.95 now, then $99/month after first month)
Bespoke Market Calendar w/ one month of Bespoke Institutional (pay $19.95 now, then $195/month after first month)