B.I.G. Tips – 2017 First Half Decile Analysis
Bespoke Stock Seasonality: 7/3/17
ETF Trends: US Sectors & Groups – 7/3/17
Oil continues its strong performance among the world of ETFs that we track, up 7% over the past 5 days. Steel and Banks are also notable outperformers. On the other hand, Miners and Real Estate are underperforming, which has been a constant trend over the past couple sessions. Additionally, Biotech has slowed down after its recent strong performance, down just over 3% this week.

Bespoke provides Bespoke Premium and Bespoke Institutional members with a daily ETF Trends report that highlights proprietary trend and timing scores for more than 200 widely followed ETFs across all asset classes. If you’re an ETF investor, this daily report is perfect. Sign up below to access today’s ETF Trends report.
See Bespoke’s full daily ETF Trends report by starting a no-obligation free trial to our premium research. Click here to sign up with just your name and email address.
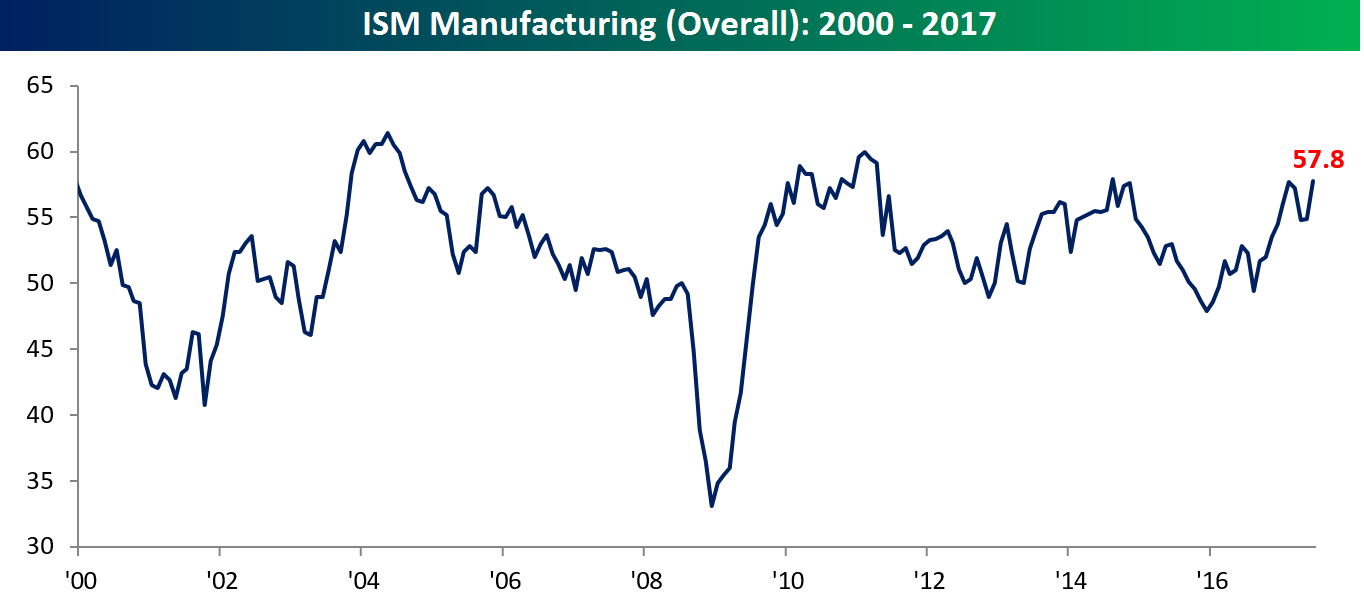
ISM Manufacturing Near a Six-Year High
While economic data continues to come in mixed to generally weaker relative to expectations, the ISM Manufacturing report for June was very strong on an absolute basis and relative to expectations. While economists were expecting the headline index to come in at a level of 55.1 from last month’s level of 54.9, the actual reading came in at 57.8, which is just shy of the six-year high of 57.9 back from August 2014.
Want to see more analysis like this? Click here to start a no-obligation two-week free trial to our premium research platform.
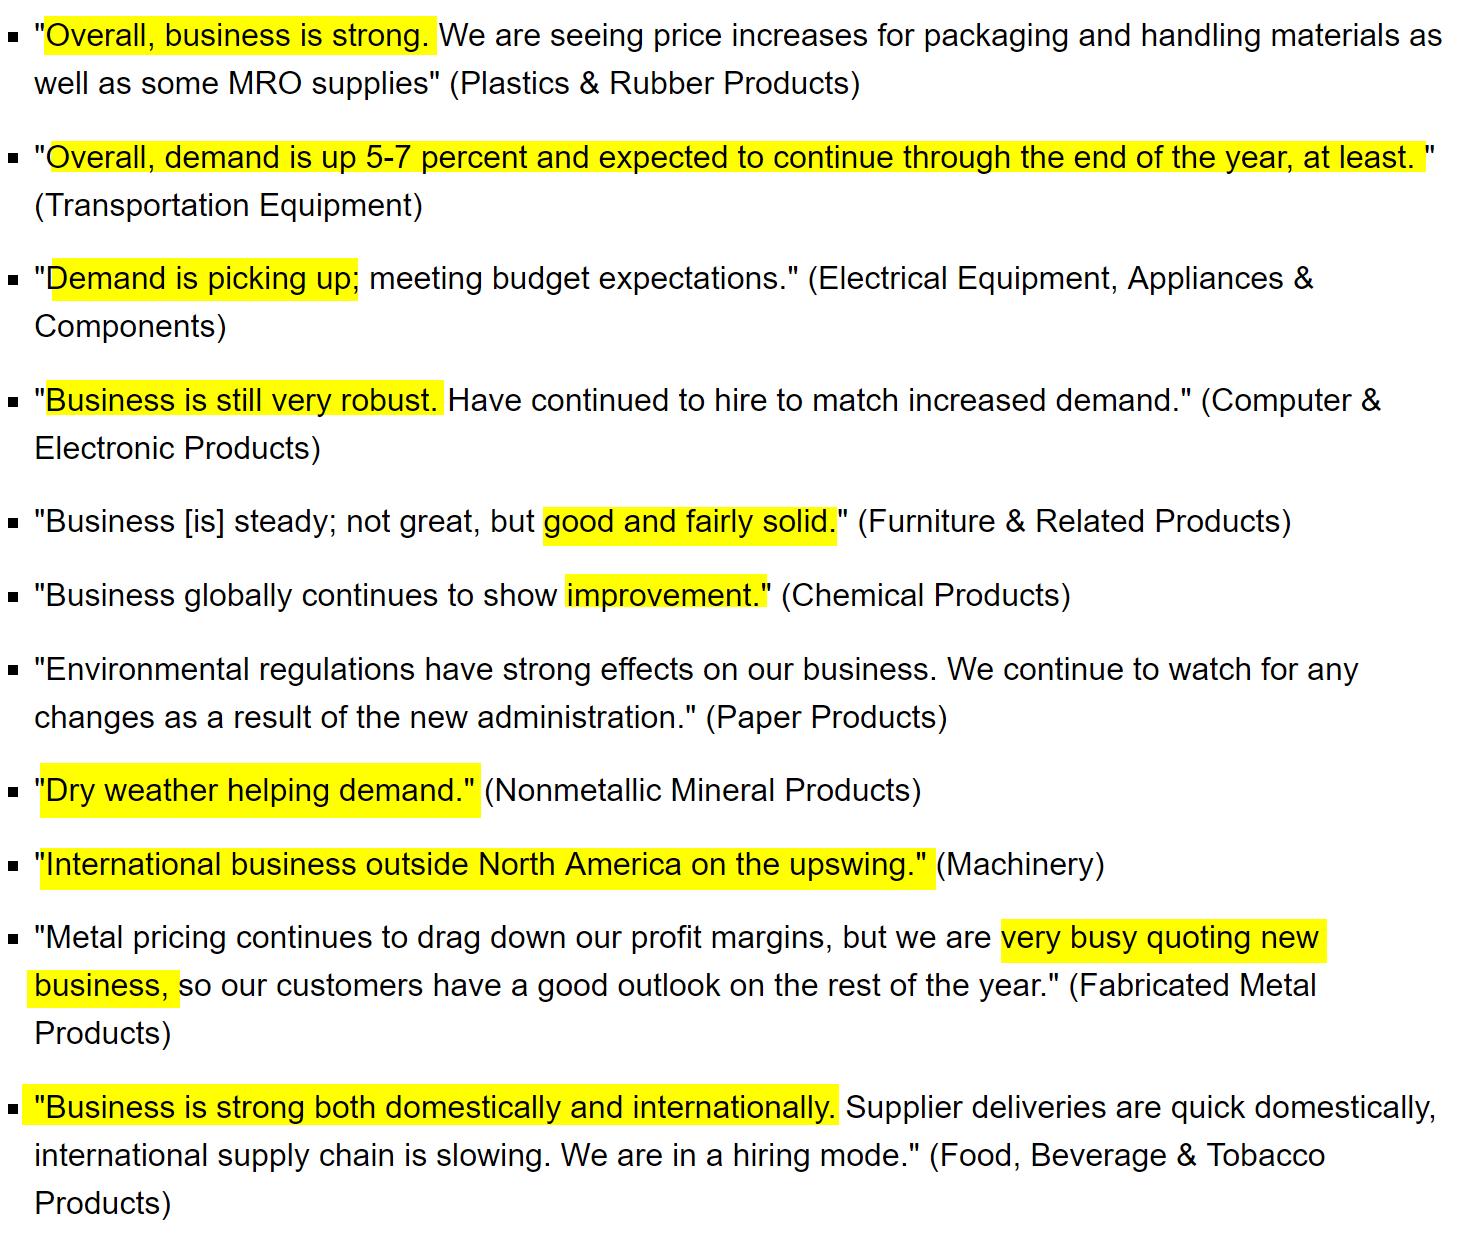
Not only was the headline index strong, but the commentary also paints a picture of robust activity. Below we have included a snapshot of some of the selected commentary from this month’s report. With the exception of one comment concerning environmental regulations, every other one suggests steady, solid, and or strong business activity.
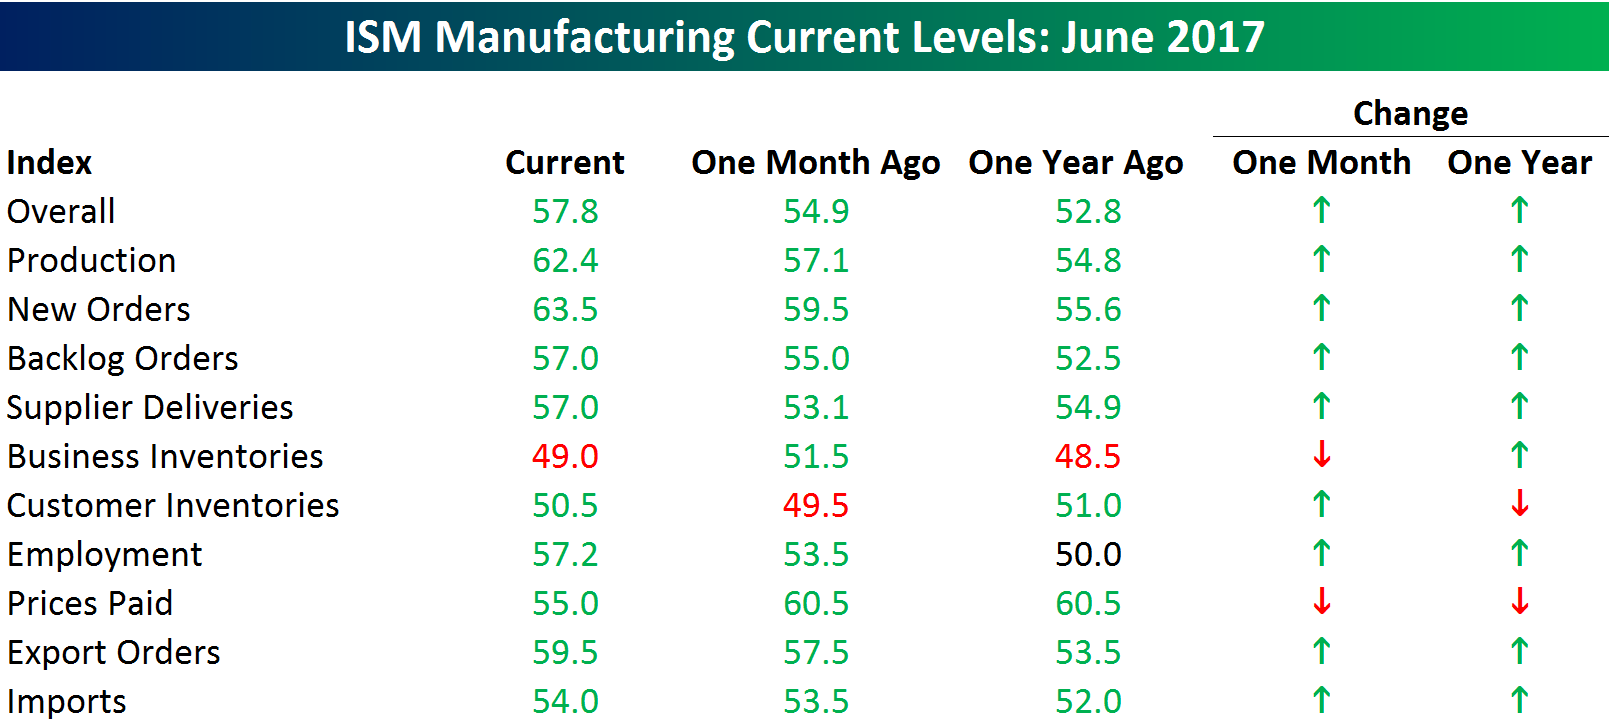
The internals of the report further confirm that positive tone. Of the ten sub-indices in the report, all but two showed a m/m and y/y improvement in June. The biggest increases on a sequential basis were Production and New Orders. On the downside, Prices Paid was far and away the largest decliner in June.
July “Old Reliables”
Every Monday (or the first trading day of the week), Bespoke Premium and Institutional clients receive our S&P 500 Stock Seasonality report. Using the last ten years worth of price data, our Stock Seasonality report looks at the median returns for the S&P 500, its eleven sectors, and its 500 individual stocks. In the report, we highlight the five stocks in each sector that have historically been the best and worst performers over the next two weeks. For each stock, we also include information such as median returns, the percent of time each stock or sector is positive/outperforms the S&P 500, and its historical performance over the next two weeks for each of the last ten years. To see a sample, check out a recent report here. To receive regular access to the full S&P 500 Stock Seasonality report, sign up for a Bespoke Premium membership now.
With July kicking off today, we wanted to highlight S&P 500 stocks that have been the most consistent to the upside during the entire month over the last ten years. The table below lists the 13 stocks in the S&P 500 that have been up during the month of July in at least nine of the last ten years. Leading the way higher among the stocks listed is Celgene (CELG) which has seen a median gain of 11% with gains in every July except 2011 when it fell 1.7%. Behind CELG, another biotech — Alexion Pharma (ALXN) — has seen a median gain of 9.7% with gains in July in each of the last ten years.
Number three on the list is Wynn Resorts (WYNN), which has been up in every July over the last ten years except 2012. Over those ten years, the stock has seen a median gain of 7.4%. WYNN is digging itself into a bit of a hole to start the month as the stock is down 3% following weaker than expected revenue growth in Macau gaming revenues, but there are still another 30 days left in the month, so we shall see.
The fourth and fifth best-performing stocks are two that are going in seemingly different directions. Amazon.com (AMZN) has been a star for the last several months, and July also tends to be a good month as the stock has seen a median gain of 7.0% with gains in each of the last ten years except for 2014. Behind AMZN, IBM has been a proverbial stick in the mud for years now, but at least July has been good for the stock as it has seen a median gain of 5.4% with gains in every July except 2015 when it fell just 0.4%.
Obviously investors shouldn’t trade solely on the calendar, as macro or stock-specific events can come up and trump seasonal tendencies. That being said, there certainly is evidence that the market and many stocks do indeed follow seasonal patterns, so it pays to be aware of them

2017 First Half Global Equity Market Returns — Latvia Takes Top Prize
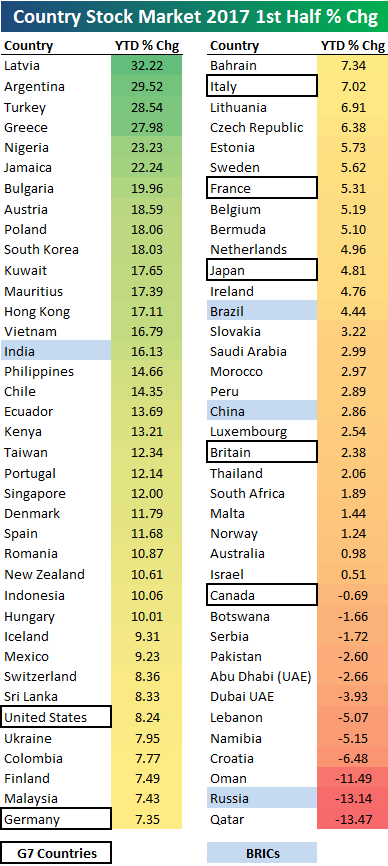
Below is a look at the performance of 76 country stock markets around the world in the first half of 2017. Returns are in local currency. The average first-half percentage change for all 76 countries was 7.84%, and 84% of countries were in the green.
As shown, Latvia takes first place in the first half with a gain of 32.22%, followed by Argentina (29.52%), Turkey (28.54%), and Greece (27.98%). The United States was the top performing G7 country in the first half with a gain of 8.24%, followed by Germany , Italy, France, and Japan. Canada was the worst G7 country with a decline of 0.69%.
Of the 4 BRICs, India was up the most with a gain of 16.13%. Russia was the only BRIC in the red with a decline of 13.14%.
Russia was the second worst stock market in the first half behind only Qatar, which fell 13.47%.
Want to see more analysis like this? Click here to start a no-obligation two-week free trial to our premium research platform.
Auto Sales: Don’t Call It A Comeback
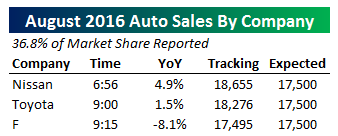
Update 2 11:49 AM: Strong sales growth from Volkswagen (rebounding off post-diesel scandal market share lows) and Subaru (gaining share in leaps and bounds from a relatively low starting point, but making new highs) have helped push our tracker for industry sales pace in June back above estimates. Currently we are tracking a very small beat despite enormous sales declines from the largest US auto makers. Fiat-Chrysler’s cringe-worthy declines actually drove our sales tracker below estimates at one point, and Toyota is the only major to report YoY volume growth. Generally speaking, smaller car companies have been able to do a better job growing sales than the large US brands.
Update 1 9:34 AM: While the industry was looking pretty strong prior to 9:15, Ford, Mazda, and GM reports around that time put an end to the extremely strong versus expectations tracking data we discuss below. As shown in the table at right, all three companies reported large NSA sales declines YoY, and had a combined negative impact of nearly 700,000 SAAR on our tracker. With 66% of the industry now reported, instead of strong gains that were indicated by tracking this morning, it’s now possible that the industry will miss estimates entirely! We will continue to update our tracker as new sales data is released from manufacturers throughout the day.
Auto sales have strung up a series of brutal defeats recently as sales pace has sagged to the mid-16mm SAAR range from over 18mm SAAR at the recent peak. That includes a string of misses in recent months that have seen analysts drastically over-estimate sales figures for the industry. .In June, however, we’re getting the opposite. As of this writing, with about one-third of the industry reported, auto sales are tracking a beat versus expectations per our seasonal and trading day adjustment of raw manufacturer sales figures. Honda, Toyota, and Nissan have all bested analyst estimates, and have together put the industry on pace to handily beat the expected 16.52mm SAAR sales pace that analysts had forecast for the month. We’ll continue to update this post throughout the day as other manufacturer sales figures are released.
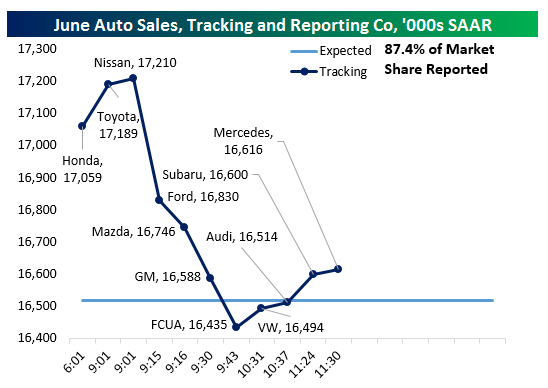
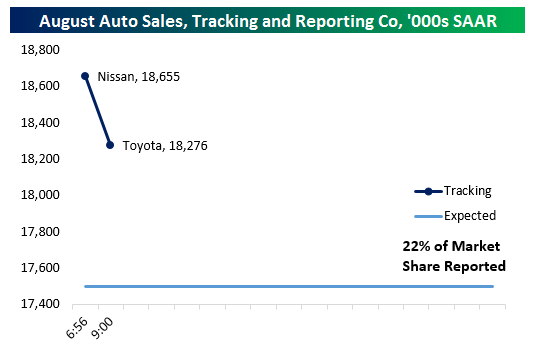
Chart of the Day: Monday, July 3rd Market Returns
Bespoke Brunch Reads: 7/2/17
Welcome to Bespoke Brunch Reads — a linkfest of the favorite things we read over the past week. The links are mostly market related, but there are some other interesting subjects covered as well. We hope you enjoy the food for thought as a supplement to the research we provide you during the week.
See this week’s just-published Bespoke Report newsletter by starting a no-obligation two-week free trial to our premium research platform.
Investing
Just Like That, a Bad Year for Buybacks Becomes a Good One by Lu Wang (Bloomberg)
With the approval of capital return plans by the Fed this week, banks have boosted the annual buyback totals quite dramatically. [Link]
Ex-Bridgewater Quant Says Smart Beta ETFs Use Factors All Wrong by Dani Burger (Bloomberg)
It turns out that factor-based investing might work better as a way to find shorts. [Link]
Insurance Is the Hot New Way to Avoid Taxes by Sonali Basak and Tom Metcalf (Bloomberg)
Insurance products allow high net worth individuals to see capital compound within policies, untaxed, and disbursed to beneficiaries of the policyholder after they die. [Link]
Labor Markets
Want a $1 Million Paycheck? Skip College and Go Work in a Lumberyard by By Prashant Gopal and Matthew Townsend (Bloomberg)
The popular conception of high paying jobs: that they only come from a college degree and aren’t what you’d call blue collar. That’s not actually the case. [Link]
A Mystery Fed Candidate Won a Seat at the FOMC Table, Then Walked Away by Christopher Condon (Bloomberg)
Prior to the appointment of President Harker to his seat at the head of the Philadelphia Fed, another candidate was considered and even approved by the Board of Governors but turned down the spot. [Link]
Rural America
Rural Youth Chase Big-City Dreams by Dante Chinni (WSJ)
A fascinating accounting of population flows out of small towns and into areas hosting large colleges, then to cities…but not back to the rural counties where they grew up. [Link; paywall]
Social Science
Equity, efficiency and education spending in the United States by Nick Bunker (Washington Center for Equitable Growth)
A new study has shown no trade-offs between efficiency and equity in education spending, a remarkable finding that would be relatively unique in public policy. [Link]
Inequality
Counterintuitive problem: Everyone in a room keeps giving dollars to random others. You’ll never guess what happens next. (Decision Science News)
Random distribution of income does not lead to equality, but instead creates quite a bit of inequality, a counter-intuitive outcome. [Link]
People Differences vs. Place Differences: What Causes Social Mobility? by Robert VerBruggen (Institute for Family Studies)
One factor that can mitigate inequality is high social mobility: if there’s lots of inequality, it’s less damaging if people move up and down across the income spectrum. But social mobility is deeply tied to a number of factors, explored in this piece. [Link]
Seattle Minimum Wage
A ‘very credible’ new study on Seattle’s $15 minimum wage has bad news for liberals by Max Ehrenfreund (WSJ)
Seattle introduced a very large minimum wage hike a few years ago and we’re starting to get data on what it means. The first reaction was that the study showed very large effects (negative ones) on employment and hours. [Link; soft paywall]
The “high road” Seattle labor market and the effects of the minimum wage increase by Ben Zipperer and John Schmitt (Economic Policy Institute)
A contrary argument on reading too far into the findings of the Seattle minimum wage study. The piece lays out some good reasons to be skeptical about the findings. [Link]
The City Knew the Bad Minimum Wage Report Was Coming Out, So It Called Up Berkeley by Daniel Person (Seattle Weekly)
A sideshow to the academic debate about the Seattle study was what appeared to be manipulation by the Seattle Mayor’s office. It’s a bit complicated, but it’s worth reading as an example of how not to conduct oneself as an academic researcher. [Link]
Science Terrifying And Hilarious
Scientists can’t rule out collision with asteroid flying by Earth in 2029 by Mike Wehner (BGR)
99942 Apophis is bound for Earth, and while a collision isn’t forecast, at an estimated approach of less than 20,000 miles the 1200 foot diameter rock with an estimated yield on collision of more than 750 megatons would be a really bad day for the planet if it did end up hitting. [Link]
That Time the TSA Found a Scientist’s 3-D-Printed Mouse Penis by Ed Yong (The Atlantic)
A compilation of the hysterical travails of scientists trying to get through security with their panoply of paraphernalia. [Link]
This Week In The Valley
More Than 50% of Shoppers Turn First to Amazon in Product Search by Spencer Soper (Bloomberg)
Amazon is the first destination for more than half of consumers, a massive advantage for the e-commerce giant. [Link]
Waymo, Apple Deals Bolster Rental Firms for Ride-Sharing Age by David Welch and Alex Webb (Bloomberg)
Car rental giants Avis and Hertz have signed deals to manage (service and repair) the hardware that Apple and Alphabet Inc are using to help deploy autonomous vehicles. [Link; auto-playing video]
Not A Good Look
NYSE President Calls Short Sellers ‘Icky’ by Annie Massa (Bloomberg)
In a move jeered at by short-sellers across The Street, a New York Stock Exchange executive called short-selling un-American this week. [Link]
Phil’s Insider-Trading Escape by Jeffrey Toobin (Golfworld)
A long read on how Phil Mickelson managed to avoid insider trading charges. [Link]
Potpourri
Why my guitar gently weeps by Geoff Edgers (WaPo)
As young people explore other forms of music, and the venerable guitar hero fades into the past, there’s less interest in playing and owning high-end guitars. [Link; soft paywall]
Old Glories: A Salute to Antique U.S. Flags, and Where to Find One by Steve Garbarino (WSJ)
An oral history of antique flags, which can be both unique and expensive. [Link; paywall]
If Buddhist Monks Trained AI by Alexis C. Madrigal (The Atlantic)
How do Buddhist monks respond to the classic “Trolley” problem, a key philosophical and moral issue for designers of code that will run autonomous vehicles. [Link]
Have a great Sunday!
Biggest S&P 500 Winners and Losers of the First Half — 2017
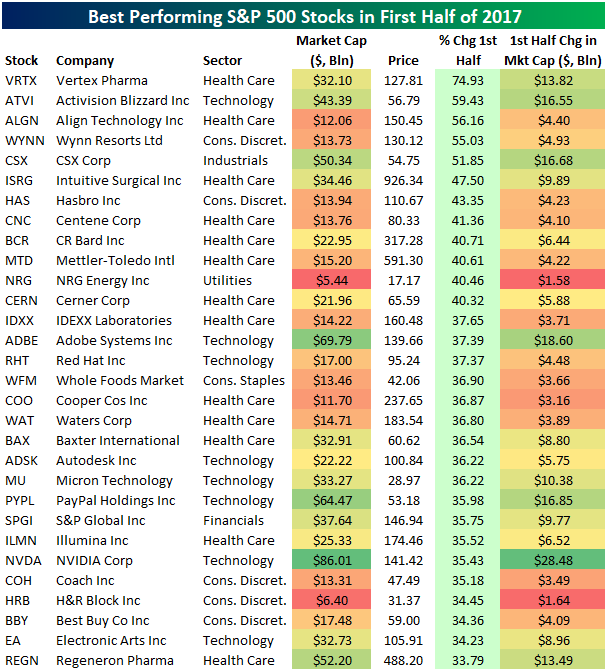
Below is a look at the best performing S&P 500 stocks in the first half of 2017. Each stock that made the cut gained more than 33%. At the top of the list is Vertex Pharma (VRTX), which gained 74.93%. Activision Blizzard (ATVI) ranks second at +59.43%, followed by Align Technology (ALGN) at +56.16%. Wynn Resorts (WYNN) and CSX round out the top five.
Other notables on the list of first half winners include Intuitive Surgical (ISRG), Hasbro (HAS), Adobe (ADBE), NVIDIA (NVDA), Coach (COH), and Best Buy (BBY).
Want to see more analysis like this? Click here to start a no-obligation two-week free trial to our premium research platform.
We’ve also created a table to show the biggest gainers in market cap in the first half of 2017. As shown, Apple (AAPL) gained the most at +$133.31 billion, followed by Amazon.com (AMZN) at +$106.37 billion and Facebook (FB) at +$105.20 billion. Alphabet (GOOGL) ranked 4th at +96.7 billion. In fifth place, but well behind the top four was Oracle (ORCL) with a gain of $49.68 billion. Oracle’s big gain is impressive, however, but it was overshadowed by all the attention on the “FAANG” stocks in the first half.

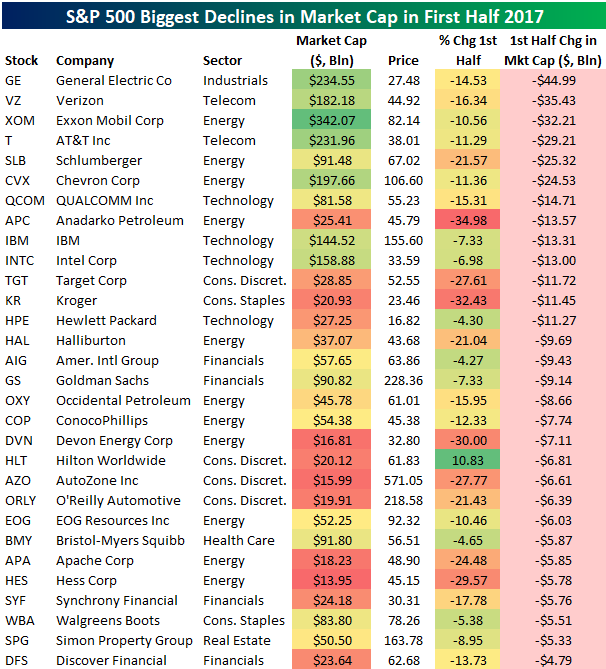
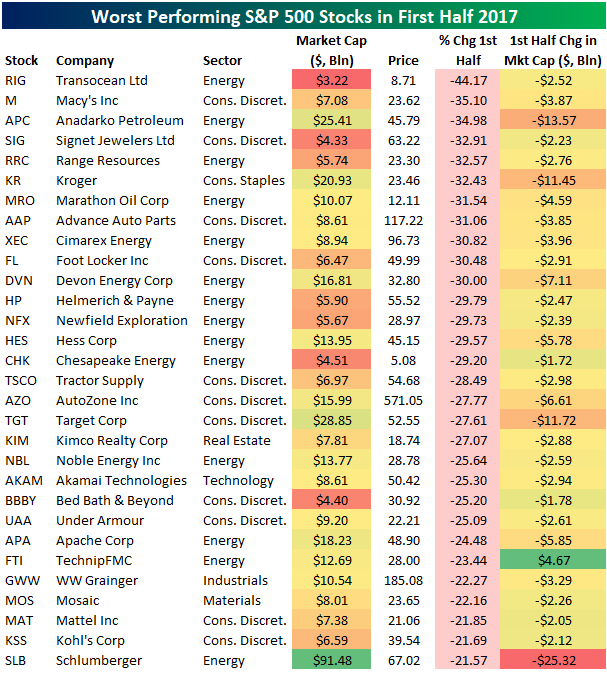
Of course, you can’t just highlight the winners all the time. Below is a list of the worst performing S&P 500 stocks in the first half of 2017. Transocean (RIG) tops the list with a drop of 44.17% in the first half. Macy’s (M) ranks second worst at -35.10%, followed by Anadarko Petroleum (APC), Signet Jewelers (SIG), and Range Resources (RRC). Other notables on the list include Kroger (KR), Foot Locker (FL), AutoZone (AZO), Bed Bath & Beyond (BBBY), Under Armour (UAA), Target (TGT), and Kohl’s (KSS). In the case of Autozone (AZO), it seems to be picking up in the second half right where it left off in the first as it’s already down 10%!
Basically all of the weakness in the first half was in Energy or Retail.
In terms of market cap, General Electric (GE) was the biggest loser in the first half of 2017. GE lost $44.99 billion in market cap, dropping its total market cap to $234.55 billion. Verizon (VZ) lost the second most at -$35.43 billion, followed by Exxon Mobil (XOM) at -$32.21 billion and AT&T (T) at -$29.21 billion.