Leading and Lagging Groups Since the July High
With the S&P 500 finally taking out its July high on Monday, there has been a lot of movement below the surface in terms of leading and lagging groups. In fact, 18 groups within the S&P 500 are up over 5% since the last high back in July while 13 are down over 5%. In the table below, we list the best and worst-performing groups since the 7/26 closing high. To make the list, each group had to either be up or down 2%.
On the upside, leadership has been spread across a variety of sectors. Leading the way higher, Tech Hardware (think Apple) has rallied over 17% and with an overall weight in the index of nearly 4%, this group has been a key leader of the market. The only other group up over 15% is Household Durables (homebuilders), which has a much smaller weight in the S&P 500. Behind these two groups, another five – Multiline Retail, Construction Materials, Construction & Engineering, Biotech, and Trading Companies – have seen double-digit gains since the late July high. The fact that the seven groups with the strongest gains come from five different sectors suggests that the rally isn’t especially narrow, even if the percentage of stocks hitting new highs has been lacking.
On the downside, Leisure Equipment and Products has been the worst performing group in the S&P 500 with a decline of 21.9%. The weakness in this group, though, is 100% attributable to Hasbro (HAS), which is the only stock in the group (hence its 0.1% weight in the S&P 500). Behind Leisure, Communications Equipment has dropped more than 14% driven by weakness in Cisco (CSCO). Finally, what would a list of losers be without a group from the Energy sector?
What’s most interesting about this list is that even as the market has been essentially flat over the last three months, there’s been a lot of dispersion in performance – not just within the market, but also within sectors. Take the Consumer Discretionary sector, for example. While five of the sector’s groups are on the list of best performers since the 7/26 high, there are also five on the list of biggest losers. Start a two-week free trial to Bespoke Institutional for full access to some of the most sought after research on the street, including our Trend Analyzer tool.

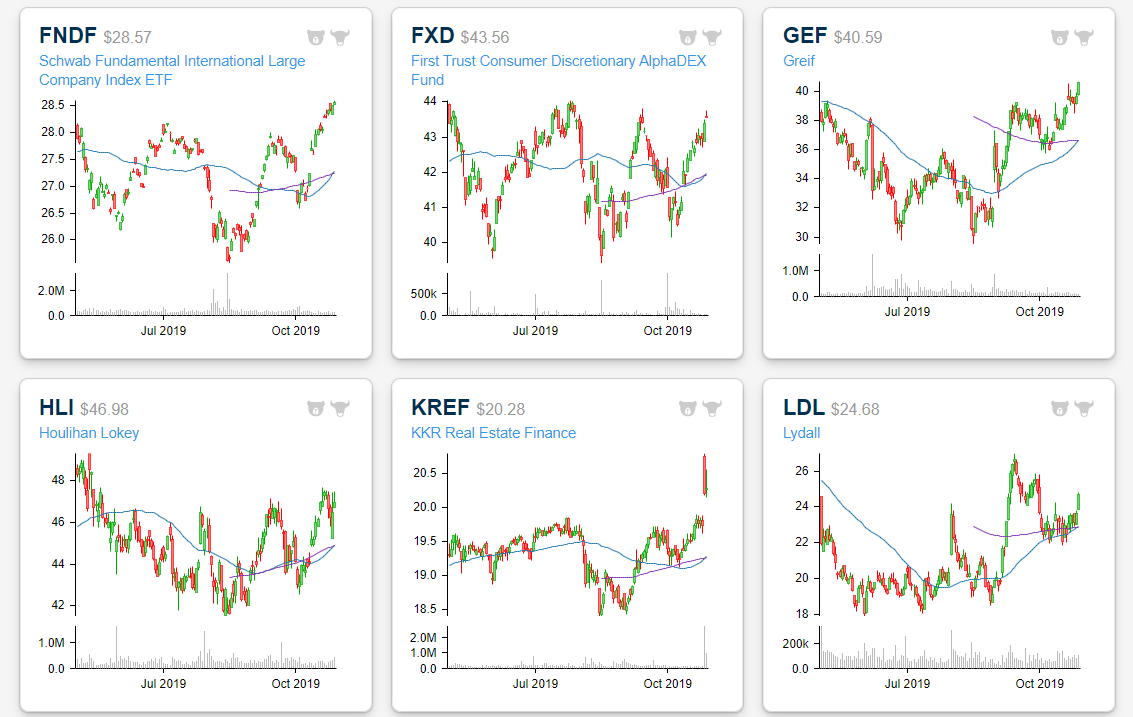
16 Golden Crosses
Our popular Chart Scanner tool is extremely helpful for chart readers who want to be able to consume a massive amount of charts in a short period of time. We have a “Screens” section in the Chart Scanner that lets users see charts of stocks that just hit 52-week highs or lows, for example. Another part of the Screens section shows stocks or ETFs that just experienced a “golden cross.” If you’re a follower of technical analysis, you know that a “golden cross” is a supposed bullish pattern that occurs when a security’s 50-day moving average crosses above its 200-day moving average as both moving averages are rising. With the S&P 500 reversing late-September losses and closing at a new high this week, we’re seeing a pick-up in golden crosses these days. Below is a list of the 16 that showed up in our “Golden Cross” screen after the close yesterday. You can see the 50-DMA crossing above the 200-DMA very clearly in each of the charts. A few notables include Citizens Financial (CFG), Fifth Third (FITB), LyondellBasell (LYB), and Marathon Petroleum (MPC). If you want to monitor prior golden crosses to see how they perform moving forward, all you have to do is click the “Bull” or “Bear” icon on each chart and they’ll show up in your “Saved Charts” folder. Start a two-week free trial to Bespoke Institutional to start using our Chart Scanner tool today!


Grub-Dud
While there were eight companies that reported triple plays since yesterday’s close by beating EPS estimates, beating sales estimates, and raising guidance, GrubHub (GRUB) posted a reverse triple play. A reverse triple play is a company that misses EPS estimates, misses sales estimates, and lowers guidance. It doesn’t get any worse than that.
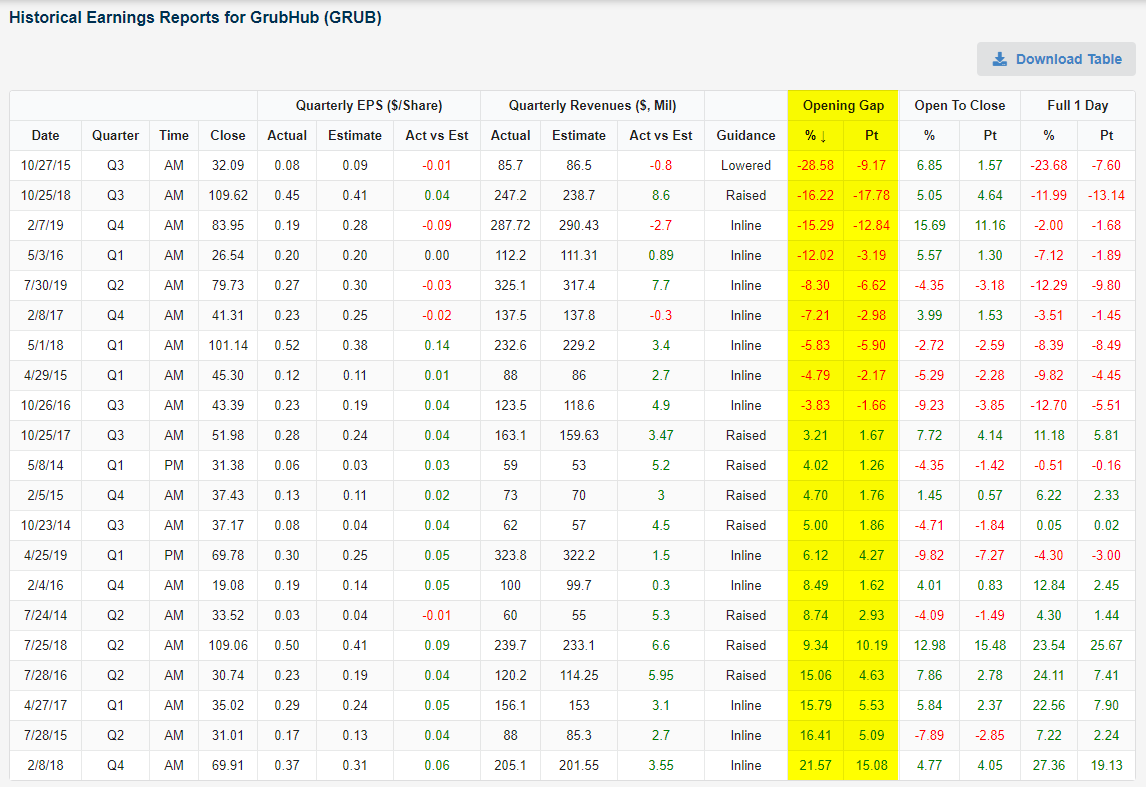
GrubHub (GRUB) shares are reacting accordingly to the reverse triple play. The stock just opened down 33% from yesterday’s closing price, which is by far the biggest gap down on earnings that the stock has experienced since its first quarterly report back in May 2014. Below is a snapshot of all of GRUB’s historical reports pulled from our Earnings Explorer tool. We’ve sorted the list by opening gaps from worst to best. Heading into this report, the biggest gap down that GRUB had experienced was a 28.58% lower open on October 27th, 2015. That day at least, the stock managed to recover by 6.85% from the open to the close, but it still resulted in a full-day decline of 23.68%. While it’s not much consolation given that shares are giving up a third of their value this morning, the four times the stock has gapped down at least 10% on earnings in the past, shares have at least traded up from the open to the close by 5% or more. Start a two-week free trial to Bespoke Institutional for full access to some of the most sought after research on the street, including our Earnings Explorer tool.
Today’s Earnings Triple Plays; Beyond Bombs
Guidance numbers have been pretty atrocious this earnings season, with companies lowering guidance about twice as much as companies are raising guidance. Even still, there have been plenty of earnings triple plays this season, with another 8 registered since the close yesterday.
An earnings triple play is when a company raises guidance, beats EPS estimates, and beats sales estimates. Long-time Bespoke readers know that we’ve been following triple plays since our inception back in the mid-2000s. Investopedia.com has even given the triple play its own entry, providing credit to Bespoke for coming up with the term.
Below is a list of the triple plays registered either after hours yesterday or in the pre-market this morning. While four of them are trading nicely higher — Leidos (LDOS), Merck (MRK), NeoGenomics (NEO), Xerox (XRX) — the biggest bust on the list by far is Beyond Meat (BYND). Even with an earnings and sales beat and increased forward revenue guidance, BYND is set to open down nearly 20% this morning supposedly due to concerns about pricing and increased competition and the end of the employee lock-up period.

Things couldn’t get any better for Beyond Meat (BYND) in the early days following its IPO. You probably remember that shares pretty much couldn’t go down during the summer months, and they were seemingly closing higher by 10-20% every day for a few weeks! After pricing at $25/share at its IPO on May 1st, BYND shares reached their peak of $234.90 on July 26th — a ridiculous gain of 840% in less than three months!
Since peaking just over three months ago, though, it has been straight downhill. Based on where shares are trading in the pre-market, BYND will be down 63.7% from its high and only up 29.7% from where it opened on its first day of trading on the secondary market. Start a two-week free trial to Bespoke Institutional for full access to some of the most sought after research on the street.

Bespoke Morning Lineup – 10/29/19 – Taking a Breather
See what’s driving market performance around the world in today’s Morning Lineup. Bespoke’s Morning Lineup is the best way to start your trading day. Read it now by starting a two-week free trial to Bespoke Premium. CLICK HERE to learn more and start your free trial.

The Closer – Change in Tone, Economic Data Deluge – 10/28/19
Log-in here if you’re a member with access to the Closer.
Looking for deeper insight on markets? In tonight’s Closer sent to Bespoke Institutional clients, we begin with a look at the market’s change in tone regarding risk. We then look at how the United States’ share of global market cap has declined. Next, we review all of today’s economic data including the Chicago Fed’s National Activity Index, the Dallas Fed’s manufacturing results, monthly data on the federal government’s budget, and finally, retail and wholesale inventories.

See today’s post-market Closer and everything else Bespoke publishes by starting a 14-day free trial to Bespoke Institutional today!
New Highs MIA
Earlier today, we noted in a tweet that despite the record highs for the S&P 500, the number of stocks hitting 52-week highs was extremely weak at 38. While that number improved slightly this afternoon, at 40 it’s still very low for a day when the index itself is hitting a new all-time high. While the overall number of stocks hitting new highs is very low, we can take some consolation in the fact that more than one-third of the index is within 5% of a new high, so if we see a few more days like Monday, the list of new highs should start to meaningfully expand.

The table below summarizes the percentage of stocks in each sector that are within 5% of a new high. Topping the list is Utilities where more than half of the sector’s components are less than 5% from a new high. Behind Utilities, nearly half of stocks in the Industrials sector are also on the verge of a new high. At the other end of the list, Energy has the fewest components within 5% of a 52-week high at just 7%, and then three other sectors have a quarter or fewer of their components at new highs (Health Care, Consumer Staples, and Materials).

The chart below is the same as the one above, but instead of sorting the components by the distance from their respective 52-week highs, we sorted it first by sector and then by the distance from a 52-week high. Five sectors currently have at least one component that is down over 50% from a 52-week high (Consumer Discretionary – Macy’s and L Brands, Consumer Staples – Kraft Heinz, Energy – Concho Resources and Cimarex, Health Care – ABIOMED, and Technology – DXC Technology and Alliance Data Systems). On the other end of the spectrum, if you look closely at the chart, you can see that for both the Financials and Industrials sectors, a number of stocks are very close to 52-week highs. For the Financials, 12 components are within 2% of a new high while 20 members of the Industrials sector are just within the 2% threshold as well. Start a two-week free trial to Bespoke Institutional for full access to some of the most sought after research on the street.
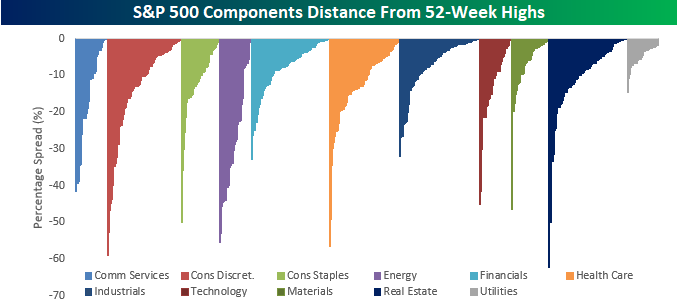
Chart of the Day: First All-Time Highs In Three Months
B.I.G. Tips — Alphabet (GOOGL) Loves Q3
Dividend Stock Spotlight: Tiffany & Co. (TIF)
This morning, LVMH, the owner of famous brands like Louis Vuitton, Sephora, Dom Perignon, and TAG Heuer, confirmed a bid to acquire yet another world-renown luxury brand: Tiffany & Co. (TIF). With the news of this bid, TIF’s stock is up over 30% for the largest one-day gain in the stock’s history. TIF has been no stranger to big price moves lately. Previously, its best single-day performance was on May 23rd of last year in response to an earnings triple play when the stock rallied 23.3%. Today’s rally brings the stock to levels not seen that massive rally last year and within 5% away from its all-time high that was put in place in July of 2018.
Given the surge in TIF, the dividend yield has been brought down quite a bit. On Friday, the stock yielded 2.35% which was above the yields of the S&P 500, Consumer Discretionary sector, and Retailing industry group. With the stock now yielding 1.83%, it’s payout is now less than all of these and even 2 basis points less than the yield of the ten-year US Treasury. With that said, the company has boosted its yield for 15 straight years, and the payout ratio of 51.5% is not a concern. Start a two-week free trial to Bespoke Institutional to access our Earnings Explorer, Security Analysis tool, and more.
