Negative Sentiment Turn
As markets have turned lower in the past week—shying away from their all-time highs—so too has bullish sentiment. Falling from 35.34% last week, 29.37% of investors in the AAII survey are now in the bullish camp. Giving up nearly all the gain from the past couple of weeks, bullish sentiment is now back to where it stood at the start of the month. This week also marked the eighth consecutive week that bullish sentiment has remained below its historical average. This week also was the 30th week (of 38 total) in 2019 that bullish sentiment was below its historical average.

As bullish sentiment fell, bearish sentiment is on the rise. The percentage of bearish investors rose 5.4 percentage points to 33.26% this week. After moving back below its historical average for the first time in six weeks last week, it is now above average, though not to any extreme degree.

While it did not rise as much as bearish sentiment, neutral sentiment also ticked higher this week by about half of one percent. Now at 37.37%, neutral sentiment has rebounded off its early August low and is the most elevated it has been since the first week of August when it was only 0.13 percentage points higher. The change in neutral sentiment over the past several weeks has now brought it back within the range that it has occupied most of this year. This week was also the third week in a row that neutral sentiment took the predominant share of sentiment. Start a two-week free trial to Bespoke Institutional to access our interactive economic indicators monitor and much more.

Looking for Action? S&P 1500 Most Volatile Stocks
For traders with a short-term time horizon who are looking for big moves, we have updated our list of the S&P 1500 stocks trading above $10 that have the largest intraday high-low ranges (based on the average percent spread between the intraday high and low over the last 50 days). The stocks are grouped based on whether they have a rising or falling 50-day moving average (DMA).
While the VIX remains relatively low, in recent months we have started to see some big moves in individual stocks and that can be seen in the fact that a number of stocks in the table below currently have average intraday ranges of more than 5%. The most volatile stock in the S&P 1500 is Lennox International (LII), which has had an average intraday high-low range of 9.5% over the last 50 trading days. Granted, it’s only an $11 stock, so the 9.5% average range works out to just about a dollar per day, but it is still volatile nonetheless. Behind LII, there are another three stocks with average daily moves of over 8%, but here again, they are all relatively low priced stocks trading at less than $20 per share. The highest-priced stock on the current list is Innovative Industrial Properties (IIPR). With a share price of $91 and an average daily move of over 5%, IIPR typically sees an intraday swing of over $5. That’s a trader’s dream if you trade it right, but a nightmare if you get it wrong!
In terms of sector representation on this month’s list, Consumer Discretionary is the most prevalent with 17 different stocks. Behind Discretionary, the next closest sector is Energy at eleven. Finally, with regards to the breakdown between stocks with rising and falling moving averages, there are modestly more stocks with falling moving averages (29) than rising moving averages (21), suggesting some underlying weakness even with the broader S&P 500 trading not far from new highs. Start a two-week free trial to Bespoke Institutional to access our interactive Chart Scanner and Trend Analyzer tools.

Chart of the Day: Equity Fund Flows Flying
Claims Tick Up Again, But It’s Not All Bad
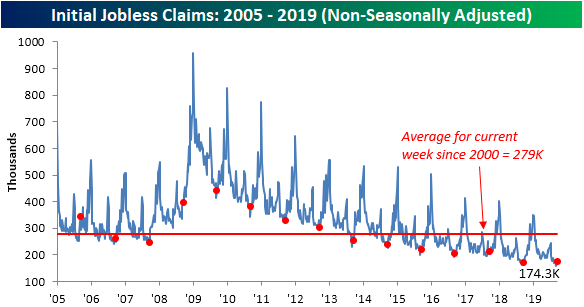
Initial jobless claims came in at their lowest level since April at the start of the month but have been grinding slightly higher ever since. Rising for the second week in a row, initial jobless claims now sit at 213K. Despite these modest increases, initial jobless claims remain at extremely healthy levels at the very low end of their historical range.

The four-week moving average which helps to smooth out some of the fluctuations of this high-frequency data fell once again this week. Now at 212K, the moving average has fallen for three consecutive weeks and is at its joint lowest (the week of July 26th also had a reading of 212K) level since April. Looking ahead to next week, assuming no large revisions or a significant uptick in next week’s data, the moving average could potentially drop again as the high of 219K from the final week of August rolls off the average.

Non-seasonally adjusted (NSA) claims also rose this week by 1.2K to 174.3K. This uptick was likely due to seasonal patterns given the current week of the year has averaged a 7.2K week-over-week increase this cycle. Not only was there a week-over-week increase which could have been expected, but there was also a year-over-year increase as has been the case for many weeks in 2019. NSA claims are now 1.4K higher than they were this time last year. While that is not necessarily a positive sign as it points to some moderation in the trend of improvement, we would like to note that 2017 also saw a YoY increase in the comparable week (38th week of the year) that was a much larger 14.5K. The following year, claims would go on to decline another 40.1K. So this week’s increase by no means indicates a reversal in the trend, especially considering the new cycle lows established only a few weeks ago. Additionally, while initial claims rose slightly, continuing claims fell, dropping to 1650K from 1661K. That is the lowest reading on continuing claims since October of last year. Start a two-week free trial to Bespoke Institutional to access our interactive economic indicators monitor and much more.
Bespoke’s Morning Lineup – 9/26/19
See what’s driving market performance around the world in today’s Morning Lineup. Bespoke’s Morning Lineup is the best way to start your trading day. Read it now by starting a two-week free trial to Bespoke Premium. CLICK HERE to learn more and start your free trial.

It’s been a lackluster several days for US equities as major indices have been treading water amid the political waves hitting the tape on a daily basis. Yesterday, stocks managed to buck the trend and the rally came right in time for the Nasdaq 100. After falling below its 50-DMA on Tuesday, the Nasdaq 100 looks to have successfully tested its uptrend line from the December lows. The Nasdaq 100 was also able to close back above its 50-DMA, but the lower high relative to July remains in place.

The Closer – Ukrainian Buyers, Big Fund Flows, Strong Home Sales – 9/25/19
Log-in here if you’re a member with access to the Closer.
Looking for deeper insight on markets? In tonight’s Closer sent to Bespoke Institutional clients, we begin with a recap of today’s market catalysts including the release of the transcript of President Trump’s call with the Ukrainian president. We also review this week’s ICI data which showed a massive inflow into domestic equity ETFs. In economic data, we finish with a look at new home sales and EIA data.

See today’s post-market Closer and everything else Bespoke publishes by starting a 14-day free trial to Bespoke Institutional today!
Chart of the Day: Telecom Technicals Looking Good
Housing Indicators Off the Charts
It has been a very strong couple of weeks for housing-related indicators as recent reports on Building Permits, Housing Starts, Existing Home Sales, and New Home Sales have all exceeded forecasts. Using data from our Economic Indicators Database, we found that it isn’t often that all four indicators come in better than expected in the same month. Going back to the start of 2006, there have only been 12 months in a total of 165 where all four indicators exceeded forecasts. While similar scenarios have been relatively uncommon in the past, more recently, we have seen an uptick in the number of occurrences. Of the 12 occurrences, six of them have occurred since the middle of 2016, and before that, there was a five year stretch without a single occurrence.

In addition to these four housing-related indicators all beating expectations this month, they have also done so by a wide margin. Of the four indicators we looked at, the reported readings exceeded consensus expectations by a total of 397K. The chart below shows the total spread between the actual readings in the four housing indicators noted and total expectations and have colored the months in red where the total spread was equal to or above this month’s total. Again, of the 165 prior months for which we have data on all four indicators, only five saw a higher spread between the actual reported readings and expectations. Between the positive breadth and the wide margins between the actual and estimated readings, strength of the type we saw in August housing data doesn’t come around too often. Start a two-week free trial to Bespoke Institutional to access our popular Earnings Explorer tool and our full Research Dashboard.

KB Home (KBH) Earnings After the Close
Homebuilder KB Home (KBH) is set to report earnings after the close today, and it looks to have a very high bar in terms of expectations given how much it has rallied over the last few weeks. With housing data coming in much better than expected over the last couple of months as mortgage rates have fallen, KBH is up 70% YTD and 15% this month alone. When a stock is trading at extreme overbought levels heading into an earnings report, it has a lot to live up to.
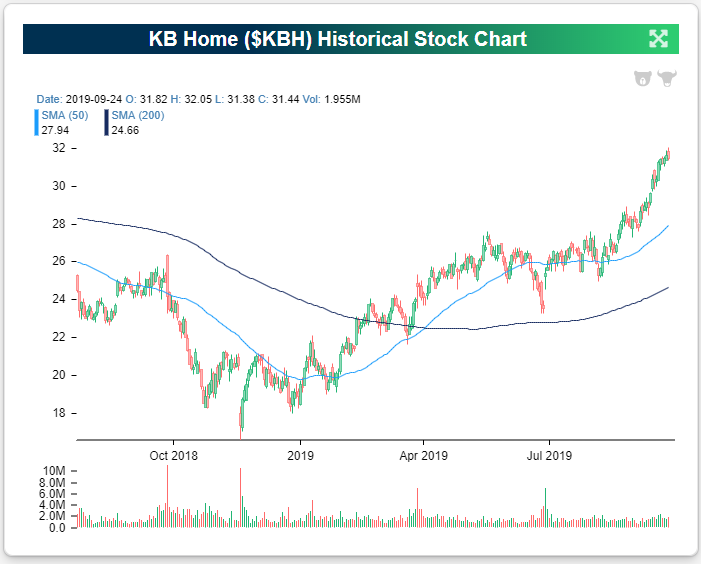
KBH has been an earnings beast over the last few years. Remarkably, the stock has opened higher on the first trading day following its last ten quarterly reports! You have to go back to KBH’s January 2017 report to find the last time the stock opened lower in reaction to earnings. This type of positive consistency in reaction to earnings cuts both ways. On the one hand, why fight the tape and bet against such a big earnings winner? On the other hand, KBH is certainly due for a clunker one of these quarters.
Our take would be to avoid being long this name into earnings tonight because of how extended it has gotten this month. As mentioned earlier, the stock has rallied 15% since the start of September, so we have to assume that most of the positives from tonight’s earnings release have already been priced into the stock. On the flip side, a failure to handily beat expectations would likely send KBH shares falling sharply back down to their normal trading range.Start a two-week free trial to Bespoke Institutional to access our popular Earnings Explorer tool and our full Research Dashboard.

Global Currency Breakdowns and Breakout
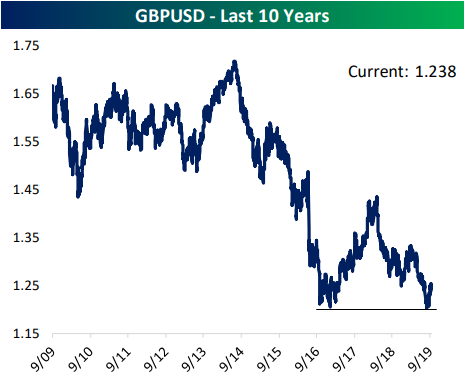
The British Pound (GBP) has had no shortage of catalysts in the past week given the recent developments in Brexit news—which we have been consistently covering in our Morning Lineup. Following yesterday’s decision from the UK’s Supreme Court, GBPUSD rose almost half a percent (stronger GBP), continuing the rally that has taken place over the past several weeks. That rally is off of a support level around the lows of the past decade near 1.2 that the pair first tested early last month and once again this month. Turning to today, yesterday’s move has been reversed and then some as the pound has weakened by more than 1%. Although the pair is still healthily above this support as of now, if declines continue—erasing the past few weeks’ moves higher—then GBPUSD could once again find itself within reach of ten-year lows.
Another one of the currency pairs of the 23 countries covered in our Global Macro Dashboard is showing a similar pattern to GBPUSD. As with the pound, the Australian dollar versus the US dollar has also weakened to support that was established several years ago. While GBP has managed to hold up at this support, AUDUSD has fallen through to its lowest levels of the past decade. In the past couple of weeks, the pair has come back to restest this support as resistance, but it failed to make a move higher indicating potential for more downside.

Meanwhile, the dollar has been strengthening against the Brazilian real. In fact, the dollar is nearing its strongest levels versus BRL of the past decade. Coming up near resistance around 4.2, USDBRL is forming a cup and handle pattern and is looking to break out higher.
Alongside these exchange rates, you can track the changes in several other countries and their global macroeconomic data using our Global Macro Dashboard. Start a two-week free trial to Bespoke Institutional to access our Global Macro Dashboard much more.
