The Closer – Small Cap Surge, Manufacturing Mumbo Jumbo, Trade Prices – 1/16/20
Log-in here if you’re a member with access to the Closer.
Looking for deeper insight on markets? In tonight’s Closer sent to Bespoke Institutional clients, we begin with a look at the recent outperformance of the small cap Russell 2000 and overbought conditions of the large cap S&P 500. Next, we show the differing performances of gold and silver over the past few months before turning to macroeconomic data including today’s releases of continuing jobless claims, manufacturing sentiment, and trade prices.

See today’s post-market Closer and everything else Bespoke publishes by starting a 14-day free trial to Bespoke Institutional today!
Chart of the Day: Market As Close To Targets As It Gets
Bulls Come Back
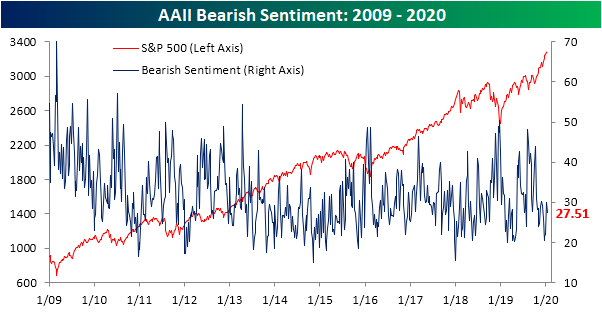
Even though equity markets shrugged off geopolitical tensions last week, sentiment actually declined based on AAII’s weekly survey. However, as equities have continued to move higher over the past week on solid earnings and the situation in the Middle East has further simmered down, sentiment has picked back up. This week, 41.83% of investors reported bullish sentiment, up from 33.07% last week. Although this only brings bullish sentiment to similar levels as the final week of 2019, that 8.76 percentage point increase this week was the largest weekly increase since mid-October. This also lifts it back above its historical average of 38.08%.

Even though bullish sentiment has surged, bearish sentiment was little changed at 27.5%; just 2.39 percentage points lower than last week. Thanks to the pick up in bullish sentiment, the bull spread has once again widened to 14.32 in the bull’s favor. Other sentiment readings like the Investors Intelligence survey similarly have seen stable bearish sentiment recently as bearish sentiment was unchanged at 17.8%.
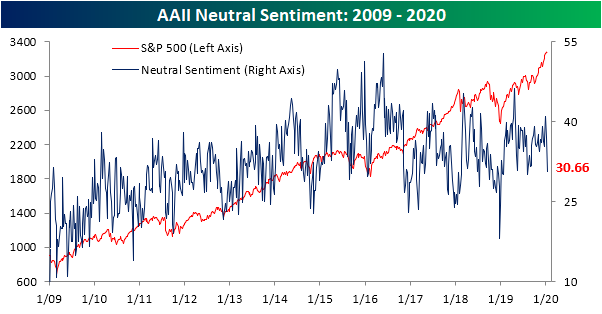
Considering most of the gains in bullish sentiment did not come from bears, neutral sentiment tanked to 30.66%. That is the largest weekly decline since August 8th when it fell 7.35 percentage points compared to the 6.38 percentage point drop this week. While it’s now at the lower end of the past year’s range, just two weeks ago neutral sentiment topped 40%. Declining 10.25% in that time, this was the first time that neutral sentiment experienced a double-digit drop in the span of two weeks since May. This drop has also snapped a 22-week streak that neutral sentiment has remained above its historical average. Going back through the history of the survey, there have only been five longer streaks, the next longest of which ended at 25 weeks in 2017. Start a two-week free trial to Bespoke Institutional to access our interactive economic indicators monitor and much more.
Homebuilder Sentiment Remains Strong
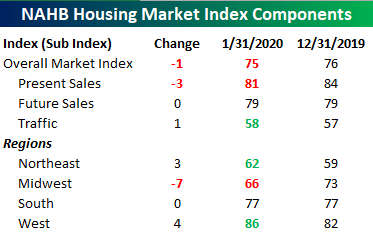
Homebuilder sentiment declined in January, but the drop came on the heels of a much stronger than expected December where overall confidence surged to the highest level in over 20 years. While economists were expecting the headline index to fall from 76 down to 74, the actual decline was just one point to 75. Even with this month’s decline, though, overall homebuilder sentiment is higher than all but four other months in the history of the index. With a strong economy and low-interest rates, how can you fault homebuilders for being positive?

Breaking out sentiment by sales trends and regions was a mixed picture. While Present Sales dipped, Traffic was actually higher which would seem to confirm reports that the Spring selling season is starting off early this year. On a regional basis, sentiment in the Midwest dropped sharply in January, but keep in mind that followed a monster surge in December. In fact, this month’s seven-point decline in sentiment for the region erased less than half of last month’s increase. Outside of the Midwest, sentiment in the South was unchanged (right near highs for the cycle), while the Northeast and West (also at cycle highs) both saw improved sentiment. Start a two-week free trial to Bespoke Institutional for complete access to all of our economic analysis.

Claims Come in Low
It’s been a little over a month since initial jobless claims reached their highest level since 2017 at 252K. Since that peak, jobless claims have fallen for five consecutive weeks for a total drop of 48K. That is the longest such streak since April of last year, and also the largest decline in claims during such a streak since October 2017 (55K). Now at 204K, jobless claims are the lowest they have been since the end of November when they dropped to 203K. Back at the low end of the past year’s range, claims have completely reversed the spike from just a few weeks ago. In order to take out the cycle low of 193K from last April, though, claims would also need to decline by another 11K.

The aforementioned peak of 252K shook up the picture for the labor market at the end of 2019 including the four-week moving average which typically helps to smooth out week to week fluctuations in the data. Fortunately, over the past couple of weeks, the data has moderated considerably. Last week was significant with regards to the moving average given that 252K peak had rolled off the average allowing it to experience its first decline in a month. That has continued this week as another recent high of 235K likewise came off the average to be replaced by this week’s much lower 204K print. While not as large as last week’s 9.5K decline, the moving average experienced another sharp decline of 7.75K to 216.25K.

All-in-all, the moving average has now fallen 17.25K off of its peak of 233.5K that was put in place just a couple of weeks ago. As shown in the chart below, the two-week decline in the moving average has been the largest since early October of 2017 even if the average itself is only at its lowest level since early November of last year.

As for the non-seasonally adjusted data, claims rose slightly from last week to 336.9K. As we have mentioned last week, the first couple weeks of the year typically put the annual peak in place. With claims slightly higher this week compared to last, the 336.9K print is likely to be this year’s high. If that is the case, this year’s peak would be 14K below last year’s and also down 7.6K YoY compared to the current week of the year last year. Start a two-week free trial to Bespoke Institutional to access our interactive economic indicators monitor and much more.

Bespoke’s Morning Lineup – 1/16/20 – Buckle Up For Economic Data
While the pace of earnings season doesn’t really pick up until next week and the week after, today is an uncharacteristically busy day for economic data with November Retail Sales, Jobless Claims, the Philly Fed Manufacturing report, and Import and Export Prices at 8:30. If that wasn’t enough, at 10:00 AM, we’ll have Business Inventories and Homebuilder Sentiment. So far, the results have been positive as the Philly Fed came in much better than expected, Jobless Claims fell all the way down to 204K, and Retail Sales were slightly better than expected. With numbers like these, it appears as though Target’s sales miss announced yesterday was more of a company-specific issue than anything else.
See what’s driving market performance around the world in today’s Morning Lineup. Bespoke’s Morning Lineup is the best way to start your trading day. Read it now by starting a two-week free trial to Bespoke Premium. CLICK HERE to learn more and start your free trial.

Possibilities Abound In Beige Book Bounce
The latest Beige Book data on qualitative economic conditions in the 13 Federal Reserve districts spread around the country was released yesterday. Our Beige Book Index counts the relative frequency of positive and negative terms used by the Beige Book in discussing the status of the economy and labor markets in each district. Generally speaking, this index correlates reasonably well with the growth of the economy, as shown in the chart below. The latest data suggests the possibility of a re-acceleration in growth in Q1 and Q2, though the index is definitely not recording the kind of strength it did at the peak for growth in 2018 and 2019. Sign up for Bespoke’s “2020” special at the Institutional level to get full access to Bespoke’s economic analysis like the Beige Book Index.
One worrying observation was “job cuts or reduced hiring” at manufacturers in “a number” of districts; that would be consistent with the sudden decline in factory hiring in December per the most recent payrolls numbers. A paradox was also visible in the claim of “widespread labor shortages” despite “modest or moderate” wage increases; how can labor be truly scarce if its price isn’t rising briskly? Business contacts did note “solid” holiday spending along with “strengthened” residential markets and “moderately” expanded vehicle sales. All-told, the Beige Book signaled an improved pace of growth but by no means a dramatic acceleration in activity.
Lots Of Businesses, Not So Many Jobs
The US Census has started releasing an experimental data set that shows the quarterly rate of new business start-ups based on tax filing data. As shown in the chart below, while the total number of businesses started in the US reached a record in the fourth quarter of 2019, they did so thanks entirely to applications which did not include planned wage outlays. In other words, most new businesses don’t plan to immediately employ people, which is part of the explanation of weaker business dynamism in the United States. Instead of businesses starting up and immediately ramping up, the vast majority of new businesses don’t actually hire workers. In short, there are a lot of businesses being started, but they’re on average having a much smaller impact than has historically been the case. Get access to all of Bespoke’s research with a two-week free trial to Bespoke Institutional. You won’t be disappointed!
The Closer – Banking On Earnings, PPI Pause, Beige Book, Business Starts – 1/15/20
Log-in here if you’re a member with access to the Closer.
Looking for deeper insight on markets? In tonight’s Closer sent to Bespoke Institutional clients, we begin with a look at analyst earnings estimates which have been on the rise before reviewing returns on equity and credit markets for banks. Next, we review today’s release of PPI and update our Beige Book index. We then take a look at census data on business start ups. We close out tonight with our weekly look at EIA data.
See today’s post-market Closer and everything else Bespoke publishes by starting a 14-day free trial to Bespoke Institutional today!
The Largest Stocks Weigh Heavy on the S&P 500
There has been plenty of chatter recently concerning the impact of the largest stocks in the S&P 500 on the broader index. As shown in the chart below, 2020 began with the market caps of Apple (AAPL), Microsoft (MSFT), Alphabet (GOOGL), Amazon (AMZN), and Facebook (FB) totaling 17.3% of the S&P 500’s total market cap. Since at least 1990, that is the largest percentage of total market cap that has been taken up by the top five stocks at the start of the year. The only other year with the top five stocks holding a comparably high weighting is 2000 when it was 17%. That year the five stocks that held the highest share of total S&P 500 market cap were Microsoft (MSFT), General Electric (GE), Cisco (CSCO), Walmart (WMT), and Intel (INTC). While MSFT is the only one to have stayed on this list for all but one year (2001) since then, GE currently has fallen to the 66th largest stock in the index, CSCO the 27th, WMT is the 10th largest, and INTC is the 18th largest. Start a two-week free trial to Bespoke Institutional to access our full library of research and interactive tools.
