Bears Still Outweigh Bulls
Although the S&P 500 is up around 1% over the past week with the index clearing the technical hurdle of the early June highs around 3,230, sentiment has shifted lower. Just last week, AAII’s reading on bullish sentiment rose above 30% for the first time in four weeks. That didn’t hold as bullish sentiment fell to 26.06% this week.

While the percentage of investors reporting as bullish fell, there was only a small increase in the number of investors reporting as pessimistic. 46.83% of respondents reported bearish sentiment; a 1.46 percentage point increase from last week. That is the smallest change on an absolute basis for bearish sentiment since the final week of June while marking the highest level of bearish sentiment since the same week.

That means neutral sentiment saw the biggest move of the three as it gained 3.32 percentage points. Now at 27.11%, neutral sentiment is making its way back up to its recent highs above 30%, though it is still in the bottom 18% of all readings since the beginning of the survey in 1987.

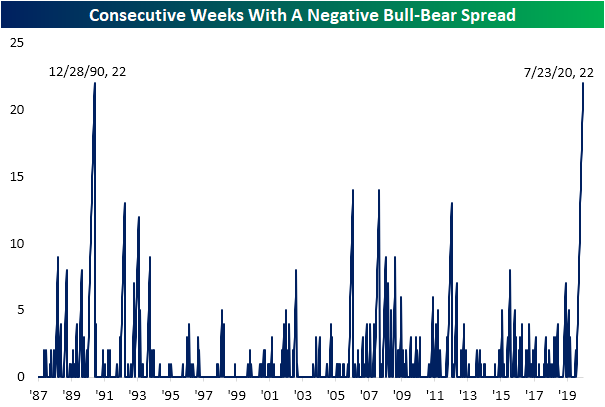
Although there were no major shifts in sentiment readings this week, there was one significant development. Tipping back below -20 this week, every week since the last week of February has seen a negative bull-bear spread(a higher share of survey respondents report as bearish than bullish). At 22 consecutive weeks long, that ties another streak that came to an end in the final week of 1990 for the longest stretch on record in which bears have outweighed bulls. While it is too small of a sample size to put much weight on it, the S&P 500 was higher by 14% six months out from the end of that last streak. Click here to view Bespoke’s premium membership options for our best research available.

Nuance of Jobless Claims
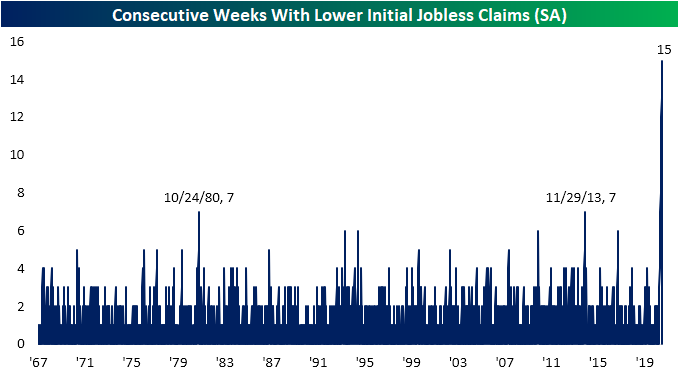
Seasonally adjusted jobless claims have been consistently declining since their peak on March 27th. In fact, up until this week, claims had fallen for a record 15 consecutive weeks. That more than doubled the previous record streaks that ended at seven weeks long in 2013 and 1980.
This week’s 1.416 initial jobless claims reading was not only the first time claims have risen on a week over week basis since March, but they also came in above expectations. Given the degree of improvement has been small in recent weeks, the 109K increase means that initial jobless claims have now given up all of the declines since the week of June 19th.
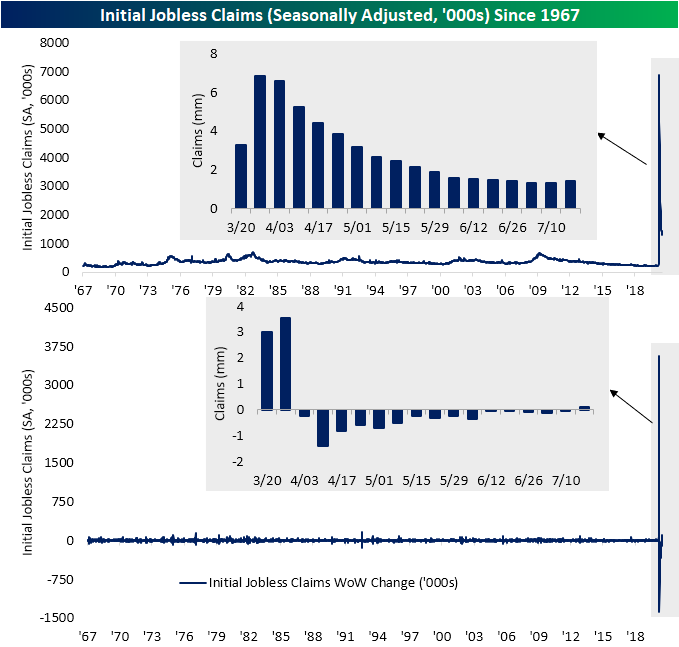
While the seasonally adjusted number makes for a worsening picture, claims appear a bit better when looking at the unadjusted number. After an uptick last week, on a non-seasonally adjusted basis, claims were actually lower this week falling to 1.371 million from 1.513 million last week. That was actually the largest week over week decline since the last week of May.

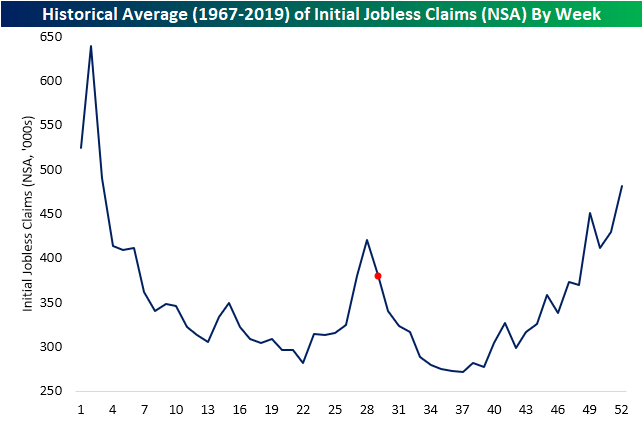
While that is an improvement, we would be hesitant to give this too much weight. While seasonal effects may be a bit diluted this year given other bigger factors, they are in play nonetheless and last week’s increase as well as this week’s decline are prime examples of this effect. In the chart below we show the average reading for claims for each week of the year from 1967 through last year. As shown, last week (the 28th of the year) has typically marked a seasonal peak for jobless claims with the current week (red dot in the chart below) marking the initial decline off that seasonal peak which is similar to what has been observed in recent weeks. In other words, the past couple of week’s moves at least in part appear to be a result of seasonality.
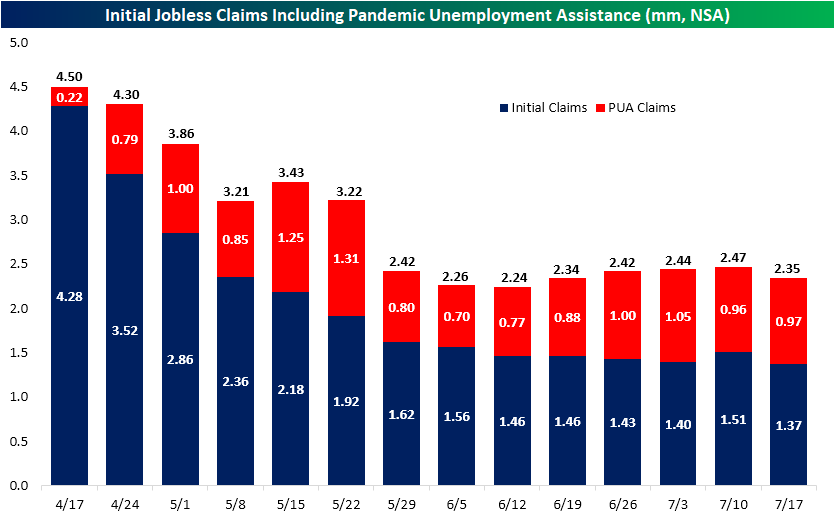
When including Pandemic Unemployment Assistance (which are non seasonally adjusted), it is more of the same with total claims lower than last week. That snapped a four-week streak of increases, but again,those past few weeks’ increases are consistent with the historical seasonal pattern for this time of year.
As for continuing claims, which are lagged an extra week, the declines continued with this week marking a seventh consecutive decline. Continuing claims dropped 1.107 million to 16.197 million. This week was the largest decline of those seven weeks with the only larger decline being a 4.071 million drop in mid-May.
Additionally, albeit lagged an additional week in the most recent data, continuing claims have also fallen when factoring in PUA claims. Total continuing claims (non-seasonally adjusted) for the week of July 3rd has dropped for two weeks in a row down to 30.5 million. Click here to view Bespoke’s premium membership options for our best research available.
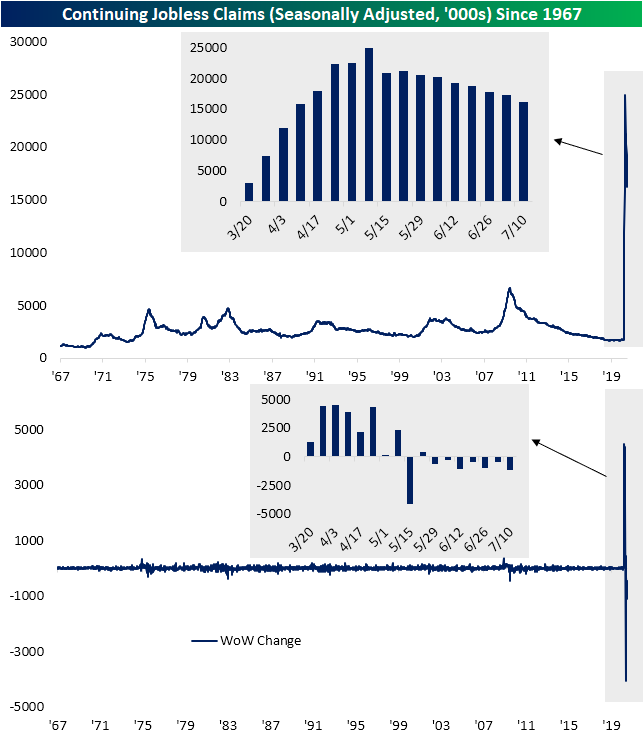
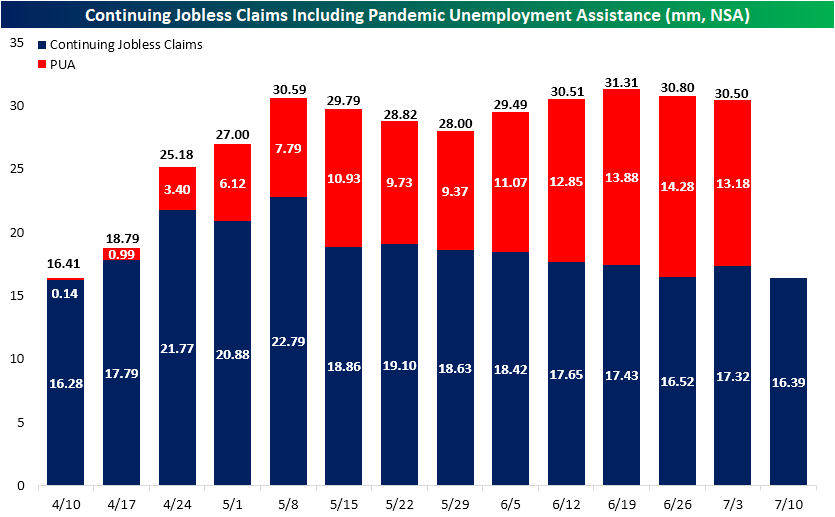
Chart of the Day: The Myth of Robinhood
Bespoke’s Morning Lineup – 7/23/20 – Funk-Less Nasdaq
See what’s driving market performance around the world in today’s Morning Lineup. Bespoke’s Morning Lineup is the best way to start your trading day. Read it now by starting a two-week free trial to Bespoke Premium. CLICK HERE to learn more and start your free trial.
Futures started to rally ahead of the European open, and have given up some of those gains as we head into the trading day. The key stock to watch today will be Microsoft (MSFT), which despite positive earnings is trading lower in the pre-market. The stock had a strong run leading into the earnings report, so it’s understandable that investors took profits, but we’ll have to watch to see if this type of reaction to earnings becomes a trend.
Be sure to check out today’s Morning Lineup for a rundown of the latest stock-specific news of note, key earnings news in Europe and the US, global economic data, trends related to the COVID-19 outbreak, and much more.

Whenever the market strings together daily declines, it’s often referred to as being in a funk. In the case of the Nasdaq, though, the last two months have been ‘funk-free’. With yesterday’s gain, the Nasdaq has now gone 48 trading days without seeing back to back declines. In the entire history of the Nasdaq dating back to 1971, this current streak is now tied for the longest streak of all-time. Not only that but because yesterday was positive, the current streak is guaranteed to go at least another trading day.

Bespoke CNBC Appearance (7/22)
Bespoke co-founder Paul Hickey appeared on CNBC’s Squawk Box on Wednesday morning to discuss the Technology sector heading into earnings season. To view the segment, click on the image below.

Chart of the Day: Tesla (TSLA) and the Biggest Dot Com Winners
Downed Dollar
Falling another 0.35% today, the Bloomberg US Dollar Index is notching its fourth consecutive day with a decline. Over the past four days, the greenback has fallen 1.38% which was the worst four-day stretch since the first days of June. Not only is that resulting in the US Dollar Index reaching extremely oversold levels as it currently sits 2.25% from its 50-DMA, but it also now sits at a critical technical level. Before rocketing up to a record high on March 23rd, on March 9th the dollar index found a bottom at 1190.98. That is around similar levels to the mid-December 2019 and just above December 31st, 2019 lows. With today’s decline, the dollar index has now dropped 8.17% from the March high, marking a full round trip from its pre-COVID spike. Click here to view Bespoke’s premium membership options for our best research available.

Triple Plays Triple
In yesterday’s Chart of the Day, we highlighted one of the most recent earnings triple plays, Prologis (PLD), as well as the other three triple plays so far this earnings season as of yesterday morning. A stock reports an Earnings Triple Play when it beats consensus analyst EPS estimates, beats revenue estimates, and raises forward guidance. These can typically be considered the cream of the crop for companies reporting earnings as they not only show fundamental strength, but also see strong stock price reactions on earning days. As the earnings calendar continuously ramps up, another 54 companies reported since yesterday’s close and the number of triple plays has nearly tripled. There were seven triple plays since yesterday’s close bringing the total for this earnings season from four to eleven.
Below we show the charts of the stocks that have reported a Triple Play last night and this morning. Teradyne (TER) and Texas Instruments (TXN) were both out yesterday after the close. For Teradyne, EPS was 30 cents above analyst forecasts of $1.03 while revenues came in at $839 million versus forecasts of $755.5 million. TXN beat EPS by 27 cents. The company reported sales of $3.239 billion versus estimates of $2.952 billion. Both companies raised guidance for sales and EPS. Despite those strong earnings, both stocks are trading lower today as they sit just off of 52-week highs. For TXN, that turn lower marks a false break out above levels from earlier this year.
This morning’s triple plays include fiber optic cable manufacturer Amphenol (APL), industrial products conglomerate Dover (DOV), health information technology stock IQVIA (IQV), consumer packaged goods company Silgan (SLGN), and one of the US’s largest trucking companies Knight-Swift (KNX). Unlike TXN and TER, none of these stocks are trading lower and SLGN is up the most with a 7.56% gain as of this writing. This was SLGN’s first-ever triple play with EPS of $0.85 vs $0.64 estimates and revenues ~$55 million above estimates. That has sent SLGN surging to fresh 52-week highs. APH, DOV, and IQV are not quite there yet but they too are approaching resistance with help from earnings today. KNX on the other hand is in the middle of a strong uptrend since the March lows.
One other interesting thing to note, even though these companies are all reporting strong earnings in relation to estimates, most are not reporting growth from last year. Of the eleven triple plays we have seen so far this earnings season, there are only four—Taiwan Semi (TSM), Prologis (PLD), Silgan (SLGN), and Teradyne (TER)—that have reported revenues higher than one year ago. Click here to stay updated on upcoming earnings triple plays and receive actionable research on everything else related to financial markets.

Silver Gets the Gold for YTD Performance
In last night’s Closer, we took a look at the massive rallies of late in the precious metals space. Gold (GLD) reached its highest level since 2011, but silver’s (SLV) performance on the day was even more of a sight to behold with gains in the top 1% of all days since SLV began trading in 2006. Silver (SLV) rose 6.15% for its best day since March 24th when the metal rose 7.96%. Whereas the silver to gold ratio has been in a constant downtrend over the past decade (indicating underperformance of silver relative to gold), yesterday’s big gains led to a breakout of this downtrend. With SLV trading higher by over 5% yet again this morning, that downtrend is being broken even more significantly, and that is even with SLV off the pre-market highs above $21.

As recently as the final days of June, SLV was actually sitting on a loss year to date. That was a far cry from the performance of some of the best-performing assets of the year at the time like the Tech heavy Nasdaq 100 (QQQ) which was up over 14% and the long term Treasuries ETF (TLT) which was up over 21.5%. Silver’s yellow cousin, gold, was likewise sitting on a sizeable gain of 16.6%. Pivot ahead to today and the picture is very different. Around this morning’s premarket highs when SLV was trading above $21, it actually topped QQQ, TLT, and GLD as the best performing asset in 2020. That is even with each of these other ETFs also trading higher. Click here to view Bespoke’s premium membership options for our best research available.

Bespoke’s Morning Lineup – 7/22/20 – Less Value in Growth
See what’s driving market performance around the world in today’s Morning Lineup. Bespoke’s Morning Lineup is the best way to start your trading day. Read it now by starting a two-week free trial to Bespoke Premium. CLICK HERE to learn more and start your free trial.
Futures are mixed this morning but off their overnight lows following the US closure of the Chinese consulate in Houston. Data flow is quiet this morning, but the pace of action is going to pick up substantially with earnings after the close from Microsoft (MSFT) and Tesla (TSLA) among others. The big question will be whether or not these companies can live up to the higher expectations that have been building up in the weeks leading up to these reports.
Be sure to check out today’s Morning Lineup for a rundown of the latest stock-specific news of note, key earnings news in Europe and the US, global economic data, trends related to the COVID-19 outbreak, and much more.
With each passing day, as growth stocks seemingly move in one direction (higher) and value stocks remain stagnant and drift lower, the spread in performance between the two investment strategies continues to widen. In the 100 trading days through Monday, the S&P 500 Growth index was up over 14% while the S&P 500 Value index declined 8% for a spread of 22.5 percentage points. When was the last time the spread got that wide? Well, never since at least 1996.
The chart below shows the rolling 100-trading day spread between the performance of the S&P 500 Growth and Value indices going back to 1996. Prior to Monday, the record spread between the two indices was 22.1 percentage points which was reached during the dot-com boom in December 1999. Besides that period, the only time the spread was even close to current levels was in March 2009 when it topped 17 percentage points. In other words, the last two times the performance spread between the S&P 500 Value and Growth indices was anywhere close to as wide as it is now represented one of the worst and the best entry points for the broader market in the last 25 years. Make sense of that.
