NSA Jobless Claims Finally Drop Below One Million
The first initial jobless claims release of August was a welcome surprise ahead of tomorrow’s Nonfarm Payrolls report. Seasonally adjusted claims came in at 1.186 million which was the lowest level since the start of the pandemic albeit still indicating over 1 million people filed a jobless claim for the first time. That has now been the case for 20 straight weeks. That was a 249K drop from last week as well which was the largest week over week decline for initial claims since the first week of June.
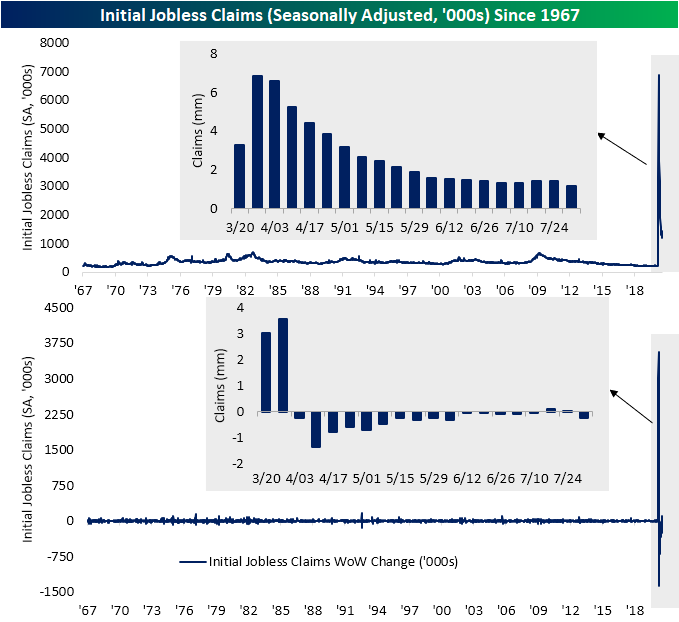
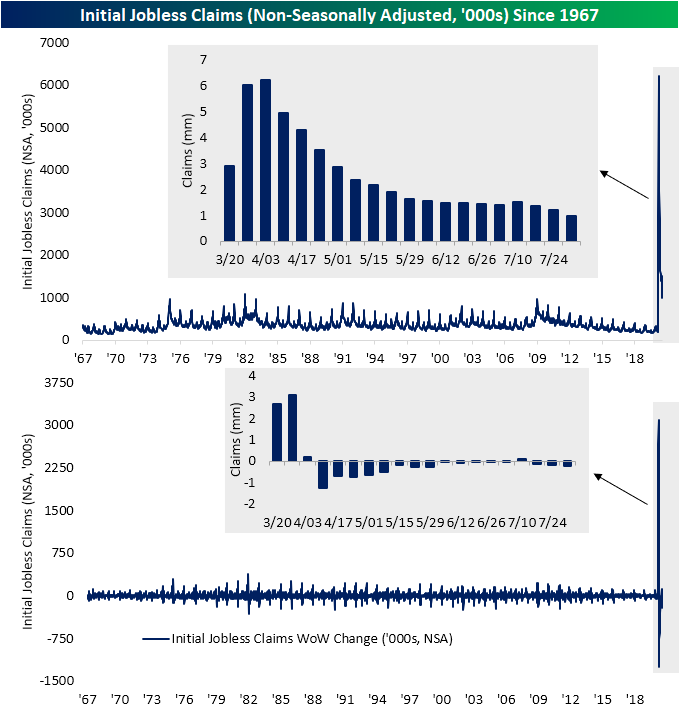
On a non-seasonally adjusted basis, it was an even more welcome reading as claims were actually below 1 million for the first time since mid-March. The 222K drop from last week down to 984K also marked yet another acceleration in the WoW declines as well (169.9K drop last week and 135.9K decline the prior week). As we have noted in recent weeks, seasonality is likely in part a factor for the stronger NSA numbers as claims have had a tendency to fall during the summer months (July through September), but fewer people filing for claims is a good sign regardless.
Last week was the first time continuing claims rose in nearly two months, but the entire 800K increase has been reversed and then some this week as continuing claims fell back down to 16.107 million. That is the lowest reading since April 10th when continuing claims stood at 15.819 million.
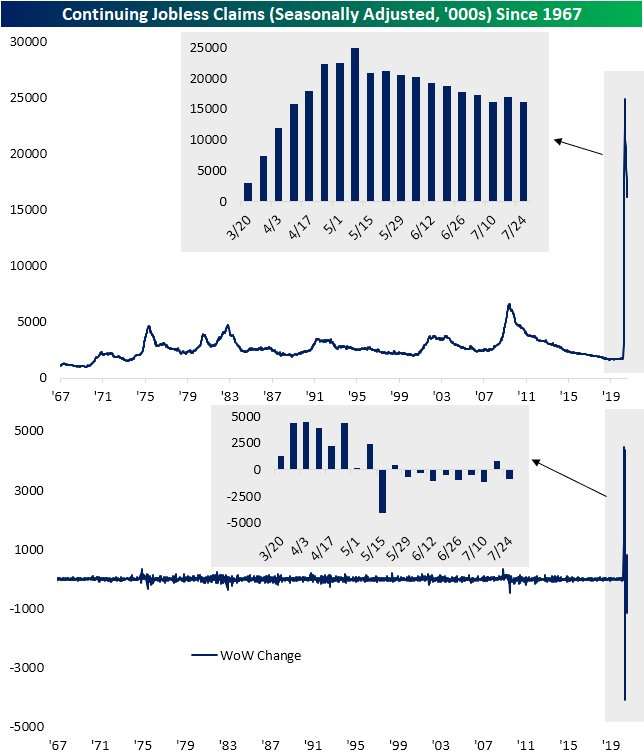
Whereas in recent weeks the addition of Pandemic Unemployment Assitance claims have made the overall picture look better or worse, this week the story matches up with the headline number. The number of PUA claims filed fell by more than a quarter WoW coming in at 655.7K. That is the lowest amount since tracking first began back in mid-April. While they are lagged an additional week and likely will not echo that improvement for another couple of weeks, continuing claims including PUA claims continued to hover around 30 million for the most recent week of data (the week of July 17th). All in all, seasonality aside, it was a very strong week for jobless claims. Click here to view Bespoke’s premium membership options for our best research available.

Chart of the Day – Obama and Trump: Two Peas in a Pod
Services Soaring
Following Monday’s release of the ISM’s Manufacturing report for July, this morning the service counterpart was released. The report showed activity in the service sector continued to pick up with the headline number rising to 58.1 from 57.1 last month and expectations for a reading of 55.0. This month’s reading was the highest since February 2019 (58.5) and represented the first back to back expansionary readings (above 50) since February and March. That is also the highest level of the index since February of 2019 when it was at 58.5.
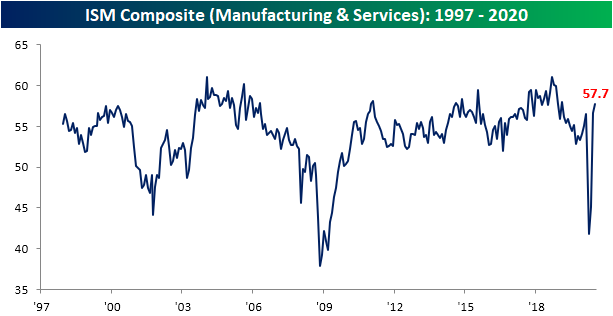
Much of the same applies to the combined reading of the service and manufacturing indices. With both the service and manufacturing readings rising in July, the composite of the two has now risen to 57.7; a second straight month of expansionary readings. That is also the strongest level of the composite since a reading of 58 in February 2019. For both the service and composite indices, the massive reversals higher since each ones’ respective low in April has also marked the biggest 3-month upticks on record. In other words, the broad economy is no longer contracting and continued to improve month over month in both June and July.

While the headline number was improved and most of the individual categories showed expansionary readings in July, not every index rose. There were only three sub-indices to swing higher in July: Business Activity, New Orders, and Backlog Orders. Every other one was lower with the indices for Employment and Export and Import orders even showing contractionary readings. Granted, with some nuance, not all of those declines are necessarily negatives for the economy. For example, the lower reading in Supplier Deliveries indicates that supply chains are normalizing as lead times become shorter. Additionally, the big drop in inventories indicates moderation in the massive inventory builds of the past few months.

While some areas of the survey fell MoM with a few even dipping into contractionary territory, the index for Business Activity was far from one of them. The index rose to 67.2 which is the highest reading on record outside of January of 2004 when it was just 0.5 points higher.

Part of that renewed outlook for business activity is thanks surging demand. In fact, the New Orders index surged 6.1 points (the ninth largest MoM increase on record) in July to a record high of 67.7. That means service sector businesses in July reported a record improvement in demand from the prior month. With an increase in New Orders, orders that were already in place are beginning to stack up. The index for Order Backlogs rose 4 points to 55.9. That is the highest reading since March of last year.


Whereas the past few months saw huge inventory builds as a result of plummeting demand, improved demand has led to a reversal of this in July. The index for inventories fell 8.7 points in July to 52. That was the second-largest MoM decline on record behind a 12.4 point drop back in March.

As previously mentioned, the decline in some areas of the survey like Inventories and Supplier Deliveries could actually be viewed as a positive. One area that does not apply is the index for employment which remains the weakest category of the service sector. After a substantial rebound last month (the biggest MoM increase on record), the Employment index reversed lower falling to 42.1 in July. While that is a small move relative to the past few months, it indicates further contractions in employment. July marked a fifth straight month in which Employment was in contraction. That’s the longest such streak since one that lasted from May of 2008 to June of 2010. Similar to the manufacturing index, while it could mean a reversal in the month ahead, at the moment that weak reading for the labor market stands in stark contrast with the improved demand picture.

As for the commentary section, it provided a bit more insight into employment as well as other areas. One comment noted the trend of remote work stating that roughly 95% of the company’s workforce is working remotely while another noted virtual meetings and the likes remain the norm. Another made mention that they were beginning to bring employees back to the workplace. With regards to demand, one company in the Utilities industry reported conditions appear to be at levels from before COVID-19. Meanwhile, one comment from the Construction industry reported strength in homebuilding which not only backs up recent macroeconomic data but should also bode well for that industry’s stocks. Click here to view Bespoke’s premium membership options for our best research available.

Big Moves Off 52-Week Lows
Within the US equity market, we’ve seen some major moves in individual stocks off their 52-week lows over the last few months. Look at the table below. Within the Russell 1000, which tracks the performance of the largest companies in the US, stocks in the index are up an average of 87.6% from their respective 52-week lows. Looking at performance by individual sectors, stocks in the Energy sector are up an average of 136.8%, while the average Consumer Discretionary stock has rallied 131.4%. The Technology sector wasn’t hit nearly as hard by the Covid-crash as other sectors, but stocks in the sector have doubled on an average basis relative to their 52-week lows. The only sector where stocks are up less than 50% on an average basis from their 52-week lows is Utilities at 46.33%.

For many investors, the holy grail of stock picking is the proverbial ten-bagger. A ten-bagger is a stock that multiplies by ten times its original price. Usually, this happens over the span of years, but in the Covid-economy, we’ve actually seen a number of these ten-baggers play out in the span of months. While most of these examples are in the small-cap space, shares of Wayfair (W), which has a current market cap of $27.5 billion, have rallied from $21.70 on March 19th to its current price of $290.85 now. That’s a gain of more than 1,200% in less than five months!
Within the entire Russell 1,000, 257 stocks have at least doubled off their 52-week lows, and in the table below we highlight the 34 stocks that are at least a quarter of the way to the ten-bagger club and have rallied more than 250%. As mentioned above, W tops the list, but Fastly (FSLY), which has barely been public for a year, is just shy of the club with a gain of 992%. Behind FSLY, Livongo Health (LVGO) is up 855%. Given that LVGO just got a takeover offer from Teladoc (TDOC), the 11th best-performing stock on the list, it may only make the ten-bagger club under the banner of the TDOC ticker.
In looking through the list of stocks shown, many of these names come from the Health Care, Technology, and Consumer Discretionary sectors and have been direct beneficiaries of the new Covid-economy. At the same time, six stocks from the Energy sector made the list as well as they recovered from their bombed-out levels after oil prices briefly traded in negative territory earlier this year. Like what you see? Click here to view Bespoke’s premium membership options for our best research available.

Chart of the Day: Aerovironment Flying High
Bespoke Market Calendar — August 2020
Please click the image below to view our August 2020 market calendar. This calendar includes the S&P 500’s average percentage change and average intraday chart pattern for each trading day during the upcoming month. It also includes market holidays and options expiration dates plus the dates of key economic indicator releases. Start a two-week free trial to one of Bespoke’s three research levels.

Chart of the Day: Analysts Playing Catch-Up
Bespoke Matrix of Economic Indicators – 8/3/20
Our Matrix of Economic Indicators is the perfect summary analysis of the US economy’s momentum. We combine trends across the dozens and dozens of economic indicators in various categories like manufacturing, employment, housing, the consumer, and inflation to provide a directional overview of the economy.
To access our newest Matrix of Economic Indicators, start a two-week free trial to either Bespoke Premium or Bespoke Institutional now!

Production Popping Without People
This morning’s ISM report on the manufacturing sector indicated continued improvements in the month of July. July’s rise in the headline number to 54.2 from 52.6 marked back to back months with expansionary readings for the first time since January and February of this year. It was also a third consecutive month in which the index has risen. That leaves it at its highest level since March of last year.

Most of the sub-indices of the report are likewise now showing expansionary readings. As shown below, most indices have seen continued improvements with the increases in July being in the upper quartile of historic readings; many of these were actually in the upper decile. Nearly every index is now showing expansionary readings with Backlog Orders, Export Orders, and Import Orders all rising above 50 in July. At the moment, the only indices to remain in contraction are those for inventories and employment. These are also at the lower end of their historical ranges. For the indices for inventories, the contractionary readings are not necessarily a glaring negative though as they come off of expansionary readings (rising inventories) in recent months.

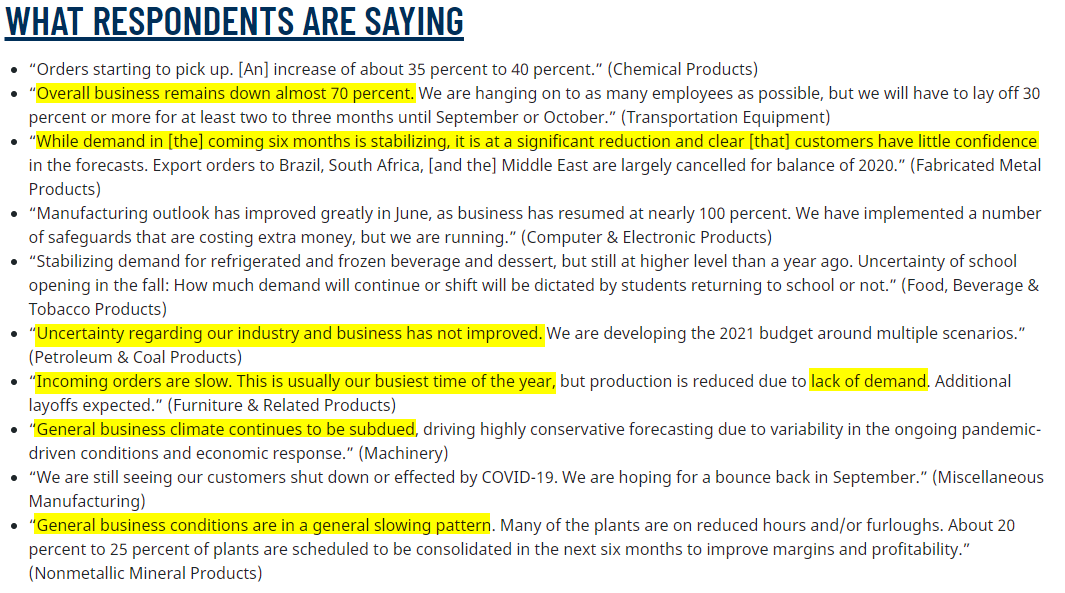
Although the numbers are providing a fairly optimistic outlook for the country’s manufacturing sector, more anecdotally, the comments in this month’s survey had a decent amount of negativity. As shown below, several comments made mention that even if improved, demand is still down dramatically and uncertainty remains higher. On the other hand, some respondents like one from the Computer & Electronic Products industry and the Food, Beverage, & Tobacco Products industry are reporting that demand has either returned to normal or is better than a year ago.
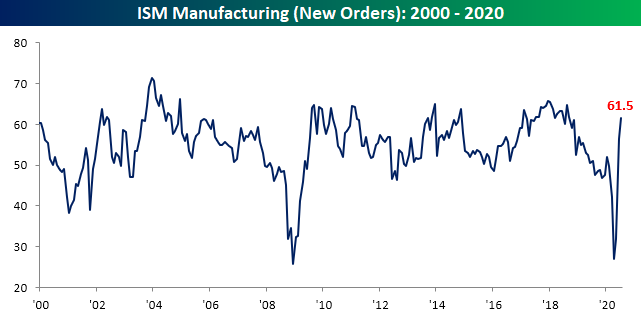
Increased demand, and as a result increased production, has been a major boost to the headline number. As shown below, the index for New Orders saw another huge increase in July rising 5.1 points to 61.5. Excluding last month’s extreme rise of 24.6 points, which was the largest monthly gain on record, you would have to go all the way back to July of 2013 to find another time that the index for New Orders rose by more. That leaves the index at its highest level since September 2018 while the index for Production is at its highest level since August 2018. Those improved conditions also appear to be fairly broad with 13 of the 18 industries surveyed reporting growth in new orders and 16 of the 18 reporting growth in production; no industry reported a decrease in production in July.

Stronger demand certainly seems to be the reason for that higher production. Over the past two months, inventories have been building as demand was bouncing back. This month’s reading of 47 indicated that reversed as inventories began to be drawn upon. Meanwhile, as New Orders pickup, order backlogs are rising for the first time since February. That was the only other month since April of last year in which order backlogs were rising. The index for Backlog Orders is now at its highest level since April of 2019.


Although production and demand has picked up, employment has been left behind. In other words, businesses appear to be ramping up output without the help of additional labor. Granted, that could change as production continues to pick up. Of the 18 manufacturing indices, ten reported a decrease in employment (again many of these also reported an increase in production) while only five reported growth: Apparel, Printing and Related Support Activities, Furniture, Plastic and Rubber, and Computer and Electronic Products. While improved from the past few months, the index for employment remains low at 44.3. Click here to view Bespoke’s premium membership options for our best research available.


Bespoke’s Morning Lineup – 8/3/20 – They Know Nothing!
See what’s driving market performance around the world in today’s Morning Lineup. Bespoke’s Morning Lineup is the best way to start your trading day. Read it now by starting a two-week free trial to Bespoke Premium. CLICK HERE to learn more and start your free trial.
Quote of the Day: “I have talked to the heads of almost every single one of these firms in the last 72 hours, and Ben Bernanke has no idea what it’s like out there. None. And Former St. Louis Fed. President Bill Poole has no idea what it’s like out there. My people have been in this game for 25 years and they’re losing their jobs, and these firms are going to go out of business, and he’s nuts! They’re nuts! They know nothing! … This is a different kind of market, and the Fed is asleep.” – Jim Cramer 8/3/07
We’ve got no cases of “the Mondays” to deal with this morning as US equity futures have been rallying all morning and trade near their highs of the session on positive economic data out of Europe (first expansionary manufacturing PMI reading in 18 months) and a slowing of Covid cases in the US. The S&P 500 is poised to open at levels it hasn’t traded at since 2/24, while the Nasdaq is indicated to open up just under 1%. That may sound like a good move for the Nasdaq, but keep in mind that the index has rallied more than 1% on seven of the last eight Mondays. That’s impressive!
Be sure to check out today’s Morning Lineup for a rundown of the latest stock-specific news of note, key earnings and economic news in Europe and the US, trends related to the COVID-19 outbreak, and much more.

The Fed may have been asleep back in August 2007, but they have gone out of their way to not make the same mistake this time around. The floodgates have been busted wide open with liquidity. At the time of Jim Cramer’s rant thirteen years ago today, the Fed Funds rate was over 5%. Today, it’s not only at zero, but the Fed has been actively purchasing government, agency, and corporate debt. The Fed of 13 years ago was downright prudish compared to the Fed today.
Cramer’s rant also came right near the market peak and was quickly followed by one of the largest equity drawdowns in US stock market history. By March 2009, the S&P 500 was down more than 50% as much in the way of personal retirement savings, many banks and corporations, and the entire financial system were nearly wiped out.
In the stock market, though, time often acts as the best elixir. It took four years for investors to get back to even from the time of Cramer’s now-famous comments. Longer-term, though, investors have been rewarded for staying the course. Through last Friday, the S&P 500 was up just under 200% versus where it was 13 years ago, and on an annualized basis, that works out to over 8.5%.
