Seasonal Volatility Just Getting Started
The market’s day-to-day volatility has picked up in September after experiencing more stable trading action during the summer months. This is not out of the ordinary. Historically, the most volatile time of the year for stocks has been between September and early November. You can see this in the chart below that shows the average absolute daily percentage change for each trading day of the year beginning on the first trading day of January through the last trading day of December. As shown, daily volatility is very consistent around the +/-0.70% level over the first eight months of the year, but then it starts to pick up beginning in September until it reaches a peak during the first week or two of November. From there, the holiday season takes over and daily volatility plummets right through the end of the year. As shown in the chart, unfortunately we’ve still got a ways to go to get to the top of the volatility mountain, so make sure you’ve got your climbing gear ready for the next six to eight weeks! Click here to start a free trial to Bespoke to unlock full access to all of our research and interactive tools.

No Love for Triple Plays
Long-term readers of Bespoke know that we follow closely stocks that report earnings triple plays. An earnings triple play occurs when a company releases quarterly numbers that 1) beat consensus EPS estimates, 2) beat consensus sales estimates, and 3) raise forward guidance. Go check out the definition of a “triple play” on Investopedia.com (which they’ve given us credit for) if you’d like to read more.
An earnings triple play is usually met with significant buying from investors. Our Earnings Explorer tool contains the quarterly results of nearly every US stock that has reported earnings over the last twenty years. At the tool — which is available to Bespoke Institutional members — users can filter the entire database to find all historical earnings triple plays that have occurred since 2000. We used the tool to find all triple plays over the last ten years, and the summary results from the tool are provided in the snapshot below.
As shown, there have been 4,914 earnings triple plays in the US over the last ten years. On average, these triple plays have seen their share prices rise by 5.63% on their earnings reaction days (the first trading day following the triple play). That’s a significant one-day gain, but it’s also commensurate with the strong earnings report that accompanied it.

The reason we’re bringing up earnings triple plays and their normal upside price reaction is because the ones we’ve seen so far in September have come up woefully short. So far this month, there have been twelve earnings triple plays, and these stocks have averaged a one-day decline of 3.26% on their earnings reaction days. Remember, usually triple plays see a gain of more than 5% on their earnings reaction days. This month, not only are triple plays not averaging gains…they’re actually selling off sharply.
Below is a snapshot of the twelve earnings triple plays we’ve seen this month. You’ll notice that quite a few are some of the most well-known high-fliers of 2020 like DocuSign (DOCU), Peloton (PTON), Chewy (CHWY), and CrowdStrike (CRWD). None of these four managed to post gains in reaction to their earnings triple plays.
From the looks of it, it appears that a lot of the upside earnings strength that companies are showing is already priced into shares before the actual news hits the tape. Click here to start a free trial to Bespoke to unlock full access to all of our research and interactive tools.

Keeping Tabs On High Frequency Growth
The week ended September 11th showed a sharp decline in our index of weekly GDP versus the year before. As shown, our index can be quite volatile, but it does do a decent job tracking the general trajectory of GDP. Since peaking at an implied growth rate of +0.9% YoY on July 10th, our index has slid to -2% YoY, the lowest reading since mid-June.

Taking a look at another tracker of short-term economic growth, below we show Weekly Economic Index data updated by the New York Fed each week. After decelerating sequentially YoY for the week ended September 4th, the WEI reported sequential YoY growth slower once again in the week ended September 11th. We also show what each high frequency tracker implies about quarterly growth. As shown, our tracker has consistently implied a higher quarterly growth rate than the Weekly Economic Index, and official data for the last two quarters. That said, Q3 is tracking at least 20%, with upside to the high-20s as the US continues to rebound from COVID. This post was originally published in our post-market macro report — The Closer — last night. Click here to start a free trial to Bespoke Institutional and receive our nightly Closer for the next two weeks, featuring more commentary and data on macro markets.

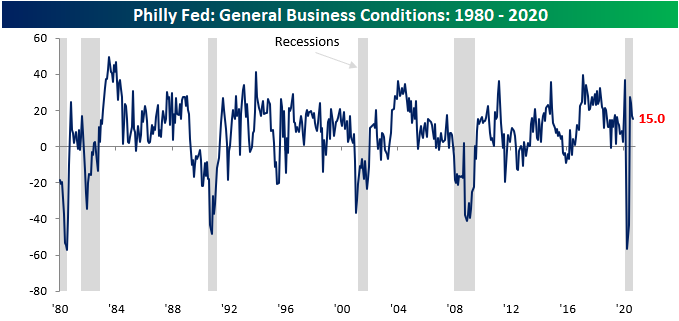
Philly Fed Flat
Unlike its neighbor to the north, the Philadelphia Fed Manufacturing Report lost a bit of steam in September. Economists were expecting the headline index of General Business conditions to remain unchanged at 17.5, but the actual level showed a modest decline to 15.0. Nothing to get alarmed about, but still weaker than expected. Even at current levels, though, it’s worth pointing out that September’s reading was still above the predominant levels we were seeing in the year leading up to the COVID outbreak.
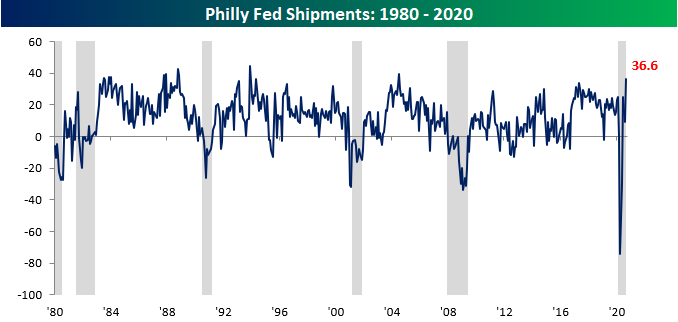
Breadth in this month’s report was also positive. Besides the index of General Business Conditions, the only other indices that declined on a m/m basis were Inventories and Average Workweek. On the upside, the biggest gains were seen in Shipments and Prices Paid. In the case of Shipments, its current level now ranks in the 98th percentile of all prior readings while Delivery Times are also elevated in the 96th percentile of all other periods.

This month’s surge in shipments also ranks as the highest level in over 16 years (July 2004), and that comes just six months after the lowest reading on record.
Finally, in the report’s special questions this month, respondents were asked how Q3 production will compare to Q2, and the responses were positive. 22.2% of those surveyed expect production to increase by more than 10% while just 11.1% expect business to contract by more than 10%. While these results bode well for Q3, the outlook for Q4 doesn’t look as great. Only 6.7% of respondents expect Q4 production to increase significantly while 11.1% expect activity to decline by a ‘significant’ margin. In a trend that doesn’t bode well for the current high levels of unemployment, of those expecting activity to increase, only 17% plan to accomplish this by hiring additional staff. The rest plan to either increase productivity, the hours of current staff, or other measures. Click here to start a free trial to Bespoke to unlock full access to all of our research and interactive tools.
Bullish Sentiment Bounces
With the S&P 500 rallying in the first two days of the week and early on Wednesday, bullish sentiment on the part of individual investors saw a sizable uptick over the last week. According to the latest weekly survey from the American Association of Individual Investors (AAII), bullish sentiment increased from 23.71% last week to 32.02%. That 8.31 percentage point increase was tied for the largest weekly increase since January 16th but only marks a three-week high in optimism.

With the big move into the bullish camp, there was an exodus of equal magnitude from the bears as negative sentiment fell from 48.45% down to 40.39%. The last time bearish sentiment dropped that much in a week was on February 13th just before the Q1 stock market peak. Similar to bullish sentiment but in the opposite direction, though, bearish sentiment was actually lower four weeks ago.

Even after the shifts in sentiment this week, though, the bull-bear spread remains negative at 8.34 percentage points.
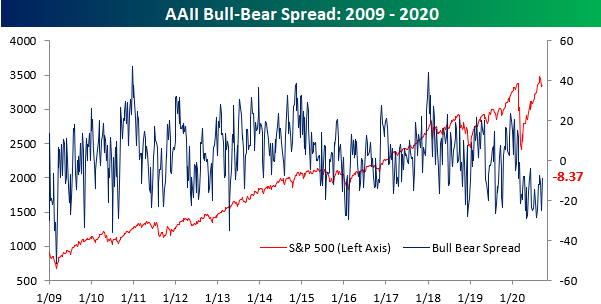
This week’s bull-bear spread now takes the current record streak of negative sentiment readings to 30 which is eight weeks longer than the prior record reading of 22 weeks back in late 1990. It’s been well-documented that the sample of this survey tends to skew bearish, but 30 weeks is a long streak! Click here to start a free trial to Bespoke to unlock full access to all of our research and interactive tools.

Chart of the Day: Rent-A-Center (RCII)
Chart of the Day: Homebuilders
Homebuilder Sentiment Soars
Homebuilders had nothing to complain about in recent months, as the National Association of Homebuilders (NAHB) sentiment index was already tied for its best levels on record. Today’s release of the September update surpassed all expectations. While economists were forecasting the headline index to come in at a level of 78, the actual reading was five points higher at 83. Never before has the homebuilder sentiment index topped 80, let alone moved as high as 83. If this sentiment survey was a stock chart, technicians would consider it a textbook breakout.
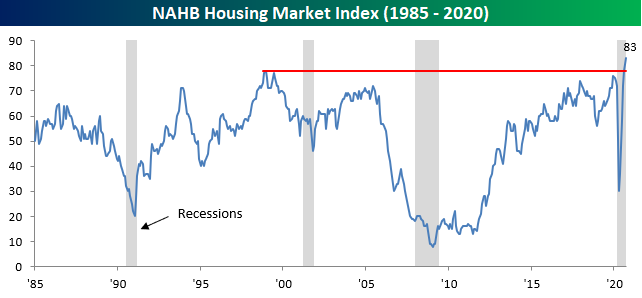
The internals of this month’s report were also very strong. Both Present and Future sales as well as Traffic all surged to record highs, and on a regional basis, every region except the West increased. The decline in the West likely stems from the fires in California, but even with that decline, all four regions are now comfortably back above their pre-COVID levels. Click here to start a free trial to Bespoke to unlock full access to all of our research and interactive tools.


The Lights are on North of Broadway
New York City may still be closed for the most part, and the lights are still out on Broadway, but factories across the state are open for business. In the latest release of the Empire Manufacturing report for the New York region, the headline index of general business conditions rose from 3.7 up to 17.0 which was a full ten points above consensus forecasts. What’s very encouraging about these readings is that in the case of both current conditions and expectations, the levels for September are higher now than they were pre-COVID. Despite concerns that the running off of Federal relief programs was going to cause a sharp slowdown in activity, that hasn’t shown up in the Empire Manufacturing report as of yet.

In the early days of the COVID pandemic, manufacturers’ sentiment for present conditions dropped much more than their expectations for the future. In April, the spread between Expectations and Current Conditions was as wide as it has ever been. As businesses have come back online, though, things have moved back into a more normal range. In fact, the current spread of 30.60 is pretty much right in line with its historical average (30.1). That’s a great indication of how quickly certain parts of the economy have been able to adjust and adapt to the new reality.

Breadth in this month’s report was also fantastic. Every component of the Current Conditions part of the report improved relative to August, and just two of the components in the Expectations part (Delivery Times and Prices Received) declined. The biggest improvement came in the Average Workweek, while Number of Employees saw the smallest increase. That suggests that rather than hiring new workers, employers are getting more out of their current workforces. Not necessarily great for the jobs outlook.

Plans for Capital Expenditures and Technology Spending also increased in September. After dropping to their lowest levels since the Financial Crisis earlier this year, the rebound in both indices has been nearly as swift as the pullback. While current levels are still below where they were pre-COVID, the pace of recovery has never been sharper. The economy may still be far from normal, but things have bounced back a lot faster than many were thinking a few months ago. Click here to start a free trial to Bespoke to unlock full access to all of our research and interactive tools.

The US Now Exports More Energy Than It Imports
Yesterday the Energy Information Agency released their monthly snapshot of energy markets data for the United States. Much of the data is somewhat lagged; the data discussed in this post is only updated through May.
Our first chart highlights the huge shift away from coal and towards natural gas as an energy source, driven by both regulation and the economics of fracking. Also notable is the growth of wind and solar energy; solar especially is having an incredible year as production has risen an astounding 140% annualized in 2020.
The other recent shift in the domestic energy market is the COVID-driven plunge in petroleum share of total energy output. In April, petroleum fell below one-third of total US energy consumption as driving activity plunged. Obviously, this is very short-term and will rebound, but the growth of renewables and natural gas amidst the decline of coal will continue, unlike shorter-term trends like the highest share of nuclear power consumption on record.

We also wanted to highlight the energy trade balance. Historically, the US has imported vastly more energy than it has produced, but the massive expansion of domestic oil and natural gas production has reversed that precedent entirely.
As shown below, the US went from importing 2.5 trillion more BTUs of energy than it produced back in 2006 to exporting more energy than it imports beginning in August of last year. “Energy independence” isn’t a realistic or helpful goal, because large gross trade flows can increase efficiency, but on a net basis, the US has now been energy independent for about a year. This post was originally published in our post-market macro report — The Closer — on 9/14/20. Click here to start a free trial to Bespoke Institutional and receive our nightly Closer for the next two weeks, featuring more commentary and data on macro markets.
