Bespoke Matrix of Economic Indicators – 11/30/20
Our Matrix of Economic Indicators is the perfect summary analysis of the US economy’s momentum. We combine trends across the dozens and dozens of economic indicators in various categories like manufacturing, employment, housing, the consumer, and inflation to provide a directional overview of the economy.
To access our newest Matrix of Economic Indicators, start a two-week free trial to either Bespoke Premium or Bespoke Institutional now!
Copper Outshines Gold But For How Long?
Megas Not Pulling Their Weight
We’ve become conditioned over the last couple of years to look to the mega-cap stocks of Apple (AAPL), Microsoft (MSFT), Amazon.com (AMZN), Alphabet (GOOGL), and Facebook (FB) to not only top the list of largest stocks, but also the best performers. The month of November has been a different story, though. Through Friday, the S&P 500 was up an impressive 11.3% on the month, but the equal-weight index (which weights each stock the same) was up a much more impressive 15.4%. Going back to 1990, this November’s performance of the S&P 500 Equal-Weight Index ranks as the second-best of the last thirty years only trailing the 18.6% gain in April 2009.
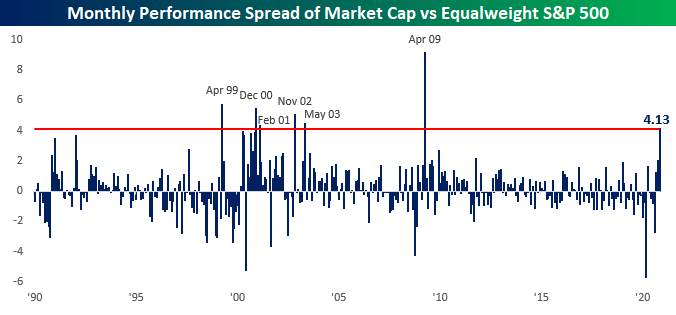
In addition to being one of the best months for the S&P 500 Equal Weight Index in terms of absolute performance, this month is also on pace to be one of the best months for the index relative to the market-cap weighted index as well. At the current level of 4.13 percentage points (chart below), this November will be the best performance for the Equal Weight Index relative to the Market Cap Weighted index since April 2009. Besides April 2009, which was just after the lows of the Financial Crisis, the only other months where the performance gap was wider were in five months spanning April 1999 through May 2003.
In terms of top-performing S&P 500 stocks this month, there have been a lot of winners. In the entire index, only 40 stocks are down month to date, and only nine of those are down more than 5%. The table below lists the 27 stocks in the S&P 500 that have rallied more than 40% so far this month. The top six stocks listed, as well as a number of others, come from the Energy sectors. Besides beaten-down stocks from the Energy sector, most of the stocks listed come from other sectors, like cruises, air travel, and lodging that have been battered by the pandemic. Five stocks you won’t find on the list, though, are the FAAMG stocks mentioned above. While all five stocks are in the black for the month, none of them are even up 10%. Slackers.
One last observation is that even after gaining at least 40% in November, 25 of the 27 stocks listed below are all still down YTD, and most of them by a lot. The only two stocks that are now positive YTD are Albermarle (ALB) and DISH Network (DISH). Even after taking into account this month’s gains, the average YTD change of the 27 stocks listed is a decline of 32.1%. Click here to view Bespoke’s premium membership options for our best research available.

Bespoke Brunch Reads: 11/29/20
Welcome to Bespoke Brunch Reads — a linkfest of the favorite things we read over the past week. The links are mostly market related, but there are some other interesting subjects covered as well. We hope you enjoy the food for thought as a supplement to the research we provide you during the week.
While you’re here, join Bespoke Premium with a 30-day free trial!
Regulation
Coinbase Will Suspend All Margin Trading Tomorrow, Citing CFTC Guidance by Nikhilesh De (Coindesk)
Thanks to new CFTC guidance that limits the ability of exchanges to liquidate crypto holdings on margin calls, one of the largest exchanges is shutting down margin trading. [Link]
Illegal Tampering by Diesel Pickup Owners Is Worsening Pollution, E.P.A. Says by Coral Davenport (NYT)
Off-the-shelf devices marketed as improving performance in pick-up trucks have been creating massive amounts of pollution by altering settings on truck engines to bring them out of compliance with EPA regulations. [Link; soft paywall]
COVID Changes
People are working longer hours during the pandemic (The Economist)
Evidence is mounting that all the time saved by working from home instead of commuting during the pandemic has been eaten up by more time working. [Link]
The extra mile: how Covid-19 transformed exercise by Laura Noonan (FT)
People seeking any possible escape from the drudgery of the pandemic – and being locked into repetitive routines – have led to a revolution in the way they engage in fitness. [Link; paywall]
Innovation
Microsoft’s Creepy New ‘Productivity Score’ Gamifies Workplace Surveillance by Alyse Stanley (Gizmodo)
Microsoft has built a dense suite of surveillance and reporting tools into newer versions of its ubiquitous workplace software, prompting concerns that the company will be directing how workplaces evolve in addition to attacking employees’ privacy. [Link]
From Culinary Dud To Stud: How Dutch Plant Breeders Built Our Brussels Sprouts Boom by Dan Charles (NPR)
It’s not just your imagination: brussels sprouts used to be much worse. Selective breeding efforts in the 1990s led to the modern delectable crunch of greenery. [Link]
Citations
CDC director cites this website to back in-school learning. Its designer calls that ‘bananas’ by Maggie Fox (CNN)
An unofficial tracker for COVID infections in schools is being cited by policymakers. The only problem? It creator has backpedaled sharply, suggesting that the data is not meant for the sort of analysis it is being used for. [Link]
Development
Pushed by Pandemic, Amazon Goes on a Hiring Spree Without Equal by Karen Weise (NYT)
Amazon has added almost half a million workers in less than a year, roughly 50% of the company’s total global workforce. [Link; soft paywall]
10 new skyscrapers about to transform the Toronto skyline by Tanya Mok (blogTO)
Don’t look now, but Canada’s largest city is getting a lot taller. A series of extremely high buildings are starting to take shape, and will fundamentally alter the huge city’s skyline. [Link]
Read Bespoke’s most actionable market research by joining Bespoke Premium today! Get started here.
Have a great weekend!
Sector Weights Rising and Falling
For most of the past year, one significant trend on a sector by sector basis has been the outperformance of sectors like Technology and Consumer Discretionary. The relative strength lines of these sectors have consistently shown outperformance versus the rest of the S&P 500 as a whole, but since August, other sectors have begun to take the wheel. As we noted in today’s Sector Snapshot, just about every sector has had a banner month in November with some of the biggest month to date rallies of the past 30 years, but some sectors have seen much larger returns than others. One of the best examples of this has been Energy which has risen over 35% in November. Similarly, Financials has risen an astounding 19.5% this month compared to more modest but still significant rallies of around 10% from Tech and Consumer Discretionary. Given those large degrees of outperformance, the relative strength lines of Energy and Financials have taken a sharp turn higher in recent weeks. Similarly, they have seen a turnaround in their weightings in the S&P 500 as shown in the charts below.
Over the past three months, the Financial sector has gained a full percentage point weighting while the Technology sector has lost 1.36 percentage points with a decline in weighting in three straight months. For Financials, that is the largest gain in weighting in a three month span since January 2017. For Tech, outside of the reshuffling in 2018 that saw a large share of its weight change into Communication Services, the last time the sector lost this much or more in weighting in three months was November of 2008. Prior to this recent string of losing weight over the past three months, Tech had seen weight gain in every month from October of last year through August. Even though the weight loss has been significant, it has only put a dent in the increased share of the entirety of the past year as the sector’s weight is only back down to where it was in May.
Similarly, looking at the other sectors, while Financials have added a full percentage point in share over the past few months, that follows nine months of declines running from last December through August. That brings the sector’s weighting back above 10% in the S&P 500, but that is only at the highest level since March. Similarly, Materials and Industrials have also seen their weights rise for three and four months in a row, respectively. As for Energy, the 0.44 percentage point gain in November is set to snap six straight months of declines; the longest such streak since at least 1990. As with Financials, that turn around this month has only put a dent in the longer term trend of weight loss as Energy’s weighting is now only back to its highest level since July. Opposite of Energy, Consumer Discretionary is on pace to lose weight for the first time since March. Click here to view Bespoke’s premium membership options for our best research available.

Home Prices Surge Across the Country
The S&P/Case-Shiller home price indices were updated (through September) recently, and below we provide a number of tables and charts breaking down the data. As shown in the table below, we’ve seen a huge surge in home prices pretty much across the country on both a month-over-month and year-over-year basis. Phoenix, San Diego, Boston, and New York saw the biggest month-over-month jump in prices, while Phoenix, Seattle, and San Diego are up the most year-over-year. At the national level, home prices are now up just under 7% year-over-year.

The chart below shows where home prices are now versus their low points at the depth of the housing bust during the mid to late 2000s. Nationally, prices are now up ~70% from their lows, while five cities are up more than 100% — San Francisco, Las Vegas, Phoenix, Seattle, and Portland. San Diego, Atlanta, and Denver are just a slight uptick away from the 100%+ level as well. At the bottom end of the chart is New York which is up just 34% from its lows.

Along with looking at where home prices are now relative to their prior lows, below we show where prices are versus their highs at the peak of the housing boom of the mid-2000s. Of the 19 cities shown, 13 have now seen home prices eclipse their prior highs. Denver and Dallas are the farthest above their prior highs at 60%+. The six cities that have yet to get back to prior highs are Washington DC, New York, Phoenix, Miami, Chicago, and Las Vegas. Las Vegas is the farthest from its prior highs at -13%.

Below we show home price levels by city using S&P/Case-Shiller’s data. Cities highlighted in green are at new highs. The Tampa area is the most recent to make a new high above its prior peak in 2006. Click here to see Bespoke’s premium membership options and start a free trial for instant access to our research and interactive tools.
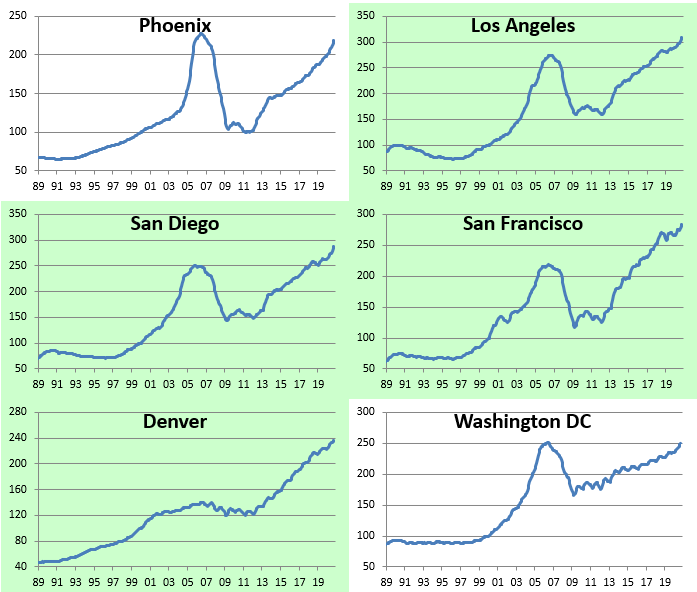
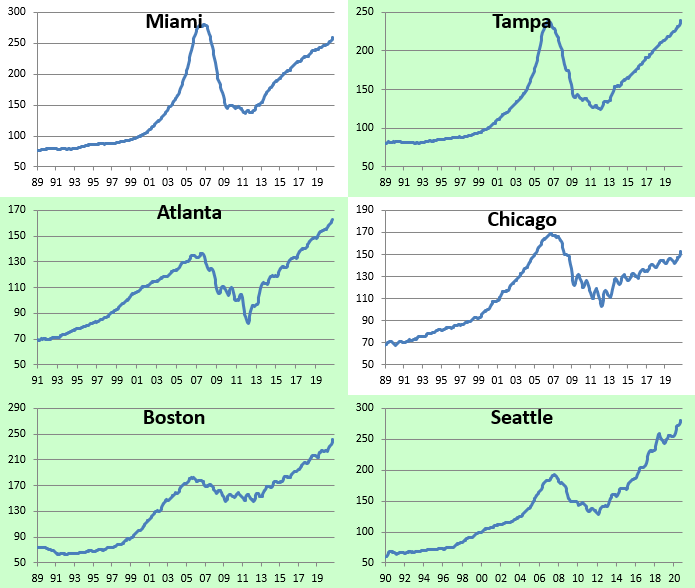
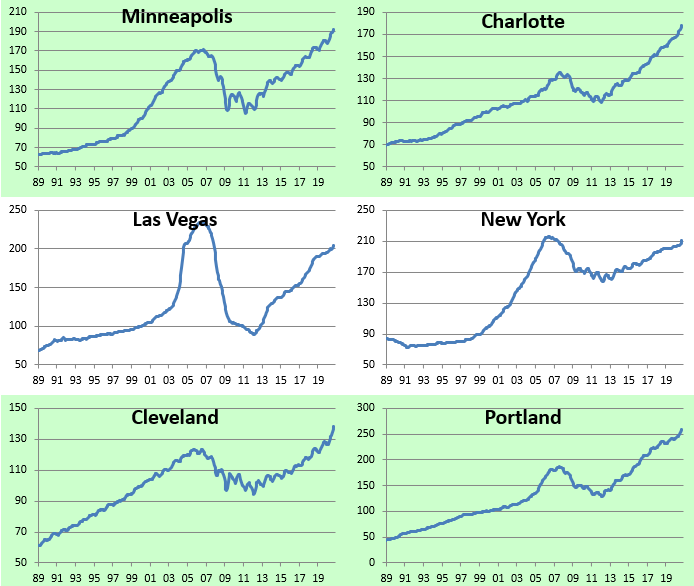

Chart of the Day: APAC Breaks Out
Bespoke’s Morning Lineup – 11/27/20 – Tap Tap Tap
See what’s driving market performance around the world in today’s Morning Lineup. Bespoke’s Morning Lineup is the best way to start your trading day. Read it now by starting a two-week free trial to Bespoke Premium. CLICK HERE to learn more and start your free trial.
“I love to talk about nothing. It’s the only thing I know anything about.” – Oscar Wilde
Is this thing on? Just in case there’s anyone out there this morning, US equity futures are trading modestly higher this morning as trading resumes for three and a half hours before the weekend. Newsflow in US markets is incredibly quiet this morning with nothing in the way of economic data or earnings reports and very little in the way of analyst actions or corporate headlines to speak of.
Be sure to check out today’s Morning Lineup for updates on the latest market news and events, economic data out of Europe, an update on the latest national and international COVID trends, and much more.

Of all the financial assets in the world, one that never sleeps is bitcoin. And while you were enjoying your turkey yesterday, bitcoin was getting pummeled with prices declining just under 10%. Even after that large of a drop, though, bitcoin currently trades where it was in mid-November and still remains well above its 200-DMA and above the up-trending channel it broke out of at the start of November. Would you believe that even after yesterday’s takedown, bitcoin prices are still up over 20% MTD?

Declines of yesterday’s magnitude aren’t particularly out of the ordinary throughout bitcoin’s history. This year alone, there have been two other one-day declines of a larger magnitude, and since the start of 2017, there have been 24 larger one-day drops.

Most and Least Heavily Shorted Stocks in the S&P 500
Over the past several months, short interest has gradually headed lower. On a median basis, short interest as a percentage of float for stocks in the S&P 500 is just 1.71%. That compares to 2.16% in mid-February, just a few days below the equity market’s peak prior to the bear market. On a sector basis, short interest as a percentage of the float is generally lower for almost every sector now than it was back in February. For some sectors like Industrials and Communication Services, the differences between now and then are dramatic. But short interest has not declined for every sector. Both the Real Estate and Energy sectors currently have higher median short interest readings than they did earlier this year, and in the Energy sector, the median short interest has increased nearly a full percentage point.
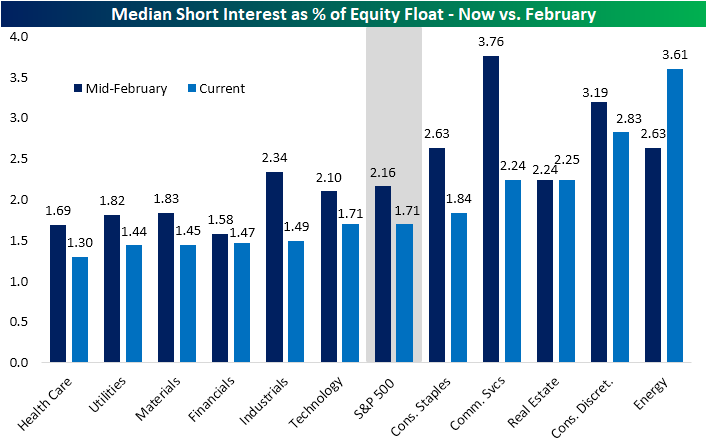
Despite the Energy sector boasting the highest median reading, on an individual stock basis, not a single Energy name finds itself on the list of the 25 S&P 500 stocks with the highest short interest. In fact, the Energy stock with the most elevated reading is Marathon Oil (MRO) at just 6.7%; which ranks 42nd in the S&P 500. While the beaten-down sector does not have any representation in the top 25 list, the list is mostly comprised of companies that have similarly been battered by COVID-19. Stocks related to the reopening trade like travel, airlines, and retail dominate this list. While these high readings of short interest indicate a large number of investors betting against these names, from a contrarian perspective, they are names that could be susceptible to a short squeeze.
Looking at the inverse, most of the 25 stocks in the S&P 500 with the lowest short interest as a percentage of float are made up of stocks that have held up better this year. There are some big large-cap names like Apple (AAPL) and Microsoft (MSFT) as well as some names that have seen their business boom since the pandemic began such as Home Depot (HD) and Costco (COST). The sector with the lowest median short interest as a percent of float, Health Care, is also well represented with 8 of the 25 stocks finding their way onto the list. Click here to view Bespoke’s premium membership options for our best research available.
