Bulls Stay in Charge
As equities have continued to trend higher in the past week, sentiment has modestly improved across various indicators. Overall, sentiment remains in favor of bulls but not to any sort of extreme. For starters, the most recent reading of the National Association of Active Investment Managers’ (NAAIM) Exposure Index rose to the highest level since mid-June. Meanwhile, the Investors Intelligence survey of equity newsletter writers saw bullish sentiment rise to 56.4%, the highest in a month, and bearish sentiment fall to 15.9%, the lowest in a month. The AAII’s weekly survey saw similar results. The reading on bullish sentiment rose 0.9 percentage points to 37% this week. That is the highest level since the week of July 8th, but that is still a percentage point below the historical average and is also below most readings observed this year.

While bullish sentiment was higher, bearish sentiment was little changed falling just 0.2 percentage points to 31.5%. Pulling back only slightly, bearish sentiment continues to be elevated relative to the past several months’ readings. It is currently ~1 percentage point above the historical average.

The moves in bullish and bearish sentiment mean the bull-bear spread rose slightly in favor of bulls. The spread rose from 4.4 last week to 5.5 this week.

Neutral sentiment matched bearish sentiment at 31.5%. That was down slightly from 32.2% last week and is right back in line with the historical average. Click here to view Bespoke’s premium membership options.

More New Lows for Claims
Initial jobless claims matched expectations at 375K this week. That is a 12K decline from last week’s upwardly revised level of 387K (originally 385K) while also marking the third week in a row in which initial claims have fallen. Additionally, that brings claims to the lowest level since the start of the pandemic.
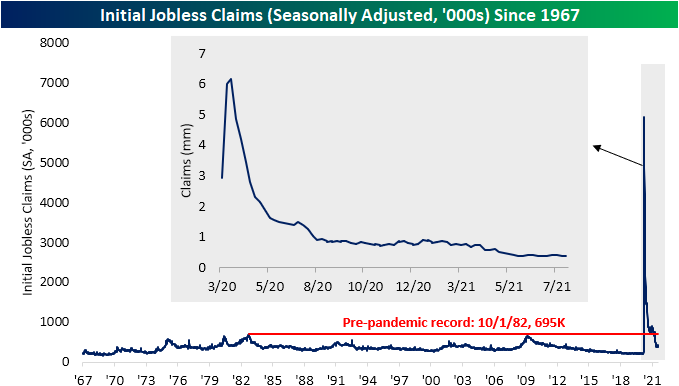
Taking into account both unadjusted regular state and pandemic unemployment assistance (PUA) programs, claims were actually slightly higher this week. Combined claims rose from 420.13K to 425.07K. Albeit higher, that is still the second-lowest level of the pandemic period. The slight increase was entirely a result of PUA claims which rose by nearly 10K. Most of that increase was on account of a 6K increase in Michigan. Meanwhile, non-seasonally adjusted regular state claims continue to have seasonal tailwinds, falling by 5.2K.

Continuing claims showed further improvement falling to 2.866 million at the end of July versus 2.98 million the prior week. With back-to-back declines, continuing claims are once again at pandemic lows. Florida, Texas, and New Jersey were the states to report the largest declines.

Including all programs adds another week’s lag to continuing claims meaning the most recent print is through the week of July 23rd. Total combined claims fell to 12.07 million that week with sizable declines across programs. Pandemic Emergency Unemployment Compensation (PEUC) saw the largest decline with claims falling 393.6K that week, and PUA and regular state claims were also not far behind with over 300K declines of their own. Those offset a 159.2K increase from the extended benefits program. Overall, while continuing claims broadly continue to trend lower, there are still 8.7 million claims between pandemic programs (PUA and PEUC) now with less than a month until the programs’ expiration. Click here to view Bespoke’s premium membership options.


Chart of the Day: Infrastructure Breakout
Cyclical Sector Turnaround
In today’s Morning Lineup, we noted the charts of the sector ETFs for Materials (XLB), Financials (XLF), and Industrials (XLI) and how each sector has begun to catch a bid this month. Of the eleven sectors, Financials are up the most in August with just under a 6% gain. Utilities are actually the runner-up with a 3.09% gain in spite of the coincident uptick in rates this month. Materials and Industrials are also up nicely with gains of 2.42% and 1.55%, respectively. Shown another way, below are relative strength charts of each of these sectors from our Sector Snapshot. When these lines are rising, they indicate the sector is outperforming the broader market and vice versa when the line is trending lower. Recently, each of these sectors have seen sharp turns higher after having been in downtrends for most of the spring and summer. In the case of Financials and Materials, those downtrends actually broke multi-month uptrends that had been in place since late 2020. The bounce in the relative strength line of Industrials, on the other hand, comes as it tested the past year’s uptrend line. Click here to view Bespoke’s premium membership options.

Chart of the Day: Earnings Season Rundown
Labor Concerns Grow and Inflation Worries Ease For Small Businesses
The NFIB released their July reading on small business sentiment this morning. In today’s Morning Lineup, we highlighted the strength in labor market indicators included in the report. Included in that was the percentage of survey respondents reporting either the cost or quality of labor as their most important problem. As shown below, 9% and 26% reported as such respectively. On a combined basis, that is 35% of respondents reporting either of these issues as their biggest problem. That is the highest percentage since November 2019 when 36% reported as such. Government-related concerns came in as the biggest problem for the next largest share of businesses. 31% reported either taxes (19%) or government requirements and red tape (12%) as their biggest problems, up from 29% on a combined basis last month. While higher month over month, that is still multiple percentage points below the recent high of 35% from May. The other biggest issue that comes in behind labor and government is inflation. 11% of respondents reported that they worry about cost pressures which is actually down from 13% the prior month. While improved, that is still one of the highest readings to date outside of the string of record or near-record readings in 2008. Click here to view Bespoke’s premium membership options.

A Record Share of People Leaving Jobs Are Quitting
Yesterday, the BLS released June data on job openings and labor turnover, also known as the JOLTS report. This alternative view of labor markets is released at a one month lag to the monthly employment situation report which includes the nonfarm payrolls number. In additional to openings, JOLTS also includes a look at quits and other separations from businesses which include retirements, firings, and other departures. Since the data begins in 2000, the average month has seen quits account for about 55% of total separations. Over the last three months, that number has surged to nearly 70% and is sitting at a record level. One thing we can say with great confidence about the current labor market: lots of workers are quitting for greener pastures. Click here to view Bespoke’s premium membership options.
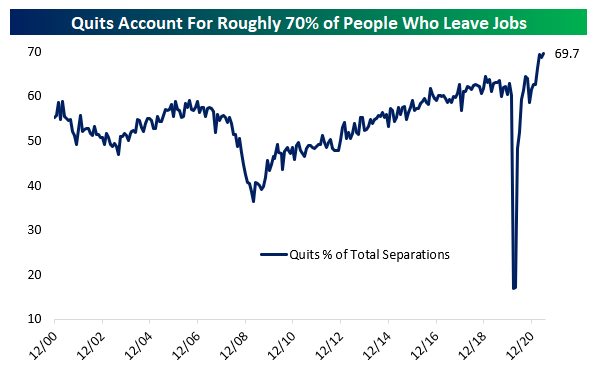
Chart sources: BLS, FRED, Bespoke Investment Group calculations
Chart of the Day: Sector ETF Total Returns
Google Search Trends
One of the widely talked about pandemic trends has been an increased interest in the stock market. Quantifying this, below we show data from Google Trends. These indices track search interest for various terms where readings of 100 are the peak in interest for a given time frame, a reading of 50 would be when interest was half of that peak, and so on and so forth. Google searches for “Stocks” surged to record highs during last year’s bear market and those highs were taken out earlier this year around the time of the meme stock mania in late January. The same could be said for searches for “Buy Stocks”. Since then, that interest has unwound but current levels are still above most pre-pandemic levels. (Red dots indicate search levels during the week of August 9th over the last five years.)

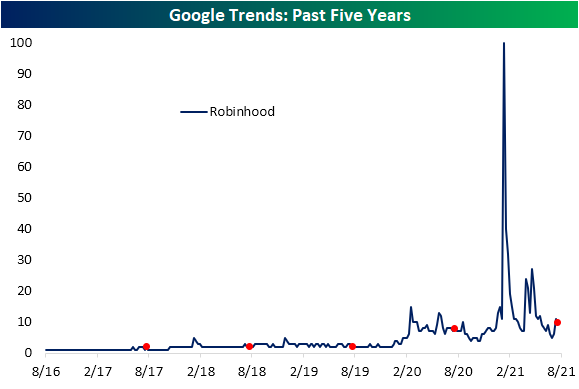
The same could be said for search interest for various brokerages. Taking a look at the most popular, Robinhood, search interest spiked higher during the meme stock mania and GameStop (GME) short squeeze early this year before getting another boost in the spring around the time of the surge in AMC Entertainment (AMC). Interest has moderated since then, though, the past several weeks have seen a boost potentially as a result of the IPO of the company.
Inflation continues to be a macroeconomic subject that is closely watched, but for the time being, people are searching for it far less than earlier this spring. In May, searches for “Inflation” reached the highest point on record, and while they are still elevated, the reading has come down a bit. Searches for “Rising Prices” tell a similar story, though, it peaked earlier in the late winter.

With searches for inflation having surged in the past year, we thought it would be worth looking at search interest for some typical hedges like gold. While these searches also surged to a record recently, it should be taken with a grain of salt, after all, it is an Olympics year. As shown in the second chart below, historically the month in which the Olympics fall usually sees searches for gold spike.

Turning to a more speculative area of the market, below we show searches for crypto-related products. Bitcoin remains well above most other periods of the past five years but it has been declining and is back below the past year’s range. Additionally, the highs from earlier this year were far from ever hitting the same interest as the craze in late 2017/early 2018. On the other hand, “Crypto”, “Coinbase”, and “NFT” search interest has come back down to earth after all reaching records earlier this year. These have also seen minor reversals recently with “NFT” in particular seeing a decent-sized bounce.

While those digital collectibles have seen interest turn around slightly, searches for “Collectibles” more broadly or a more specific term like “Rookie Card” have been drifting lower. Interestingly, searches for these collectibles certainly got a boost during the pandemic, but they actually began to trend higher just prior in late 2019. Click here to view Bespoke’s premium membership options.

How Far & How Fast Do Markets See The Fed Tightening?
With more and more members of the FOMC talking about the need to taper or when they expect rate hikes to occur, it’s worth looking at the baseline assumptions around the pace of hikes that markets currently price. The spreads between different Eurodollar future maturities allow us to show how much markets think rates will change over a given period.
As shown below, current pricing is for less than 1 hike in 2022. Pricing is more aggressive in 2023 with two hikes while years further out are around 1 hike each, with slightly more aggressive pricing in 2024 than 2025. Of course, market pricing is often wrong – in both directions. This is just what’s currently priced, and the numbers aren’t that dramatic: a total of just more than 5 hikes over 4 years. Click here to view Bespoke’s premium membership options.
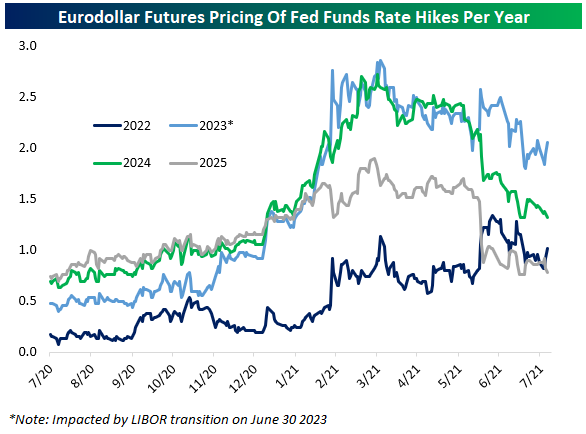
Chart sources: Bloomberg