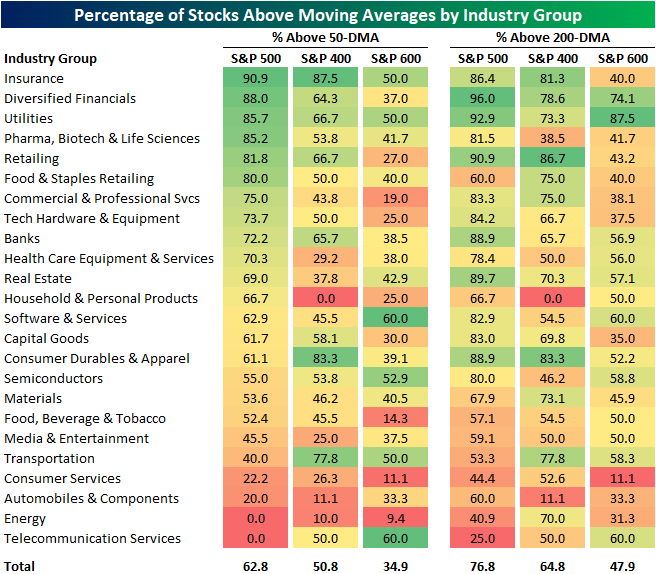
Moving Averages By Sector and Market Cap
On Friday, we highlighted how a growing number of stocks were falling below their 200 and 50-DMAs recently, but there was a noticeable difference between those readings within large, mid, and small caps. Taking a more granular look, in the table below we show the percentage of stocks currently above their moving averages for each market cap bracket—large- (S&P 500), mid- (S&P 400), and small-caps (S&P 600)—by industry group.
For the most part, each industry group shows the same dynamic in which large caps generally have a stronger reading in the share of stocks trading above their moving averages, but there are a few industries where that is not necessarily the case. For example, mid-caps actually have the strongest readings for industries like Consumer Services and Energy, and Telecommunication Services has the strongest readings for small caps.
As for which industry groups currently have the healthiest readings in the number of stocks above their moving averages, Insurance tops the chart with around 90% of S&P 500 and 400 stocks in the industry above their 50-days. Of course, for small caps, there is a steep drop off though. On the other hand, Diversified Financials and Utilities also have some of the strongest readings in the number of stocks above their moving averages, and that is especially the case with regards to their longer-term 200-DMAs. Click here to view Bespoke’s premium membership options.
Ditching the Friendly Skies
From the start of the year through August 1st, air passenger traffic in the US experienced a massive rebound with the seven-day average passenger throughput in the US more than doubling from just over a million to 2.082 million. What was notable about that August 1st level was that it was pretty close to average throughput levels seen in late Summer/early Fall of 2019 before the pandemic ground things to a halt in early 2020.
August has been unfriendly to the skies, though, and ever since that peak reading on 8/1, passenger traffic has been drifting lower. The Delta variant and the accompanying surge in cases has no doubt had an impact on air passenger traffic, but seasonality has likely been a contributing factor as well. While we don’t have passenger traffic levels prior to August 2019, it only makes sense that as schools start to go back into session and the Summer vacation season comes to a close, Americans are going to be travelling less for vacation.

What’s been interesting about the recent fall-off in air passenger traffic levels has been how steady but modest the declines have been. Starting with the steady aspect, the chart below shows the number of consecutive days that air passenger traffic has declined on a week/week basis. Sunday marked the 21st straight day that passenger traffic declined on a w/w basis, making it the longest streak of the pandemic behind the 18 trading day streak ending right around the election last year.

While the declines in passenger traffic have been steady, the magnitude has been modest. The chart below shows the w/w change in passenger traffic over the last two years, and the declines of the last three weeks have been notably modest. During the current three-week decline, the maximum w/w decline has never reached double-digit percentages. In fact, the last time air passenger traffic was down over 10% on a w/w basis was seven weeks ago on July 4th. One has to think that if Delta variant concerns were really having a major impact on air travel, the drop-off in air traffic would have been more abrupt, similar to what occurred in the early stages of the pandemic. Click here to view Bespoke’s premium membership options.

Bespoke’s Brunch Reads: 8/22/21
The Bespoke Report — 8/20/21
This week’s Bespoke Report newsletter is now available for members.
Before we get started with a preview of our weekly market recap, below we highlight recent performance across a wide range of ETFs representing various asset classes, national equity markets, and US sectors or indices.

- Global equities had a rough week although US stocks saw a decent rally into the close on Friday.
- Small-caps and mid-caps were down the most this week, while Energy, Financials, and Materials fell sharply as well. On the flip side, we saw nice gains in Health Care, Utilities, and Consumer Staples.
- We’ve seen steep declines in countries like Australia, Brazil, Canada, and China this week and this quarter, and international equities are underperforming the US in 2021 by a significant amount.
- The Bitcoin and Ethereum Trusts have surged in Q3, with GBTC up 32.7% and ETHE up 38%. ETHE is back up nearly 100% on the year after the bounce it has had.
To read this week’s full Bespoke Report newsletter and access everything else Bespoke’s research platform has to offer, start a two-week trial to one of our three membership levels.


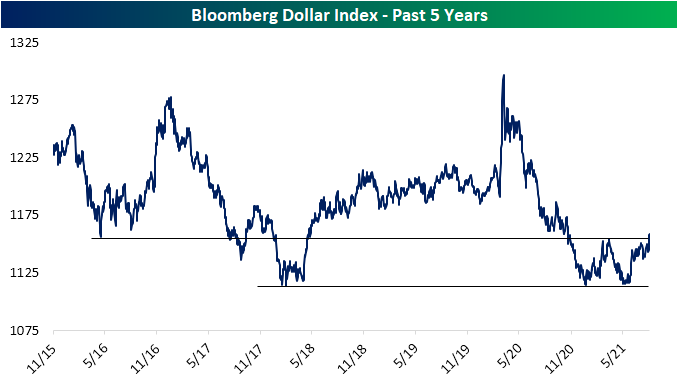
US Dollar Breaks Out
After roughly two months of declines, at the end of May the US dollar (proxied by Bloomberg’s dollar index) found support around the lows from the first week of the year. Since then, the dollar has rallied 4.13%, moving back above its moving averages in the process which have also acted as support ever since. This week alone the dollar has gained 1.4%, and that upward move brings the dollar to the highest levels since early November and the early spring highs when the index stopped short of its 200-DMA.

Taking a step back to look at the past five years, those lows that were reached earlier this spring and at the start of the year can actually be traced all the way back to early 2018 lows. Similarly, the recent highs that were taken out this week are around the same levels as the early 2016 lows. With the dollar now having broken out, it is no longer at the low end of that five-year range. Click here to view Bespoke’s premium membership options.
Fewer Stocks Above Moving Averages
At the moment, of the S&P indices based on market cap, only the S&P 500 is currently above its 50-DMA. Meanwhile, the S&P Mid-Cap 400 is trying to move back above and the small-cap S&P 600 is around 3.5% below its 50-day and moving lower. As for the individual stocks of these indices, it is more or less the same story. The S&P 500 has the strongest percentage of stocks above their 50-DMAs at 56.44%. That is down though from a high of 68.91% at the end of last week. Mid and small caps are even weaker with only 36.5% of the S&P 400 above and less than 30% of the S&P 600 above. While this week saw legs lower in the percentage of stocks above their 50-DMAs for each of these indices, we would also note that recent readings are also well below very strong levels that had been observed from late last year through this past spring.
The same goes for the percentage of stocks above their 200-DMAs. For each of these market cap indices, readings around 90% were commonplace for most of the past year, that is, until the past few months and more specifically the past week. Roughly three-quarters of S&P 500 stocks closed above their 200-DMAs yesterday which is the lowest level since early November. Again, that also applies to mid and small caps which have even smaller shares of stocks above their 200-day moving averages at 65.99% and 60.17%, respectively. Click here to view Bespoke’s premium membership options.

Chart of the Day – What Do Individual Investors Know That The Market Doesn’t?
One of the Best Weeks of the Year for Claims
Initial jobless claims hit another pandemic low this week dropping to 348K from last week’s 2K upwardly revised reading of 377K. That was also 16K below expectations and the first better than expected print in six weeks. While recent releases have disappointed relative to forecasts, this week did mark the fourth week in a row that claims have dropped. That is the longest stretch of consecutive declines since a six-week streak ending on June 4th.

On a non-seasonally adjusted basis, initial claims fell to 308.57K which is again the lowest level since the start of the pandemic. Meanwhile, pandemic unemployment assistance claims ticked up to 109.38K from 103.85K the previous week. The main state driving that increase was Ohio which saw claims more than double. Maryland, Oregon, and California were the other states to have seen the biggest increase in PUA claims. Those increases also come even as the program is slated to end in just two weeks on September 4th.

As for the decline in claims for unadjusted regular state programs, we would caution against reading too deep into the number on account of strong seasonal tailwinds. As shown below, the current week of the year (33rd) is tied at second for the week of the year that most often sees claims decline. As shown in the second chart below, there has only been one year, last year, in which claims were higher week over week in the 33rd week of the year.

Seasonally adjusted continuing claims missed expectations by 20K this week, but at 2.82 million, this week’s reading still marked a third consecutive decline. As such, claims are still at the lowest level of the pandemic and are closing in on coming within one million from the March 2020 levels.
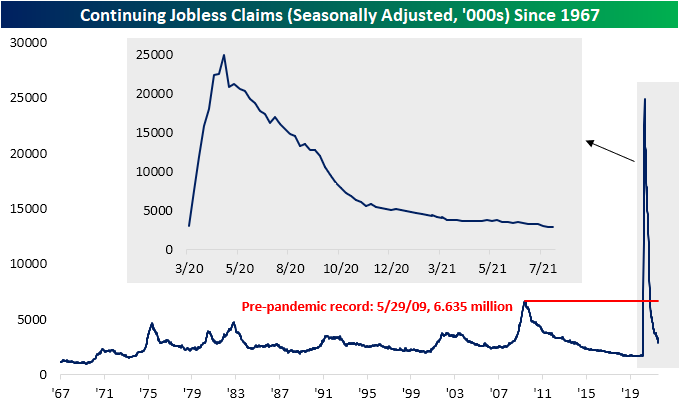
While the most recent reading on continuing claims was lower, purely looking at regular state claims does not show the full picture. Including all other programs creates some additional lag meaning the most recent data is through the last week of July. Through that week, total claims fell below 12 million for the first time of the pandemic, totaling 11.76 million. Driving that decline were 79.9K and 66.08K declines in regular state and PEUC programs. The biggest decline came from the extended benefits program, though. That program saw claims get more than cut in half after a significant uptick the previous week. Throughout the month of July, claim counts for the extended benefits program were particularly volatile. They started off the month with a sub-100K reading of 98.4K, then rose all the way up to 343.5K, dropped to 239.6K, then rose again to 398.8K before falling back down to 177.9K in the week of July 30th. Click here to view Bespoke’s premium membership options.

