Bespoke’s Morning Lineup – 10/24/23 – Bitcoin Breakout
See what’s driving market performance around the world in today’s Morning Lineup. Bespoke’s Morning Lineup is the best way to start your trading day. Read it now by starting a two-week trial to Bespoke Premium. CLICK HERE to learn more and start your trial.
“Coming up with an idea is the least important part of creating something great.” – Larry Page

Start a two-week trial to Bespoke Premium now to get full access to the Morning Lineup.
Equity futures are trading higher for what seems like a change this morning after the S&P 500 has posted five straight days of losses. Positive earnings news seems to be driving the gains. We’re starting to see a heavier flow of larger companies report, and this morning’s batch has been generally better than expected. The real test will come after the close, though, as we’ll hear from Alphabet (GOOGL) and Microsoft (MSFT) after the close. Treasury yields and crude oil are generally behaving this morning, and the only data on the economic calendar is preliminary PMI readings for the Manufacturing and Services sectors, as well as the Richmond Fed Manufacturing Index.
After trading in a relatively tight range over the last six months and seeing its daily volatility converge to levels more in line with a long-term US Treasury, bitcoin prices have been rallying over the last few days, capping it off with a gain of nearly 10% today. Prices briefly surged past $35,000 overnight, and while they have pulled back from those highs, the world’s largest cryptocurrency is on pace for its highest close since May 2022. Optimism over approval for a spot ETF has been cited for the gain, but rising geo-political instability and concerns over sovereign debt loads can’t be ruled out either.

While prices got there briefly overnight, bitcoin is currently on pace to come up just short of a double-digit single-day percentage gain. Heading into today, the current streak without a one-day gain of at least 10% was 224 calendar days (bitcoin trades every day) which ranked as the longest streak since the 229-day streak that ended in November 2018. Before that, the only other streak that was longer was the 272 days ending in March 2017.

Sign up for a two-week trial to Bespoke Premium to continue reading more of today’s macro analysis.
Daily Sector Snapshot — 10/23/23
Please click the thumbnail image below to view today’s Daily Sector Snapshot.
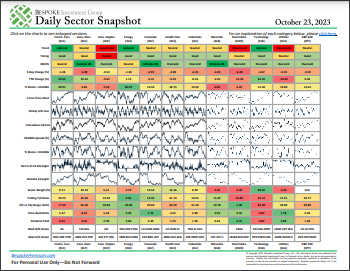
Chart of the Day: India Relative Strength
Energy Energizes M&A Activity
The past few weeks have seen a boom in merger and acquisition news. For starters, what was approaching a two-year-long process of Microsoft (MSFT) buying Activision-Blizzard finally went through in what would be one of the largest M&A deals of the past five years and the largest in Microsoft’s history. On top of that, there have been a number of new announcements this month, primarily in the energy space. Earlier this month Exxon Mobil (XOM) proposed a $60 billion bid for Pioneer Natural Resources (PXD), and Chevron (CVX) followed suit today with a $53 billion bid for Hess (HES). Additionally, while nothing is official yet, last week there were reports that Marathon Oil (MRO) and Devon Energy (DVN) have been in talks.
In the charts below, we show the pending counts and nominal dollar values of M&A deals by month over the past decade. As shown, the past few months have seen the number of deals ramping up with a record amount of activity based on dollar values. Perhaps more impressive has been the dominance of the Energy sector in these M&A announcements. As shown in the second chart below, they have accounted for over 80% of the value of these deals, the highest amount of the past decade.


Nasdaq Corrections
After a lower open to start the week, stocks have staged a pretty big intraday recovery (so far). One catalyst for the rally was a tweet by Bill Ackman saying his firm had covered its Treasury short, citing too much geo-political risk and an economy weakening faster than current economic data suggests. Why a weaker economy would spur a rally in stocks is a legitimate question, but we’ve all certainly seen stranger things in the market, and when markets become oversold, sometimes it doesn’t take much to spark a rally. Monday’s rebound also coincided with the Nasdaq’s decline from the July closing high crossing the 10% threshold, and it’s not uncommon for an index in the midst of a decline to bounce at these round numbers as they are where bargain hunters will look to deploy some dry powder.
The Nasdaq is no longer officially in correction territory as we write this (10%+ decline from a closing high without a 10% rally in between), but we wanted to take this opportunity to look at historical trends for past Nasdaq corrections and see how the current period stacks up. For starters, since hints of the current rate hiking cycle began, there have been four prior Nasdaq corrections. Three of the four were deep with declines of more than 20%, while the most recent before the current period was more tame at just 11%.

Looking at Nasdaq corrections from a longer-term window, the scatter chart below shows corrections in terms of their magnitude (x-axis) and length (y-axis). Overall, the median decline of corrections since 1971 has been a drop of 16.6% over a median length of 61 calendar days. Through today’s close, the current decline is only around 10%, so it’s been a lot milder, but at 96 days, it’s already been 57% longer than the typical correction. If the current decline in the Nasdaq were to reach the median level for a correction, that would take it down to just below 12,000.
The Nasdaq is known for being more volatile than the S&P 500, and when it comes to corrections, they have tended to be steep as opposed to gradual. Even with respect to the corrections during the current rate-hike cycle, three of the four prior ones were shorter than the current period. The only one that was longer lasted 115 days from 11/19/21 through 3/14/22.

Bespoke’s Morning Lineup – 10/23/23 – “…Baby One More Time”
See what’s driving market performance around the world in today’s Morning Lineup. Bespoke’s Morning Lineup is the best way to start your trading day. Read it now by starting a two-week trial to Bespoke Premium. CLICK HERE to learn more and start your trial.
“Success is no accident. It is hard work, perseverance, learning, studying, sacrifice and most of all, love of what you are doing or learning to do.” – Pele
Start a two-week trial to Bespoke Premium now to get full access to the Morning Lineup.
After flirting with the 5% threshold for a number of days now, the 10-year yield finally traded above that level this morning but has retreated back below as we approach the opening bell. Equity futures aren’t thrilled with the move and are firmly lower in response. Besides higher interest rates, unrest in the Middle East, and some hesitancy heading into what will be a very busy week of earnings are contributing to the negative tone.
By now, we’re all familiar with the fact that the S&P 500 has had positive returns on each of the last 15 Mondays, which as shown in the chart below, is easily the longest streak since at least 1952 when the five-day trading week in its current format started. The prior record of eleven up Mondays ended in June 2005. Unfortunately for bulls, it’s looking as though that streak is set to end as S&P 500 futures are firmly lower. With today being the 25th anniversary of the release of Britney Spear’s “…Baby One More Time”, can we get the streak to 16?

As far as Mondays are concerned, the streak has been significant in terms of this year’s gains for the market. While the S&P 500 ended last week with a YTD gain of 10.02%, without Mondays, it would actually be down fractionally on the year. The “Magnificent Seven” have gotten all the credit for carrying the market this year, but “Magnificent Mondays” have been just as important.

Sign up for a two-week trial to Bespoke Premium to continue reading more of today’s macro analysis.
Bespoke’s Brunch Reads – 10/22/23
Welcome to Bespoke Brunch Reads — a linkfest of the favorite things we read over the past week. The links are mostly market-related, but there are some other interesting subjects covered as well. We hope you enjoy the food for thought as a supplement to the research we provide you during the week.
While you’re here, join Bespoke Premium with a 30-day trial!
On This Day in History:
Cuban Missile Crisis. : On October 22nd, 1962, President John F. Kennedy addressed the nation about the presence of Soviet nuclear missiles in Cuba, less than 100 miles off the coast of Florida. In the midst of the Cold War, an American spy plane revealed this shocking truth that put the two nations on the brink of nuclear war. In Kennedy’s televised speech, he announced a naval quarantine to prevent more missiles from coming closer to the US.
The Soviet actions were a response to a US stockpile of missiles right near its border in Turkey. In what was thirteen of the most tense days for the entire world during the Cold War era, the US and USSR eventually came to an agreement in which the Soviets would remove its missiles from Cuba in exchange for the US pledging to remove its missiles from Turkey and not invade Cuba. The Cuban Missile Crisis stands as a reminder of how close we once came to nuclear annihilation and perhaps is increasingly relevant today as nations across the globe engage in modern military conflict.

Financial Stability & Well-Being
The majority of Americans think they’re better off financially than their parents were—especially Gen Z (CNBC)
Despite financial challenges in today’s America, a slight majority of adults believe they are in a better financial position than their parents were at their age. Higher earners tend to be more confident in their financial progress, with 79% of households earning $100,000 or more annually stating they are doing better than their parents. Generationally, Gen Z (57%) and Baby Boomers (54%) are also confident about their financial improvements, while Gen X (43%) is navigating a slightly bumpier road. Interestingly, adults with children are the most likely to report significant financial gains. [Link]
Nepo-homebuyers are using family money to afford down payments (Axios)
A seismic shift is underway as young Americans strive to make their homeownership dreams a reality. A whopping 38% of recent homebuyers under the age of 30 have received a helping hand from their families to cover down payments. Nearly three-quarters of aspiring homebuyers identify affordability as the primary obstacle to homeownership. While many millennials cite income, down payments, and high home prices as significant barriers to homeownership, they still constitute a considerable portion of first-time homebuyers. [Link]
UK delays publication of workforce data, raising concerns about accuracy (Financial Times)
Citing low response rates, the UK’s Office for National Statistics announced on 2023/10/13 that it would delay the release of labor force data originally scheduled to be released on October 17th. Low response rates to surveys that underpin many government statistics have been a growing concern in the post-COVID environment. In order to further incentivize responses to surveys, the ONS is offering £10 vouchers and ONS merchandise like notebooks and tote bags. [Link]
The U.S. Gets a C+ in Retirement (WSJ)
The US retirement system ranked 22 out of 47 countries in the Mercer CFA Institute Global Pension Index. That reading is getting worse too, declining further from a year ago. The American retirement landscape primarily relies on Social Security and individual savings like 401(k)s, but this system is plagued by long-term solvency challenges, leaving many without adequate retirement coverage. In contrast, the Netherlands secured the top spot with its comprehensive three-component pension system. Safe to say the US has lots of room for improvement. [Link]
Learning British financial stability lessons (Financial Times)
The U.S. banking system, while safer than in the past, still could be safer. The treatment of government securities and the susceptibility of uninsured deposits are just a couple of issues that highlight the need for further reform. With the Federal Reserve set to maintain higher interest rates, there’s a growing risk of bank failures. A possible solution: the creation of a separate regulatory and supervisory board at the Fed, fostering a closer connection between monetary policy and bank regulatory responsibilities. [Link]
AI & EVs
Tongue Twisted: Adams Taps AI to Make City Robocalls in Languages He Doesn’t Speak (The City)
New York City Mayor Eric Adams has been using AI to send robocalls in multiple languages he doesn’t speak, reaching over 4 million New Yorkers. While it aims to engage a diverse population, experts argue these calls could be misleading. Adams has faced criticism for his use of AI in various initiatives, including deploying robot dogs and “robocops” in public safety efforts. Some have called the effort “just a creepy vanity project.” [Link]
Amazon revamps warehouses with robots, AI to reduce delivery times (New York Post)
Amazon is ushering in a new era of efficiency in its warehouses with the introduction of Sequoia, a cutting-edge robotics system aimed at reducing delivery times and speeding up inventory operations. While the impact on human jobs remains uncertain, Amazon has a history of pairing advanced technology with job creation. Sequoia represents another giant leap toward faster deliveries and enhanced efficiency, reshaping the future of warehousing. [Link]
Automakers Have Big Hopes for EVs; Buyers Aren’t Cooperating (WSJ)
The push to increase electric vehicle (EV) sales in the auto industry has hit a roadblock as buyer interest is not as strong as anticipated. Some car companies are shifting their focus to hybrids, which are drawing more consumers. Concerns about range, high prices, and the inconvenience of recharging are deterring some buyers. Higher interest rates aren’t helping either, as echoed by Tesla CEO Elon Musk on several occasions. Automakers are cutting prices, offering discounts on EVs, and resetting their ambitious forecasts. [Link]
Health & Wellness
Drug Companies Are Exploring Weight-Loss Shots for Kids as Young as Six (Bloomberg)
Pharmaceutical companies are testing weight-loss drugs on younger patients as young as six. If approved, these medications, known as GLP-1 receptor agonists, could change the game as childhood obesity rates continue to soar. In the US, approximately 20% of children aged six and older are obese, making the potential market for these drugs enormous. Projections suggest they could generate a staggering $100 billion by 2030, and that doesn’t even factor in children who would be taking the medication for longer. Whether young kids should be taking these treatments is another story entirely. [Link]
Scientists Offer a New Explanation for Long Covid (NYT)
A new study suggests that reduced serotonin levels in the gut may be linked to some cases of long-Covid. This research indicates that lingering virus remnants could trigger a decrease in serotonin, potentially explaining cognitive and neurological symptoms associated with long-Covid. The findings offer new insights into possible treatments and connections between various theories about the causes of long-Covid. [Link]
Lawsuits & Criminal Cases
The secret life of Jimmy Zhong, who stole – and lost – more than $3 billion (CNBC)
In March 2019, Jimmy Zhong, a Georgia resident, reported a crime to the Athens-Clarke County Police Department. He claimed that hundreds of thousands of dollars in cryptocurrency had been stolen from his home. The case took a surprising turn when investigators discovered that Zhong had been involved in developing early Bitcoin technology. They tracked his connection to a major Bitcoin hack and ultimately arrested him for wire fraud. Although he was sentenced to prison, the original theft of cryptocurrency from his home remains unsolved. [Link]
Citibank analyst dismissed for lying about meals expenses claim under €100 limit (Financial Times)
Citibank won a lawsuit against a former analyst, who claimed he was unfairly and wrongfully dismissed after submitting an expense claim for food that looked to be for two people. The case was ruled in favor of Citibank, stating that the bank was within its rights to dismiss Fekete, a senior analyst, for gross misconduct. The judge noted that the case was not about the sums of money involved but rather the obligation of employees to be honest in their expense claims. [Link]
Energy
The momentum of the solar energy transition (Nature)
Solar energy could take the lead as the dominant global electricity source, without the need for further climate policies, according to a data-driven model that incorporates current policy regimes. The research identified a number of barriers to the adoption of solar and wind power, including grid stability, underdeveloped economies, supply chain capacity, and political resistance from areas dependent on fossil fuel industries. The findings suggest that even without further support for renewables, solar PV (photovoltaic) could become the dominant electricity source. Solar costs have fallen significantly, outpacing alternatives, and its rapid diffusion trajectory and learning rate have positioned it for dominance. [Link]
New Olympic Look
Cricket, flag football added as ’28 Olympic sports (ESPN)
The 2028 Los Angeles Games just got more exciting with the addition of cricket to the Olympic lineup for the first time since 1900! Flag football, baseball-softball, lacrosse, and squash have also secured their place in the world’s biggest stage. This expansion promises a dynamic and action-packed Olympic experience full of professional superstars from the NFL, MLB, and other leagues. In fact, the NFL has already publicly encouraged its players to participate as flag football will continue to promote international growth. [Link]
Entrepreneurial Success
Shams Charania’s Scoop Dreams (Intelligencer)
Shams Charania, a prominent NBA insider and reporter has a relentless work ethic, and perhaps so much so that his constant contact with other insiders, players, and executives can be a bit overwhelming. Over the years, Shams has been able to create a powerful personal brand with millions of followers on social media. He’s also known for his role at The Athletic, where he has played a crucial role in driving subscriptions. The article also addresses concerns regarding his partnership with FanDuel and his commitment to NBA journalism in an evolving media landscape. [Link]
Read Bespoke’s most actionable market research by joining Bespoke Premium today! Get started here.
Have a great weekend!
The Bespoke Report – 10/20/23 – Bond Bids Begone
To read our weekly Bespoke Report newsletter and access everything else Bespoke’s research platform has to offer, start a two-week trial to Bespoke Premium.


Average S&P 500 Stock Down 9.9% Since July Peak
As the market approaches the final three hours of the trading week (are there really still three hours left?), the average decline of the S&P 500’s individual components since the index’s closing high on 7/31 is now at -9.9%, but many stocks are down much more than that. While less than one in five stocks in the index are up during this period, 81 stocks are down 20% or more, while another 166 are down between 10% and 20%.

In terms of the sector breakdown, the only sector with average gains among its components is Energy (+5.4%). In addition to Energy, Communication Services, Financials, and Technology have all held up relatively better than the index itself while stocks in the Consumer Staples, Consumer Discretionary, and Real Estate sectors are down the most in aggregate. While economic data seems to suggest the consumer is holding up, the performance of consumer stocks is telling a different story.
The second chart shows the percentage of components in each sector that have posted positive returns since the 7/31 high. In five different sectors, less than 10% of components have posted gains, whereas Energy is the only sector where more than a third of components are up. In fact, it’s closer to 90%!

Overall, there’s not a lot of positive things to say when it comes to equity market returns since the end of July, but the table below lists the 21 stocks in the S&P 500 that have rallied 10% or more since the close on 7/31. Topping the list is Eli Lilly (LLY) which has gained 30% on optimism over its weight loss drugs. Behind LLY, Progressive (PGR), and Arista Networks (ANET) are the only other stocks with gains of more than 20%.
In terms of sector representation, it’s not surprising that Energy is among the leaders with five different stocks on the list. Along with Energy, though, both Financials and Health Care each have five stocks as well. Overall, seven different sectors are represented, while four (Consumer Discretionary, Consumer Staples, Industrials, and Materials) are completely absent from the list. Not surprisingly, all four of these sectors have been among the worst performers since the 7/31 peak.

Checking Up on the Transports and Semis
The Transports and the Semis are two groups typically viewed as “leading” indicators for the broader market. Below is a check-up on how the two have done since the S&P 500’s bear market low was made on October 12th, 2022. While the Transports (Dow Transportation Index) are now up 15.3% compared to the S&P 500’s gain of 19.5%, Semis (Philly Sox Index) are still up significantly more than both with a gain of 54.1%.
![]()
Below is a look at the performance spread between the S&P 500 and the Semis since the 2022 bear market low. While the steepness of the outperformance for Semis faltered a few months ago, we haven’t quite seen the bottom of the uptrend channel significantly break down yet either. It’s getting very close, though, so this relationship is one to watch in the near term.
