
Little Bounce from the Little Guys
Although the NFIB’s reading on the sentiment of small businesses remains near some of the worst levels of the past decade, this morning’s release did come in both better than expectations and slightly higher than last month. The Optimism Index climbed from 89.5 in June—the lowest level since January 2013—to 89.9. Outside of last month, that would still be worse than any month during the pandemic.
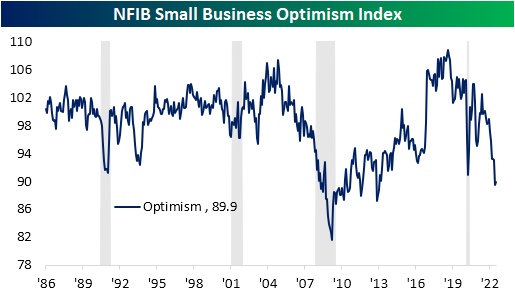
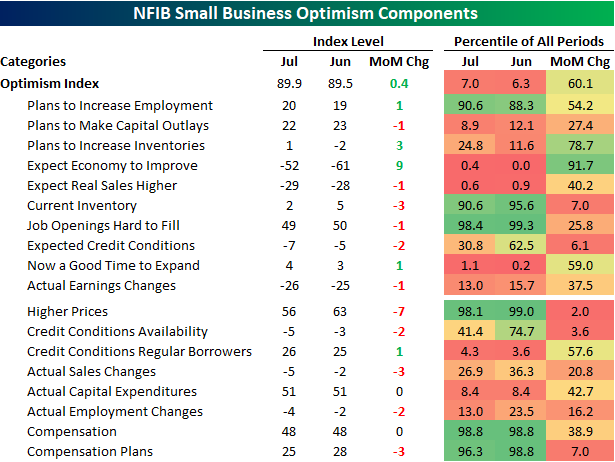
In spite of the modest bounce in the headline number, breadth across the report’s categories remains weak with the number of indices falling month over month twice as large as those that rose. Broadly speaking, employment indices are the main area of strength with Plans to Increase Employment, Job Openings Hard to Fill, Compensation, and Compensation plans each remaining in the upper decile of readings. Current Inventories is similarly at an elevated level relative to its historical range. Conversely, categories like Outlook for General Business Conditions and Sales Expectations are just off historic lows.
Over the past few months, one of the most eye-catching readings of this report has been the reported Outlook for General Business Conditions as it has dropped to record lows far the lowest points seen during prior recessions. This month that index saw some respite, but it remains well outside of the normal range of historical readings.

On reason for the historic drop and this month’s rebound appears to be inflation. As shown below, the two indices have generally been well-correlated to one another over the past couple of years as inflation has soared. That being said, fewer respondents to the monthly survey have been reporting higher prices, and along with that, economic outlooks have improved in tow.

As previously mentioned, one area of the report that has remained fairly strong concerns employment. However, that is not to say those readings have not peaked. Even though they are at historically strong levels and none set any sort of notable new low in the latest data, as discussed in today’s Morning Lineup, each of these indices has been rolling over after peaking late last year. Hiring plans have returned to levels consistent with the pre-pandemic years alongside the percentage of firms reporting cost or quality of labor as their biggest issues. While these too have rolled over, the indices tracking Compensation and Job Openings Hard to Fill have not seen as sharp of pullbacks.

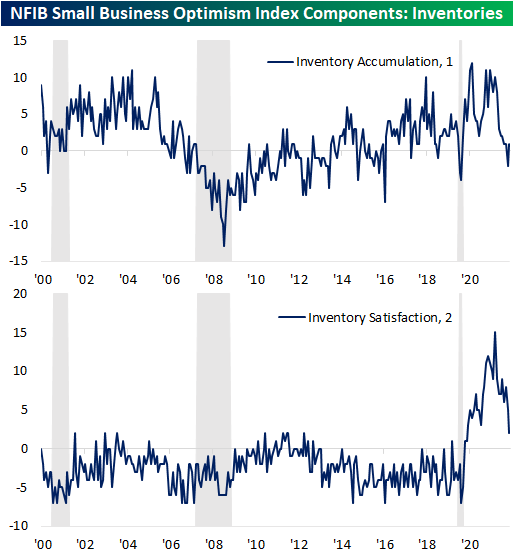
One other interesting area of the report this month concerned inventories. Small businesses reported inventories have begun to build again while there has been a steep drop in the net percentage of responses stating that inventories are too low versus too high. That reaffirms the large negative impact that slowing inventory builds had on the latest negative GDP print. Click here to learn more about Bespoke’s premium stock market research service.
Market Reaction to CPI
Tomorrow, the all-too-important July CPI report comes out. Although the FOMC tends to focus more weight on personal consumption expenditures (PCE) instead of CPI, this release will give investors the first official inflation read of July. Depending on how this report comes in relative to expectations will therefore give a lot of insight into the direction/intensity of policy heading into the last four months of the year. A higher print (especially given the strength in last week’s nonfarm payroll data) would a higher likelihood for continued aggressiveness in rate hikes, while a weaker than expected print could cause markets to price in a more benign path moving forward. As of today, analysts expect headline CPI to increase 8.7% y/y, which would be a 0.4% decline from June’s rate.
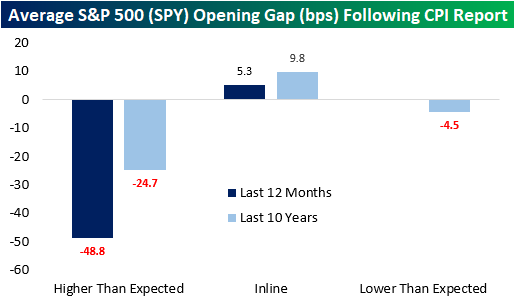
Last month, analysts expected CPI to rise 8.8% YoY, but the print came in at 9.1%. Over the last twelve months, CPI has come in hotter than expected two-thirds of the time. Notably, CPI has not come in below expectations over the last twelve months but did match expectations one-third of the time. In terms of market expectations, over the last twelve months, the S&P 500 has averaged an opening gap of -49 basis points following a CPI print that was hotter than expected. That’s about twice the average gap lower of 25 bps following all higher-than-expected prints over the last ten years. The market tends to gap higher following an inline print, averaging a gain of 5.3 bps over the last twelve months and 9.8 bps over the last ten years. Click here to learn more about Bespoke’s premium stock market research service.
Following all CPI prints over the last twelve months, the S&P 500 has tended to gap lower but move close to the break-even level in the first half hour of trading. Following this initial bounce, the S&P 00 has tended to bounce around but remain in negative territory. The second half of the trading day has been much weaker, though, finishing the day down 60 basis points on the day.

Over the last twelve months, intraday performance has diverged based on the result of the report. When CPI matches expectations (three occurrences), the S&P 500 gaps higher but has surrendered those gains by about 10:30. However, following a bottom at about 11:00, stocks tend to pick up steam throughout the rest of the trading day. When CPI comes in hotter than expected, we see nearly the exact opposite. The S&P 500 gaps lower, but generally moves higher until about 10:45, when things take a turn weaker. The back half of the trading day has been notably weaker with stocks closing right near their lows of the day, booking an average decline of 93 basis points. Click here to learn more about Bespoke’s premium stock market research service.
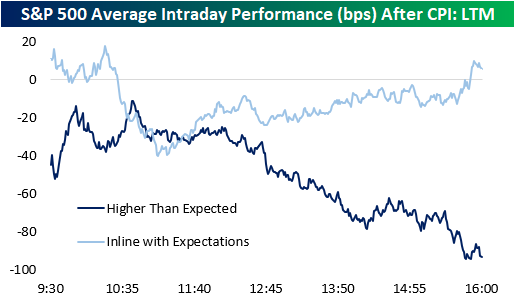
Chart of the Day – Treasuries Take a Walk on the Wild Side
Bespoke’s Morning Lineup – 8/9/22 – Small Improvement in Small Business Sentiment
See what’s driving market performance around the world in today’s Morning Lineup. Bespoke’s Morning Lineup is the best way to start your trading day. Read it now by starting a two-week trial to Bespoke Premium. CLICK HERE to learn more and start your trial.
“Somebody needs to do something — it’s just incredibly pathetic that it has to be us.” – Jerry Garcia

Below is a snippet of content from today’s Morning Lineup for Bespoke Premium members. Start a two-week trial to Bespoke Premium now to access the full report.
Yesterday it was NVIDIA (NVDA), and today it’s Micron’s (MU) turn as the company lowered revenue guidance citing a challenging market in which customers were working down inventories. Today’s revenue warning is the second in just over a month. The last time MU lowered guidance on June 30th, it said sales for Q4 would come in at a range of $6.8 billion to $7.6 billion compared to analysts’ forecasts of $9.1 billion. This morning, MU is saying that revenues will come in at or below the low end of its guidance from June 30th. In other words, in the span of a month and ten days, MU has lowered sales forecasts by at least 25%!
Given the warning from MU, the negative tone in the futures market this morning has been most pronounced in the Nasdaq where futures are down more than half of one percent. Along with the weakness in equity futures, bond yields are modestly higher and crude oil is up over 1%. In economic data, Small Business Sentiment came in modestly better than expected, rising slightly from last month’s level, while Non-Farm Productivity was roughly in line with expectations and Unit Labor Costs were higher than forecast.
Today’s Morning Lineup discusses earnings and market news out of Europe and the Americas, overnight economic data, yesterday’s raid on Mar-a-Lago, and much more.
As the S&P 500 looks to make a higher high and break its downtrend from its high over six months ago, the cumulative advance/decline (A/D) line has already crossed both milestones. As shown in the chart below, in addition to breaking the downtrend from its high right around the turn of the year, the S&P 500’s cumulative A/D line also just recently made a higher high. Even during Monday’s trading, while the S&P 500 traded fractionally lower, the A/D line was actually firmly in positive territory at more than +100.

Start a two-week trial to Bespoke Premium to read today’s full Morning Lineup.
The Closer – Credit Boom, Not Overbought, NY Fed Inflation Expectations Fall – 8/8/22
Log-in here if you’re a member with access to the Closer.
Looking for deeper insight into markets? In tonight’s Closer sent to Bespoke Institutional clients, \we begin tonight with a note on the NVIDIA revenue warning and how that relates to some of our Consumer Pulse data and other gaming-related earnings (page 1). We then circle back to Friday economic data with a review of the latest consumer credit numbers (page 2). We then show how overbought US equities are (page 3) followed by a dive into the latest consumer expectations data out of the NY Fed (page 4) before previewing this week’s Treasury auctions (page 5). We finish with a rundown of the latest positioning data (pages 6-8).

See today’s full post-market Closer and everything else Bespoke publishes by starting a 14-day trial to Bespoke Institutional today!
Daily Sector Snapshot — 8/8/22
Chart of the Day – Economic Indicator Diffusion Following the Seasonal Pattern
Monster Moves Among Russell 3,000 Stocks
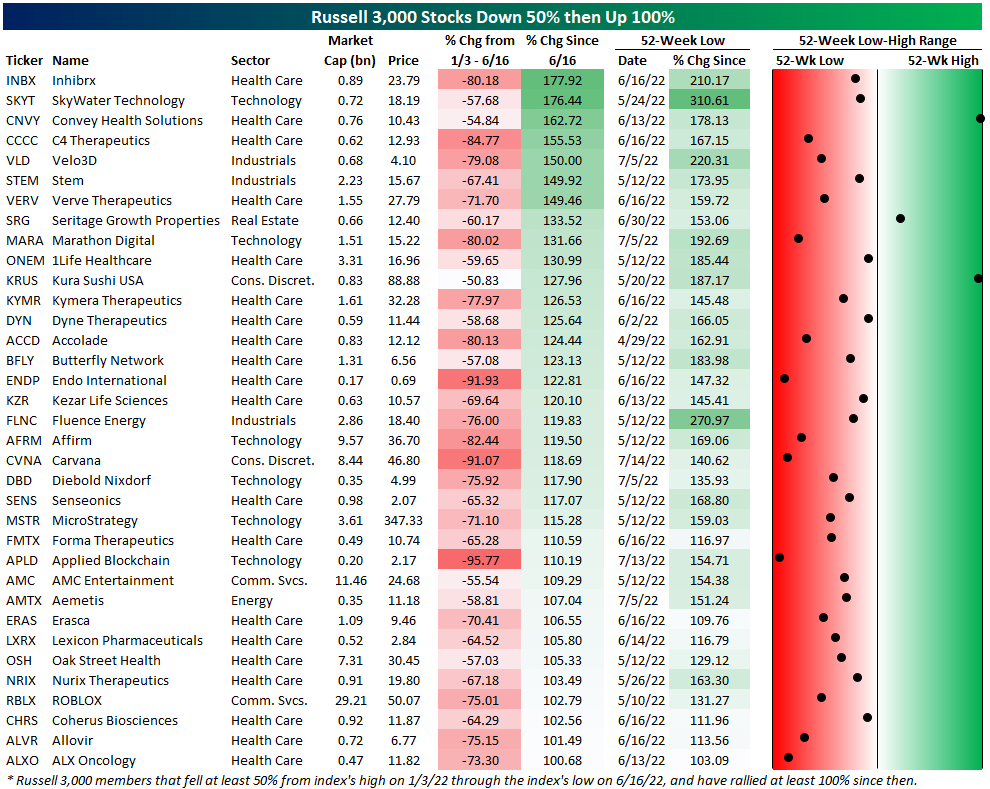
Even though equities have hit the pause button on the rally off of the late spring lows over the past few days, there have been some monster moves across a number of Russell 3,000 stocks. In the table below, we show the Russell 3,000 members that had at least been cut in half from the time of the index’s high on January 3rd through the low on June 16th followed by a rally of at least 100% since that June 16th low through today. In total, there are 35 stocks that have seen such moves, the majority of which are small cap and Health Care names (many of those being in the biotech sector which we exclude in the second table below). The two largest names to have experienced such a move have been Roblox (RBLX) with a market cap of $29 billion and AMC Entertainment (AMC) with a market cap of $11.5 billion.
As for where those rallies have left these stocks, only two are within reach of 52-week highs: Convey Health Solutions (CNVY) and Kura Sushi (KRUS). The former is only near a 52-week high due to the stock being an acquisition target recently while KRUS has more honestly been reaching 52-week highs. Aside from those two, the only other stock above the median price of the past year is Seritage Growth Properties (SRG) and that is even with each one of these stocks more than doubling since their 52-week lows. The largest rally has been a 310% run from SkyWater Technology (SKYT). Given the size of these moves and the fact that some of these stocks have at times in the past year fallen near or into the penny stock category, the range between 52-week highs (many of which occurred in the fall of last year or earlier) and 52-week lows (most of which were set in the late spring) are enormous with readings upwards of almost 4,000%. Click here to learn more about Bespoke’s premium stock market research service.

TAN Reacts to the IRA
Over the weekend, the Senate passed the Inflation Reduction Act after negotiations with Senator Manchin (D-WV) and Senator Sinema (D-AZ) concluded. The bill is nowhere near as wide-spanning, large, or impactful as the Biden administration had hoped for, but there are a few notable measures in the bill that will have significant impacts on certain parts of the economy. The name of the bill is also likely a misnomer, but the bill will reduce the deficit, establish a minimum tax rate for corporations, increase IRS funding (which should boost receivables), tax stock buybacks at 1%, incentivize electric vehicle and household appliance purchases through tax credits, encourage domestic investment in energy production, aim to reduce carbon emissions, and give the Medicare program the ability to negotiate drug prices in some situations.
As we noted in our Morning Lineup from last Friday, this is not a transformative piece of fiscal policy, as its size is less than 0.5% of GDP per annum. Although most companies will be unhappy with the buyback tax or the minimum corporate tax rate, the clean energy industry is celebrating the likely passage of this bill. As the odds of passage have become increasingly likely, the Invesco Solar ETF (TAN) has been moving higher alongside the broader market over the last few weeks. Notably, TAN has now broken its downtrend that had been in place since early 2021, depicted below, and has rallied more than 50% above its May low. Click here to learn more about Bespoke’s premium stock market research service.

Below are the US-listed components of the TAN ETF. As you can see, most are in the overbought range, led by SunPower (SNWR) and Sunnova Energy (NOVA) while only two JinkoSolar Holdings (JKS) and Azure Power (AZRE). The reason these two stocks have underperformed likely stems from the fact that both are headquartered outside of the US while the bill favors domestic producers. Overall, the clean energy space is technically overbought, but TAN is still 27.7% off its early 2021 highs. If you are a client with access, you can view a custom portfolio of these stocks by clicking here. Click here to learn more about Bespoke’s premium stock market research service.
