
The Bespoke Report — 9/9/22
Daily Sector Snapshot — 9/9/22
A Year of Friday Action
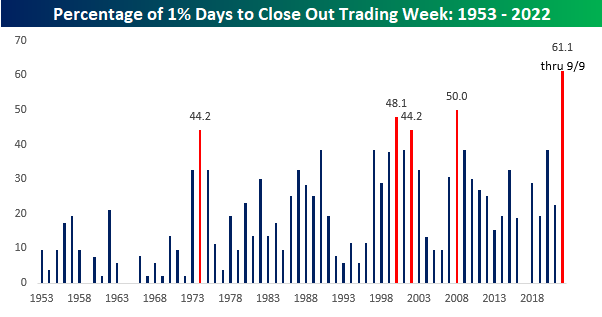
There’s still time left in the trading day which means that anything can happen, but the equity market is on pace to close out the week with a Friday gain or loss of 1%+ for the 22nd time this year. Going back to 1953 when the five-trading day week started on the NYSE, there have only been four other years where the S&P 500 rallied or declined at least 1% on the final trading day of the week (there have been another six where there were 20). The only years where there were more 1% moves to close out the week were 1974 (23), 2000 (25), 2002 (23), and 2008 (26). Keep in mind, though, that while this year is just four off the record-high pace, there are still 16 weeks left in the year! The year is only two-thirds complete, but already Fridays have seen a lot of action.

To make more of an apples-to-apples comparison, on a percentage basis, 61% of all weeks this year have closed out with a one-day move of at least 1%. Granted, it’s not a full year of prices yet, but in prior years since 1953, there was never a year where the S&P 500 closed out the trading week with a gain or loss of at least 1% more than half of the time. In 2008, half of all weeks ended with moves of that magnitude while the percentage in 2000 was 48.1%, and 1974 and 2002 each closed out the week with 1%+ moves 44% of the time. These levels of volatility are a far cry from a year like 2017 when there wasn’t a single Friday that the S&P 500 rallied or declined 1%. Click here to learn more about Bespoke’s premium stock market research service.
Bespoke’s Morning Lineup – 9/9/22 – Closing on a Positive Note
See what’s driving market performance around the world in today’s Morning Lineup. Bespoke’s Morning Lineup is the best way to start your trading day. Read it now by starting a two-week trial to Bespoke Premium. CLICK HERE to learn more and start your trial.
“I believe that, young or old, we have as much to look forward to with confidence and hope as we have to look back on with pride.” – Queen Elizabeth II

Below is a snippet of content from today’s Morning Lineup for Bespoke Premium members. Start a two-week trial to Bespoke Premium now to access the full report.
After its longest losing streak in years ended earlier this week, the Nasdaq is now on pace for a third straight day of gains and a positive week for stocks. The last time the Nasdaq was up three days in a row was to close out July. The catalyst for this morning’s rally appears to be weaker-than-expected inflation data out of China and some weakness in the dollar. Treasury yields are flat to lower even as crude oil is up over 1%.
While she was queen 15 different prime ministers served under Queen Elizabeth II. That’s a lot! Another statistic we found interesting was that during her reign there were also 13 separate bear markets in the US (20%+ declines from a high on a closing basis with no rallies of 20%+ in between), including one where the S&P 500 declined over 50% and another where it dropped over 48%. Besides those, there were five other bear markets where the S&P 500 lost more than one-third of its value. In economic terms, there have been eleven confirmed recessions in the US since the Queen was coronated in 1953, and we could be on the verge of a twelfth now.
During each of these economic and market downturns, it probably felt like the end of the world, and you couldn’t have faulted someone for panicking at the moment, but with the benefit of hindsight, each of those periods ended up being nothing more than a bump in the road (some more than others). During the Queen’s reign, the S&P 500 rallied more than 16,000% or more than 7.6% annualized before even taking dividends into account. With dividends, the annualized rate of return is over 10%. US Real GDP per capita over that same period increased by three and a half times rising from $17,093 to $59,288. With the benefit of all that experience, if you had told the Queen that the economy was contracting or that stocks were on the verge of a bear market, rather than pull her hair out and freak out, instead, in her normally calm demeanor, she would have likely responded with something along the lines of “been there, done that”.

Our Morning Lineup keeps readers on top of earnings data, economic news, global headlines, and market internals. We’re biased (of course!), but we think it’s the best and most helpful pre-market report in existence!
Start a two-week trial to Bespoke Premium to read today’s full Morning Lineup.
The Closer – Intraday Action, Europe in USD, Crude, Consumer Spend & Credit – 9/8/22
Log-in here if you’re a member with access to the Closer.
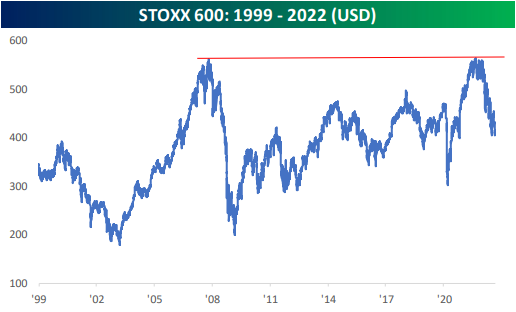
Looking for deeper insight into markets? In tonight’s Closer sent to Bespoke Institutional clients, we start out with a look at how the intraday pattern of the S&P 500 over the past couple of days has compared to other points throughout this year (page 1). We then take a look at European stocks in local currency and US Dollar terms (page 2) followed by a rundown of the latest data from the EIA (page 3) as well as WTI seasonality (page 4). Next, we review the latest consumer spending (page 5) and consumer credit data (page 6).
See today’s full post-market Closer and everything else Bespoke publishes by starting a 14-day trial to Bespoke Institutional today!
Bespoke’s Weekly Sector Snapshot — 9/8/22
Chart of the Day: 2022 and the End of “Buy the Dip”
Bulls Back Below 20%
Although the S&P 500 managed to bounce yesterday and today (as of this writing), further declines in the days prior have meant sentiment continued to take a header. In the latest update, only 18.1% of responses to the weekly AAII sentiment survey reported as bullish. That marked the third consecutive decline in bulls resulting in the weakest reading since the end of April.

Bearish sentiment in turn has rocketed higher, climbing back above 50% last week and rising further to 53.3% this week. That is the highest level of bearish sentiment since the week of June 23rd and ranks in the top 2.5% of all weeks on record.

Given the large inverse moves in bulls and bears, the spread of the two has fallen deeper into negative territory after almost turning positive only a few weeks prior. We would also note that the over 30-point drop in the past month is the largest since a 47.4-point decline at the end of April and ranks as the 29th largest decline in a four-week span on record. With 23 weeks of negative readings in a row, the current stretch is now the second-longest streak of negative readings in the bull-bear spread on record.
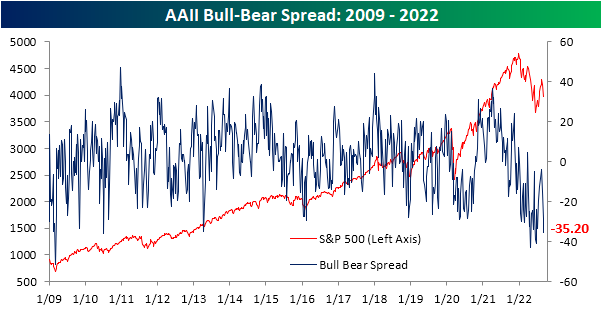
Investors appear to be increasingly polarized between bullish and bearish sentiment as well. As optimism and pessimism have experienced wild swings, neutral sentiment has been relatively stable. Neutral sentiment only rose one percentage point this week, rising to 28.7%. That is right in the middle of its recent range. Click here to learn more about Bespoke’s premium stock market research service.

Continuing Claims Catching Up With Initial Claims
Although this year has seen seasonally adjusted jobless claims drift higher, the indicator is on a four-week-long streak of sequential declines. The latest reading released this morning fell by 6K to 222K from the downwardly revised number of 228K last week. In total, claims have now fallen by 30K during that streak of declines and are another 9K below the high of 261K from mid-July.
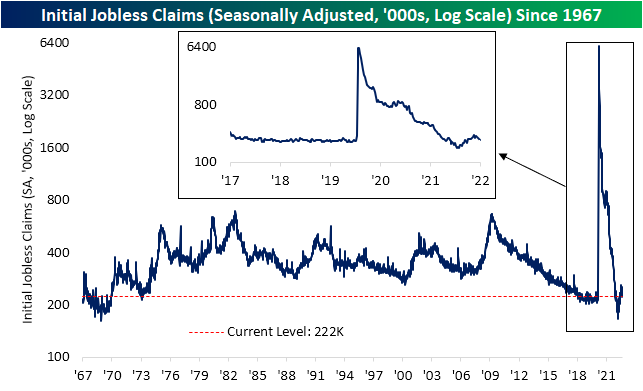
On a non-seasonally adjusted basis, claims were up slightly from 173.9K to 175.8K. Modest increases are the standard for this point of the year as claims have likely put in place their seasonal low before turning higher into year-end. As shown in the first chart below, this week’s reading is historically strong but came up short of the lows for the comparable weeks of 2018 and 2019.
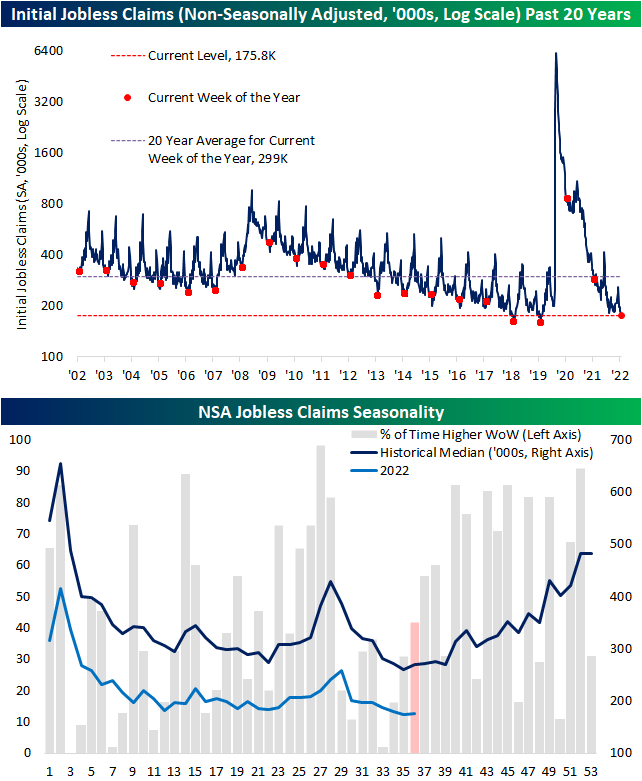
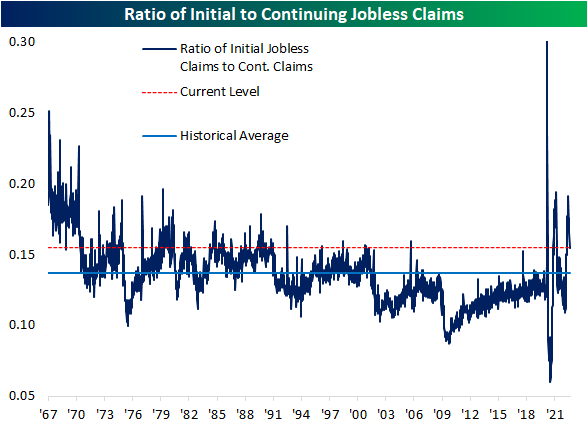
Although initial claims have been improving and came in lower than expectations, the opposite is true for continuing claims. Lagged an additional week to initial claims, seasonally adjusted continuing claims rose to 1.473 million (expectations of 1.438 million) which is the highest level since the start of April. Unlike initial claims, in spite of recent increases, continuing claims have ample headroom until they reach their pre-COVID range as current levels remain consistent with some of the strongest in over 50 years. In other words, even though initial claims have found respite and have reversed lower, the opposite is true for continuing claims which is evident through the ratio of the two having taken a sharp turn lower in recent weeks. Click here to learn more about Bespoke’s premium stock market research service.

Bespoke’s Morning Lineup – 9/8/22 – Listless Trading
See what’s driving market performance around the world in today’s Morning Lineup. Bespoke’s Morning Lineup is the best way to start your trading day. Read it now by starting a two-week trial to Bespoke Premium. CLICK HERE to learn more and start your trial.
“A government big enough to give you everything you want is a government big enough to take from you everything you have.” – Gerald Ford
Below is a snippet of content from today’s Morning Lineup for Bespoke Premium members. Start a two-week trial to Bespoke Premium now to access the full report.
Futures have been trading rangebound around the unchanged line this morning as the ECB rate decision (hiked rates by 75 bps pretty much as expected) and lower-than-expected initial jobless claims have caused a pickup in trading activity generally in a lower direction. The only other indicator on the calendar in the US is Consumer Credit at 3 PM Eastern. Besides the data, there are plenty of investor conferences and even some Fedspeak on the calendar, so be on the lookout for tape bombs throughout the day.
New UK PM Liz Truss has announced a number of initiatives to help alleviate stress from surging energy prices. In a more long-term measure, she announced a lift of the ban on fracking and plans to approve more drilling for oil. In a more short-term-based measure, the new PM also announced a price cap on energy prices for consumers to take effect for the next two years. That should provide short-term relief, but the quote from Gerald Ford above should serve as a reminder – while prices may be capped, consumers will have to pay for it in some way (either through higher taxes or restrictions on the amount of energy one can use).
Investors have been able to buy and sell long-term US Treasuries via ETFs through the iShares 20+ Year US Treasury ETF (TLT) for just about 20 years now. In the first few years of the TLT’s existence, volatility in the ETF was what you would expect for a US Treasury – low. From 2003 through early 2007, the average daily move of TLT over a trailing 200-day period ranged between 0.30% and 0.70%.
Once the housing market crashed and the Financial Crisis set in, volatility in TLT surged with the average daily move breaching 1% on its way to 1.10%. As markets stabilized in 2009, volatility pulled back but never quite back down to its pre-Financial Crisis range. Then in 2011, volatility surged again as the US had its long-term credit rating downgraded in August 2011. Average daily volatility peaked in that period several months later in April 2012 and then began a multi-year decline to a range of around 0.50% per day.
Like everything else in the economy, COVID wreaked havoc on the Treasury market pushing the average daily move in TLT back up above 1%, but the exaggerated volatility was short-lived, and the market quickly returned to more stable levels by June 2021. The period of calm was just as short-lived, though. As the Fed found religion regarding inflation in late 2021 pushing long-term rates higher, volatility has once again surged. Just yesterday, the 200-day average daily move in TLT once again topped 1% for the first time since June 2020. How long this period of heightened volatility lasts remains to be seen, but if rhetoric on the part of Fed officials is to be believed, a return to calm seems a long way off.

Our Morning Lineup keeps readers on top of earnings data, economic news, global headlines, and market internals. We’re biased (of course!), but we think it’s the best and most helpful pre-market report in existence!
Start a two-week trial to Bespoke Premium to read today’s full Morning Lineup.