
The Bespoke Report — 12/16/22
This week’s Bespoke Report newsletter is now available for members. (Log in here if you’re already a subscriber.)

View this week’s Bespoke Report newsletter by starting a one-month trial, or click the image below to view our membership options page.

Daily Sector Snapshot — 12/16/22
Bespoke’s Morning Lineup – 12/16/22 – Brace Yourself, It’s Friday
See what’s driving market performance around the world in today’s Morning Lineup. Bespoke’s Morning Lineup is the best way to start your trading day. Read it now by starting a two-week trial to Bespoke Premium. CLICK HERE to learn more and start your trial.
“It isn’t what we say or think that defines us, but what we do.” – Jane Austen

Below is a snippet of content from today’s Morning Lineup for Bespoke Premium members. Start a two-week trial to Bespoke Premium now to access the full report.
A bad week just keeps getting worse as futures are continuing their post-FOMC sell-off. Heading into this week, the thought of weaker CPI and the Fed signaling a step down to 25 bps hikes at future meetings would have been considered a positive. That’s exactly what we got, but after an initial surge following Tuesday’s CPI, equities have been doing nothing but trading lower. Hawkishness from the FOMC and ECB has investors concerned that rates will be higher for longer raising the odds for a hard landing.
Well, 2022 you’ve finally done it. If there was any doubt about how bad of a year it has been, today’s decline in the S&P 500 will move 2022 into the lead for the largest number of 1% declines to close out the trading week going back to 1952 when the NYSE started the current five-trading day workweek. Heading into today, there were 15 declines of at least 1% in the S&P 500 on the last trading day of the week which was tied with 1974 and 2008 and one ahead of 2000 for the most in a single year.

Despite the record number of 1%+ declines to close out the week, the S&P 500’s cumulative decline this year on the last trading day of the week has been a decline of less than 9%. The reason is that not only has this year seen the highest frequency of 1%+ declines to close out the week, but it also tied with 1999 for the highest number of 1%+ gains (14).

All in, including today, the S&P 500 has ended the week with a gain or loss of at least 1% 30 times this year, or 60% of the time! Talk about an emotional market. And there are still two Fridays left after today!

Our Morning Lineup keeps readers on top of earnings data, economic news, global headlines, and market internals. We’re biased (of course!), but we think it’s the best and most helpful pre-market report in existence!
Start a two-week trial to Bespoke Premium to read today’s full Morning Lineup.
The Closer – Post-Fed Malaise, Industrial Drop, Housing Outperformance – 12/15/22
Log-in here if you’re a member with access to the Closer.
Looking for deeper insight into markets? In tonight’s Closer sent to Bespoke Institutional clients, we start out tonight with a look at post Fed meeting performance and the correlation between stocks and bonds (page 1). Next, we provide an update of the latest industrial production numbers (page 2) as well as update our Five Fed Manufacturing Composite (page 3). We finish with a look at homebuilders’ outperformance as well as checking in on mortgage backed securities (page 4).

See today’s full post-market Closer and everything else Bespoke publishes by starting a 14-day trial to Bespoke Institutional today!
The Bespoke 50 Growth Stocks — 12/15/22
The “Bespoke 50” is a basket of noteworthy growth stocks in the Russell 3,000. To make the list, a stock must have strong earnings growth prospects along with an attractive price chart based on Bespoke’s analysis. The Bespoke 50 is updated weekly on Thursday unless otherwise noted. There were no changes to the list this week.
The Bespoke 50 is available with a Bespoke Premium subscription or a Bespoke Institutional subscription. You can learn more about our subscription offerings at our Membership Options page, or simply start a two-week trial at our sign-up page.
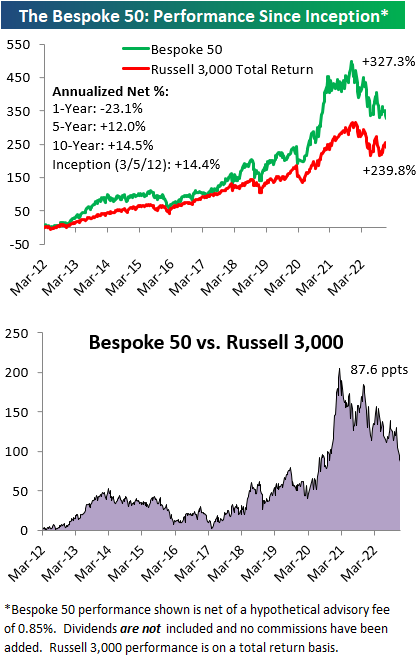
The Bespoke 50 performance chart shown does not represent actual investment results. The Bespoke 50 is updated weekly on Thursday. Performance is based on equally weighting each of the 50 stocks (2% each) and is calculated using each stock’s opening price as of Friday morning each week. Entry prices and exit prices used for stocks that are added or removed from the Bespoke 50 are based on Friday’s opening price. Any potential commissions, brokerage fees, or dividends are not included in the Bespoke 50 performance calculation, but the performance shown is net of a hypothetical annual advisory fee of 0.85%. Performance tracking for the Bespoke 50 and the Russell 3,000 total return index begins on March 5th, 2012 when the Bespoke 50 was first published. Past performance is not a guarantee of future results. The Bespoke 50 is meant to be an idea generator for investors and not a recommendation to buy or sell any specific securities. It is not personalized advice because it in no way takes into account an investor’s individual needs. As always, investors should conduct their own research when buying or selling individual securities. Click here to read our full disclosure on hypothetical performance tracking. Bespoke representatives or wealth management clients may have positions in securities discussed or mentioned in its published content.
2022 US Stock Market Snapshot
Our Bespoke Report – 2023 Outlook will soon be available for Bespoke subscribers. This report covers everything you need to know about the set-up for financial markets and the economy heading into 2023. If there’s ever a “must-read” Bespoke report, this is it!
You can read our 2023 Outlook by signing up for any of our three membership levels. You can review our membership levels here or simply start a two-week trial to one of them using the links below.
Bespoke Newsletter $49/month – Includes 14-day trial
Bespoke Premium $99/month – Includes 14-day trial
Bespoke Institutional $195/month – Includes 14-day trial

In the introductory section of our annual outlook report, we provide an in-depth breakdown of this year’s market action. Below is a snapshot of the S&P 500’s path throughout 2022. We’ll be expanding further on this chart in the full report, but this is a helpful reminder of how we got to where we are now since trading for the year began on January 3rd
With just ten trading days left in the year, the S&P is down 18.2% year-to-date, which is tracking for the worst year since the Financial Crisis in 2008. As shown below, we’ve seen huge monthly volatility throughout the year within an overall downtrend. If December’s declines hold, we’ll have seen a move of 3% or more in either direction in eleven of twelve months this year. September has (so far) been the worst month with a decline of 9.3%, while July was the best month with a gain of 9.1%. In terms of weekday performance, Mondays, Thursdays, and Fridays have averaged declines this year, while Tuesdays and Wednesdays have averaged small gains.

Bespoke’s Weekly Sector Snapshot — 12/15/22
Continuing Claims Streak Presses On
Economists were expecting this week’s initial jobless claims to show further increases showing an uptick to 232K. Instead, initial claims improved falling to 211K from 231K last week. That 20K decline was the largest decline since the week of July 23rd when it fell by 24K and brings claims to the lowest level since the end of September.

On a non-seasonally adjusted basis, claims fell to 248.88K. That is roughly in line with the levels from the comparable week of recent years (excluding 2020). Historically, claims have consistently fallen in the second week of December with declines around 90% of the time since 1969. As shown in the second chart below, the final couple weeks of the year tend to see that seasonal drop get erased as claims reverse higher into the first weeks of the new year.

Continuing claims have been more in focus lately as the seasonally adjusted number has surged. Once again this week, the count on continuing claims was higher rising to 1.671 million which was just marginally higher than the prior week.

Although it was not a particularly large increase in the latest week, adjusted continuing claims have risen or gone unchanged for nine weeks in a row. Not even during the onset of the pandemic has there been as consistent of a grind higher in continuing claims with 2009 being the last time there was a longer streak. Additionally, as we have noted with various rates of changes in continuing claims, prior long streaks without a decline have only occurred within the bounds of recession.

As with unadjusted initial claims, on a non-seasonally adjusted basis, continuing claims took a small dip as is seasonally normal for this point of the year. As for the weeks ahead, claim counts tend to have choppy seasonality which results in the historical median claims count plateauing a bit before rising into the final weeks of the year. In other words, seasonality is a little bit messy at this point of the year, so we may have to wait until the new year to get readings that are more independent of seasonal factors. Click here to learn more about Bespoke’s premium stock market research service.

Sentiment Snoozer
The data collection period for the survey mostly missed the FOMC’s rate decision and subsequent market reaction, meaning the latest readings are to some degree out of date. Regardless, the latest reading on bullish sentiment from the AAII was little changed once again at 24.3%. That was down modestly from 24.7% last week and 24.5% the week prior.

In the chart below, we show the three-week range that bullish sentiment has moved between. With only 0.4 percentage points between the high and low, the current three-week range has been the smallest on record in data going back to the start of the survey in 1987. Basically, bullish sentiment has been a complete snoozer.

While bullish sentiment has hardly moved, there have been larger shifts in the percentage of respondents reporting as bearish. Bearish sentiment has risen for three weeks straight to reach 44.6%. That is the highest level since November 10th but still handily below the multiple readings above 50% from earlier this year.

Given bearish sentiment climbed by much more than bullish sentiment, the bull-bear spread fell deeper into negative territory. In fact, the record streak of 37 weeks with bears outnumbering bulls presses on.

With bulls little changed, the rise in bears came from those formerly reporting as neutral. Neutral sentiment dropped to 31.1% from 33.5% last week. While that remains an elevated reading relative to most of the past year, it is only slightly below the historical average of 31.4%. Click here to learn more about Bespoke’s premium stock market research service.
