
Falling FAANG+
Yesterday Amazon (AMZN) became the third of the mega-cap FAANG+ stocks (along with META and NFLX) to close below its closing low made during the COVID Crash in March 2020. Not only have all of AMZN’s post-pandemic gains been erased, but it’s now trading below its lowest close made during the COVID Crash!

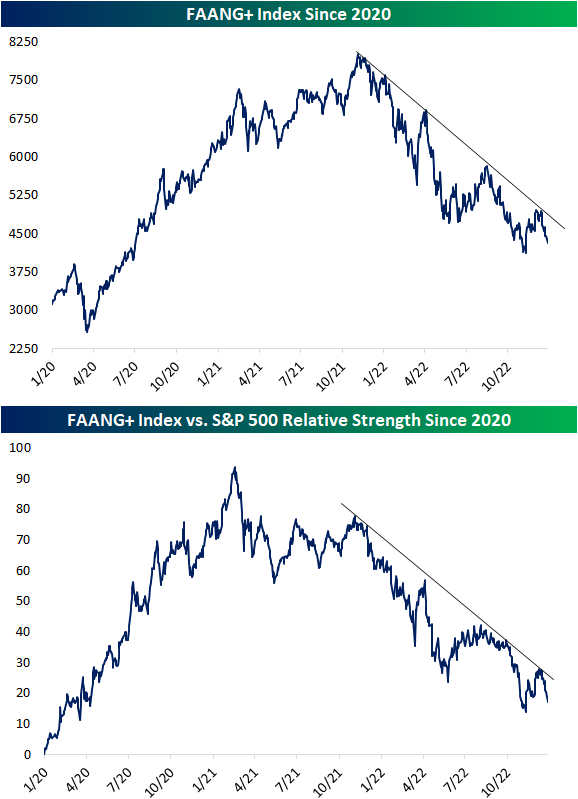
NYSE’s FAANG+ index is described as an index of “10 of today’s highly-traded tech giants.” Given that most of the FAANG+ stocks account for a massive portion of the market cap weighted S&P 500, they are an impactful group. As shown below, the FAANG+ index peaked in early November last year and has dropped 46% since then. The drop more recently follows a failed breakout above the top of its downtrend channel as the index is now back to within 5% of this past November’s low. On a relative basis, the group has been underperforming the broader market for even longer with a high in February of last year.
Below is a look at the ten FAANG+ stocks. As shown, they came into the year with a combined market cap of $12.3 trillion, and they’re ending the year with a combined market cap of just over $7 trillion. While Apple (AAPL) has fallen the least YTD in terms of share price change, it has lost the most in market cap at $844 billion. Amazon (AMZN) has seen its market cap fall the second-most at $843 billion, essentially getting cut in half. Tesla (TSLA), along with AMZN, is one of two names that lost their “$1 trillion market cap” club status this year. TSLA is now down 69% on the year, and its market cap has fallen from $1.06 trillion down to just $344 billion. The other FAANG+ stocks that are down 50%+ on the year include Meta (META), NVIDIA (NVDA), Netflix (NFLX), AMD, and Snowflake (SNOW).
With markets continuing to drop in these final trading days of December, on an absolute basis, 2022 is going to go down as the biggest year of wealth destruction ever for the US equity market. In 2008, the Russell 3,000 saw its market cap fall by $6.7 trillion. As of today, the Russell 3,000’s market cap has fallen about $11.2 trillion so far in 2022. $5.2 trillion of that $11.2 trillion decline has come from just the ten FAANG+ stocks shown below. Click here to learn more about Bespoke’s premium stock market research service.

Fixed Income Weekly: 12/28/22
Searching for ways to better understand the fixed income space or looking for actionable ideas in this asset class? Bespoke’s Fixed Income Weekly provides an update on rates and credit every Wednesday. We start off with a fresh piece of analysis driven by what’s in the headlines or driving the market in a given week. We then provide charts of how US Treasury futures and rates are trading, before moving on to a summary of recent fixed income ETF performance, short-term interest rates including money market funds, and a trade idea. We summarize changes and recent developments for a variety of yield curves (UST, bund, Eurodollar, US breakeven inflation and Bespoke’s Global Yield Curve) before finishing with a review of recent UST yield curve changes, spread changes for major credit products and international bonds, and 1 year return profiles for a cross section of the fixed income world.
In this week’s report, we review fixed income returns this year.

Our Fixed Income Weekly helps investors stay on top of fixed-income markets and gain new perspectives on the developments in interest rates. You can sign up for a Bespoke research trial below to see this week’s report and everything else Bespoke publishes free for the next two weeks!
Click here and start a 14-day free trial to Bespoke Institutional to see our newest Fixed Income Weekly now!
Bespoke’s Morning Lineup – 12/28/22 – No News is Good News
See what’s driving market performance around the world in today’s Morning Lineup. Bespoke’s Morning Lineup is the best way to start your trading day. Read it now by starting a two-week trial to Bespoke Premium. CLICK HERE to learn more and start your trial.
“I have no views as to where it will be, but the one thing I can tell you is it won’t do anything between now and then except look at you.” – Warren Buffett (discussing gold)

Below is a snippet of content from today’s Morning Lineup for Bespoke Premium members. Start a two-week trial to Bespoke Premium now to access the full report.
In case you missed it last Friday while you were out holiday shopping or stuck in an airport. We also emailed out our annual Bespoke Report which covers everything you need to know about the setup for financial markets and the economy heading into 2023. You can read it here.
In a year when all the news tended to push stocks lower, it’s nice to see a day with little in the way of news. Equity futures are higher, bond yields are lower, and WTI crude oil is trading just below $80 per barrel after failing to get back above its 50-day moving average yesterday. The only economic data on the calendar today is Pending Home Sales and the Richmond Fed report, and both of those releases are at 10 AM. A lot of people take the last week of the year off, and one group we’re more than happy to see take a break are Fed officials.
Just like any other investment ‘rule’ there are always exceptions, and when it comes to Warren Buffett’s thoughts on gold, most of the time, he would be exactly right. Who would want to own an asset that has little industrial utility and provides no upside in terms if capital appreciation or income? If you want something that just sits there, get a dog.
Every once in a while though, something that just sits there doing nothing may be the best option, and that’s been the case in 2022. With just three trading days left in 2022, the S&P 500 is down close to 20% on the year and long-term US Treasuries are also down by close to a third. Gold hasn’t escaped 2022 unscathed, but with a decline of just over 1%, it’s been the least of all evils in what has been a nasty year for asset classes of all types.

Our Morning Lineup keeps readers on top of earnings data, economic news, global headlines, and market internals. We’re biased (of course!), but we think it’s the best and most helpful pre-market report in existence!
Start a two-week trial to Bespoke Premium to read today’s full Morning Lineup.
The Closer – Window Dressing, Trade Surprise, Home Prices, Auction, CoT – 12/27/22
Log-in here if you’re a member with access to the Closer.
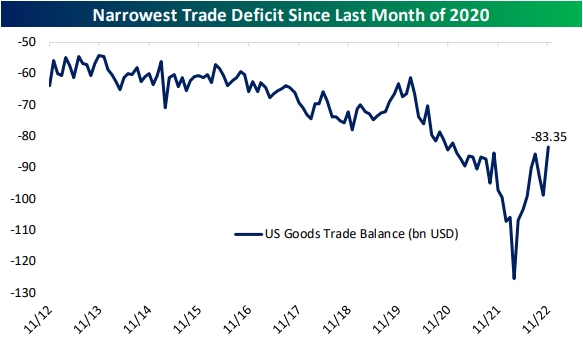
Looking for deeper insight into markets? In tonight’s Closer sent to Bespoke Institutional clients, in tonight’s Closer, we begin with a note on valuations, volumes, and a decile breakdown of today’s price action based on year to date performance (page 1). Afterward, we discuss the trade surplus figures (page 2) followed by a look at the latest inventories data (page 3). Staying on the topic of macro data, we then show the continued drop in home prices (page 4).We then recap today’s stellar 2 year note auction as well as preview the other auctions slated for this week (page 5) before finishing with a rundown of the latest positioning data (pages 6-8).
See today’s full post-market Closer and everything else Bespoke publishes by starting a 14-day trial to Bespoke Institutional today!
Daily Sector Snapshot — 12/27/22
Chart of the Day – The Pendulum Swings the Other Way
Bespoke Stock Scores — 12/27/22
Holiday Hangover
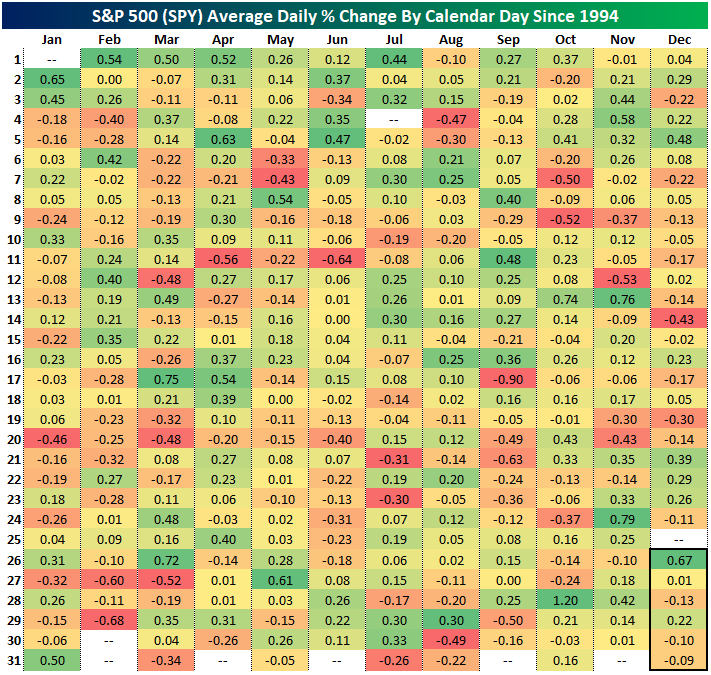
Although the S&P 500 gapped up at the open, it has traded lower throughout the morning and is on pace to fall to start out the final week of the year. As we noted last week, the final week of the year has not exactly been an overwhelmingly positive period for equities. In the table below, we show the average daily performance of the S&P 500 ETF (SPY) for each calendar day since 1994. Although December 26th has averaged the strongest gains of any day in December, this year that is a moot point with markets having been closed yesterday. As for performance through New Year’s, seasonality has been unremarkable.
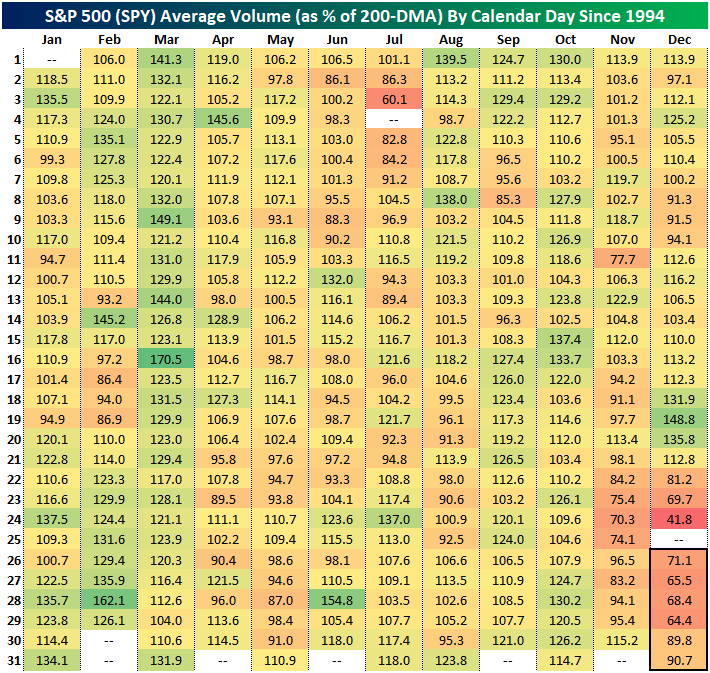
What is notable, albeit not exactly unexpected, is that this is typically the quietest period of the year. Similar to the table above, below we show the average daily reading on volumes in SPY expressed as the percentage of the 200-DMA. Since 1994, average volume in the final week of the year has been roughly two-thirds of the norm. Interestingly, those low volumes are sandwiched between what are typically elevated volumes in the days leading up to Christmas and the early days of January. In other words, from a purely seasonal standpoint, it is unlikely that the rest of the week will be overly exciting. Click here to learn more about Bespoke’s premium stock market research service.
Tesla (TSLA) Loses Its Charge
Whereas Tesla (TSLA) had been a darling of the growth trade posting gaudy returns in the first year and a half of the pandemic, since November of last year it has turned into a major pain trade. While the weakness really extends out for more than a year, only looking more recently, the stock has been in free fall and is on pace for its seventh consecutive decline in a row. As shown below, that is tied for the longest streak of consecutive declines since the IPO in 2010. The other streaks of a similar duration were in September 2018, December 2014, and January 2013, and none of those streaks extended to eight trading days. Although there is precedent for TSLA trading lower as consistently as the past week and a half, the current streak leaves the others in the dust in terms of severity. Over those past seven-day streaks, the stock never declined 14% or more, and during one of the streaks (January 2013) TSLA fell less than 7%. The decline in the stock during the current seven-day streak has been over 25%!

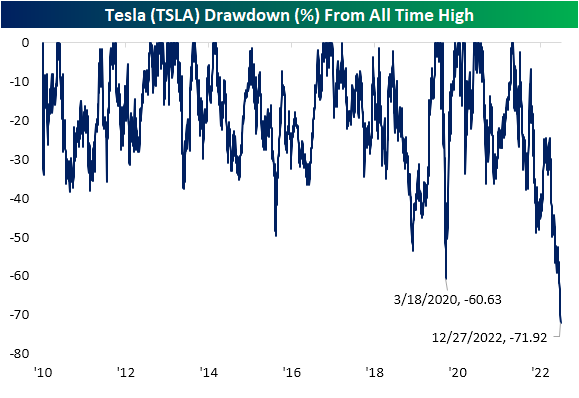
Again, that current stretch of weakness is not exactly new. Tesla has been grinding lower for over a year, and since peaking in November of last year, Tesla has seen its market cap dwindle from a high of over $1.2 trillion all the way down to only $363 billion today. The drawdown from an all-time high in the stock’s price reached nearly 72% today and is the largest in the stock’s history, surpassing the previous record drop of 60.6% during the COVID Crash in early 2020. To get back to its prior record closing high, the stock would need to rally more than 250% from current levels. Click here to learn more about Bespoke’s premium stock market research service.
Bespoke’s Morning Lineup – 12/27/22 – Easing Back into the Grind
See what’s driving market performance around the world in today’s Morning Lineup. Bespoke’s Morning Lineup is the best way to start your trading day. Read it now by starting a two-week trial to Bespoke Premium. CLICK HERE to learn more and start your trial.
“Anything worth doing is worth overdoing.” – Mick Jagger
Below is a snippet of content from today’s Morning Lineup for Bespoke Premium members. Start a two-week trial to Bespoke Premium now to access the full report.
In case you missed it last Friday while you were out holiday shopping or stuck in an airport. We also emailed out our annual Bespoke Report which covers everything you need to know about the setup for financial markets and the economy heading into 2023. You can read it here.
It’s looking like a positive day to start the week…for now. Futures are still higher but off their highs of the overnight session. It’s going to be an exceptionally quiet week for economic data and earnings. Today’s only reports are Wholesale Inventories, the FHFA House Price Index, and the Dallas Fed, and there is nothing in terms of earnings.
Bulls are hoping that today’s rally in futures marks the arrival of the Santa Claus rally where stocks advance to close out one calendar year and into the start of the next. While the last several days of trading leading into the Christmas holiday were disappointing as the S&P 500 gave up both its 200-day and 50-day moving averages, the market is basically trading right in the middle of the range it has been trading in since mid to late April. For the S&P 500 tracking ETF (SPY), the high end of that range is 430 with the low end being around 350. With a mid-point of 390, the S&P 500 is poised to open this morning just below that level at around 385. That’s the good news. The bad news is that when the S&P 500 tried to trade back above its 50-DMA last Wednesday, the rally stalled just shy of that level and that lack of momentum is a clear trait of a weak market.

Unlike SPY which can still be considered ‘rangebound’, the Nasdaq 100’s chart resembles more of a downtrend. While the lows from October are still intact, the index is still just barely 5% above its October intraday low.

Our Morning Lineup keeps readers on top of earnings data, economic news, global headlines, and market internals. We’re biased (of course!), but we think it’s the best and most helpful pre-market report in existence!
Start a two-week trial to Bespoke Premium to read today’s full Morning Lineup.