
Bulls Come Home for the Holidays
The last week of the year also brings in the last reading on investor sentiment for 2022. Perhaps a bout of new year’s optimism has overridden the negative impact of the market’s continued decline, but bullish sentiment actually rebounded up to 26.5% after spending four straight weeks below 25%. That leaves the reading right in the middle of the past year’s range.
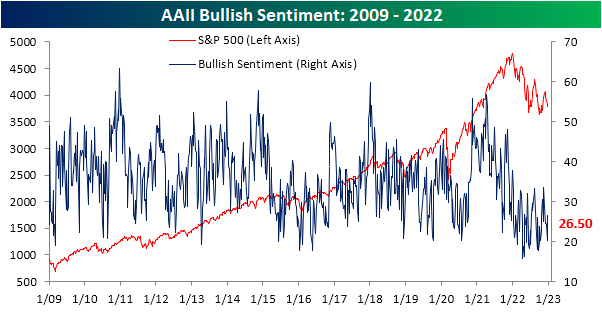
Bearish sentiment, on the other hand, fell from a recent high of 52.3% down to 47.6%. Unlike bullish sentiment, that level remains a bit more elevated. Outside of last week’s 50%+ reading, it would have been the highest reading since October 20th.

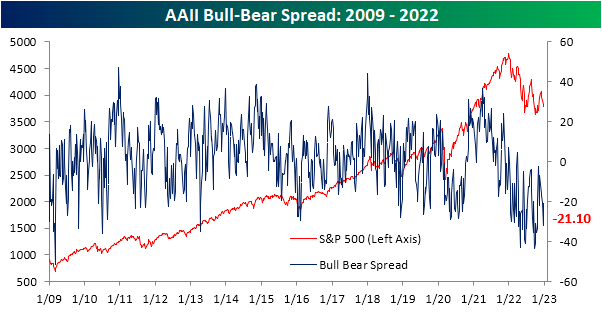
In spite of a slightly more bullish tilt, this week’s data continues to show sentiment is dominated by bears. The bull-bear spread favors bears by 21.1 percentage points; the third week in a row with a sub -20 reading.
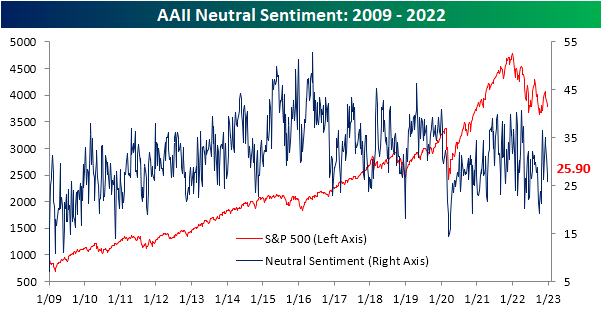
Not all of the gains to the bullish camp came from the bears. The share of respondents reporting neutral sentiment was also lower this week falling for the fourth week in a row. This week’s 1.5 percentage point drop was the smallest of that four-week span but brings the indicator to the lowest level since October 20th. Click here to learn more about Bespoke’s premium stock market research service.
2022 Solidified as the Worst Year for Sentiment
As we noted in an earlier post, today’s release of the AAII survey gives us the final reading of the year on sentiment, solidifying a number of points as to just how dour the investor outlook has been.
For starters, the bull-bear spread heavily favors bears, and that has been the case for some time now. As shown below, the spread has been negative (meaning a higher share of respondents are reporting as bearish than bullish) for a record 39 weeks in a row- over a month longer than the previous record which occurred recently in 2020.

Across all weeks in 2022, bullish sentiment averaged a reading of merely 24.73%. Since the survey began in 1987, that is a record low. In fact, the previous lowest readings were a few percentage points higher at 27.29% and 27.08% in 1988 and 1990, respectively. Meanwhile, the average reading on bearish sentiment was historically elevated at a record of 46.2%, surpassing the prior record set in 2008 by one percentage point. Prior to 2008/2009, only 1990 saw a very high average reading for bearish sentiment.

As we highlighted in an earlier tweet, given the low readings on bullish sentiment, there was not even a single week this year in which bullish sentiment came in above its historical average of 37.63%. Of course with a low share of survey respondents reporting as bullish, a larger share would be reporting as bearish. To match the impressive reading with no weeks seeing above-average bullish sentiment, nearly every week this year (51) has seen bearish sentiment come in above its historical average of 31%, tying the record high set in 2009.

As previously mentioned, bullish sentiment averaged a reading below 25% this year. Given that reading, it should come as no surprise that 2022 also saw a record number of weeks (30) with bulls below 25%. Prior to this year, 1988 (one year after the survey began) was the prior record at 23 weeks. In other words, this year there were nearly two months more in which less than a quarter of investors reported as bullish than the previous record. Additionally, there had been 17 weeks in which over half of the responses were bearish. Similar to the number of weeks in which bearish sentiment was above average, that ties 2008 for the record high. Click here to learn more about Bespoke’s premium stock market research service.

Chart of the Day – Daily Breadth Extremes on the Rise
Continuing Claims Top 1.7 Million
Initial jobless claims have not been of particular interest recently as the weekly indicator has seen choppy week-to-week moves that have yet to set any major new high or low. In the latest release, seasonally adjusted claims rose to 225K, matching expectations for the highest reading since the first week of the month. Looking at the four-week moving average to smooth out some of the choppiness, the number has fallen to 221K. This week was the third sequential decline in a row for the lowest reading since early November.

On a non-seasonally adjusted basis, claims tend to drift higher at the end of the year and into the new year. For example, the current week of the year has historically seen unadjusted claims rise week over week 90% of the time since the data begins in 1967. That seasonal drift has appeared this year but to a lesser degree as the past couple of weeks’ increase in claims has been slightly less strong than normal. Given this, claims are well below comparable readings from the years prior to the pandemic and up only slightly versus this point last year.

Continuing claims remain the more worrisome portion of the weekly jobless claims report. The reading has continued to rise rapidly as this week’s reading eclipsed 1.7 million for the first time since February.

There are plenty of ways of measuring how fast continuing claims have risen, but looking at the 3-month rate of change, claims are up over 25%. As shown below, this large of an increase has never occurred outside of a recession. Click here to learn more about Bespoke’s premium stock market research service.

Bespoke’s Morning Lineup – 12/29/22 – Almost There
See what’s driving market performance around the world in today’s Morning Lineup. Bespoke’s Morning Lineup is the best way to start your trading day. Read it now by starting a two-week trial to Bespoke Premium. CLICK HERE to learn more and start your trial.
“There is no greater sorrow than to recall in misery the time when we were happy.” – Dante Alighieri

Below is a snippet of content from today’s Morning Lineup for Bespoke Premium members. Start a two-week trial to Bespoke Premium now to access the full report.
In case you missed it last Friday, we emailed out our annual Bespoke Report which covers everything you need to know about the setup for financial markets and the economy heading into 2023. You can read it here.
There are just thirteen hours left of trading to go and then we can finally bid farewell to 2022. Futures are positive this morning, but if this year has taught us anything, it is that what happens in the futures market doesn’t often follow through to regular trading. The only economic data on the calendar this morning is jobless claims at 8:30 eastern. Initial claims were right in line with forecasts at 225K while continuing claims increased to 1.71 million, which is the highest reading since February.
Individual investor bullish sentiment increased more than five percentage points but still remains depressed at less than 26%. This week’s results also officially confirm that 2022 will be the first year in the history of the survey (since 1987) that bullish sentiment was below its historical average every week of the year.

Can it get any worse than 2022 has been for the Nasdaq? With the index making a new closing low for the year yesterday, it is very close to going wire to wire on the year with the closing high coming on the first trading day and the closing low occurring right near the last trading day.

The two charts below show when the Nasdaq has made its annual closing highs and lows for every year since 1972. Starting at the top, on average, the YTD high occurs on the 176th trading day, which works out to mid-September. In terms of individual years, the YTD high occurs in Q4 nearly 60% of the time and in Q1 just 18% of the time. Furthermore, there have only been five other years where the YTD high occurred in the first two weeks, and 2008 was the only other year that the YTD high was on the first trading day of the year.
Shifting focus to the YTD low, on average, it occurs on the 90th trading day of the year. Even more notable, though, is the fact that there have only been four other years where the Nasdaq’s YTD low occurred in the final two weeks of the year (2022, 2018, 2000, and 1973). Those are also the only four years in the Nasdaq’s history where it made its YTD closing low in December. In other words, 2022 has been rare in terms of both the timing of the YTD high and YTD low.
Looking at the charts, you’ll also notice that the only other year with a similar setup where the Nasdaq made its YTD high in the opening two weeks of the year and its YTD low in the final two weeks was in 1973. In 1973, the YTD closing low occurred 239 trading days after the YTD closing high, but this year it will be at least 248 trading days separating the two.

Our Morning Lineup keeps readers on top of earnings data, economic news, global headlines, and market internals. We’re biased (of course!), but we think it’s the best and most helpful pre-market report in existence!
Start a two-week trial to Bespoke Premium to read today’s full Morning Lineup.
The Closer – Gas Returns to Normal, HYG Outperformance, 5 Fed, 5y Auctions – 12/28/22
Log-in here if you’re a member with access to the Closer.
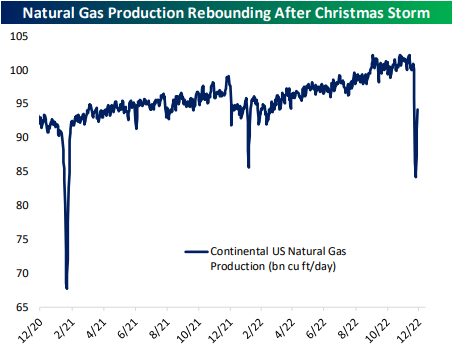
Looking for deeper insight into markets? In tonight’s Closer sent to Bespoke Institutional clients, we begin tonight with a checkup on natural gas production (page 1) followed by a look at high yield bond outperformance (page 2). Turning to macro data, we provide a final update of our Five Fed Manufacturing Composite (page 3 -5) before closing out with a recap of today’s 5 year note auction (page 6).
See today’s full post-market Closer and everything else Bespoke publishes by starting a 14-day trial to Bespoke Institutional today!
Daily Sector Snapshot — 12/28/22
Country ETFs in 2022
Earlier today we published our Global Macro Dashboard which provides an overview of the main economic and market data of 22 major global economies. In the table below, we show the recent performance of the ETFs tracking those same countries.
With 2022 drawing to a close, there are only two countries that are currently in the green for the year: Brazil (EWZ) and Mexico (EWW). Neither are up much, but up is up, especially in a year like this one.
In terms of month-to-date change, Hong Kong (EWH) has risen the most with a 5.62% gain, while China (MCHI) is up a modest 0.46%. On the other end of the spectrum, Taiwan (EWT) has fallen sharply with an over 20% decline, but most of that drop is actually due to a $5.18/share long-term capital gain that the fund paid out earlier this month. Click here to learn more about Bespoke’s premium stock market research service.

Chart of the Day – Inflation Melting (Slowly)
Bespoke’s Matrix of Economic Indicators – 12/28/22
Our Matrix of Economic Indicators provides a concise summary analysis of the US economy’s momentum. We combine trends across the dozens and dozens of economic indicators in various categories like manufacturing, employment, housing, the consumer, and inflation to provide a directional overview of the economy.
To access our newest Matrix of Economic Indicators, start a two-week free trial to either Bespoke Premium or Bespoke Institutional now!
