Claims Collapses Citi Surprise Index
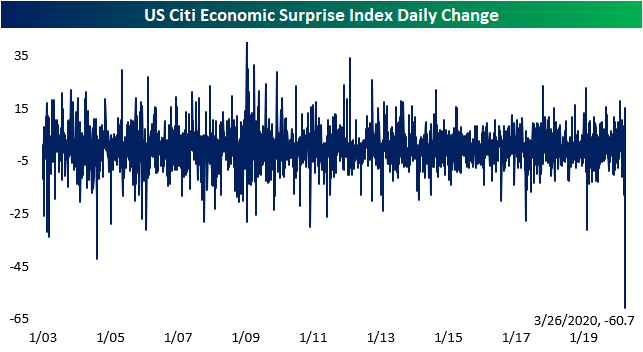
The economic impacts of COVID-19 have begun to appear in the past few weeks’ data releases. Given that these impacts have been decidedly negative, the Citi Economic Surprise Index for the US has turned sharply lower. This index measures how economic data comes in relative to forecasts. Rising or positive numbers indicate more releases are beating expectations and vice versa. On March 13th the index peaked, reaching its highest level since early 2018 at 73.8. It then pulled back off of those highs but was still fairly high in the low 60s all the way up until last Wednesday. But it then fell out of bed dropping to -1.5 today.

Given the index weights various releases differently, most of the blame for that decline can be put on last Thursday’s initial jobless claims number. Thanks to the massive miss, from Wednesday to Thursday the index fell from 61.7 all the way to 1. While that did not drop the index itself to any new low as it is now back to similar levels as the start of the year, that one day decline was the largest ever as shown in the chart below. Start a two-week free trial to Bespoke Institutional to access our interactive economic indicators monitor and much more.
Country ETF Performance After COVID Crash
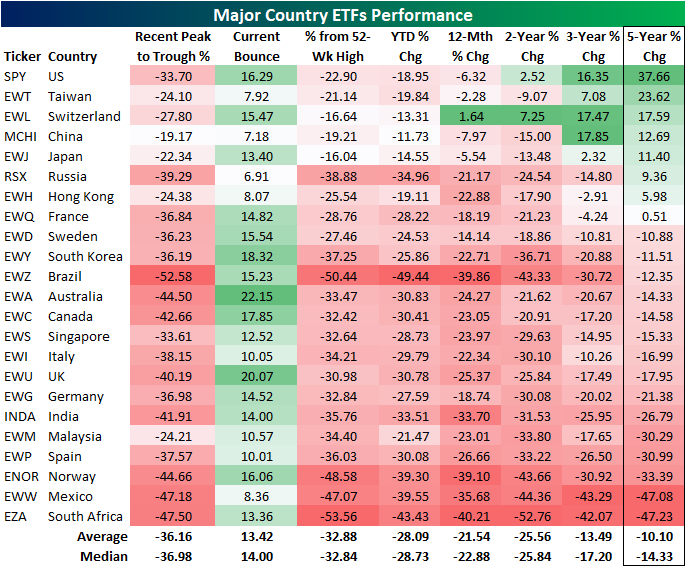
We track 23 major country ETFs traded on US exchanges closely. Below is a look at their performance numbers over multiple periods. We first show how much each country ETF fell from its most recent peak to its most recent trough during the initial COVID market crash. We also show how much each country has bounced off of its recent low. We then show its distance from its 52-week high, its year-to-date change, and its 12-month, two-year, three-year, and five-year change.
The average country ETF crashed 36% from its recent peak to trough, and the average bounce back so far has been +13%. Brazil (EWZ) remains the furthest below its 52-week high at -50%, while Japan (EWJ) is the closest to its 52-week high at -16.04%. The average country ETF is 32.9% from its 52-week high.
On a year-to-date basis, Brazil (EWZ) is down the most at -49%, while China (MCHI) is down the least at -11.7%. Switzerland (EWL) is the only country that is up over the last 12 months, while the US (SPY) is down 6.3% over the same time period. South Africa (EZA) and Brazil (EWZ) are down the most year-over-year at -40%.
Notably, returns now look very weak around the world on a two, three, and five year basis. The average country ETF is down 25% over the last two years, down 13.5% over the last three years, and down 10% over the last five years. More than half of the country ETFs are down more than 10% over the last five years, with countries like Spain (EWP), Norway (ENOR), Mexico (EWW), and South Africa (EZA) are down more than 30%. The US (SPY) is by far the best performer over the last five years with a gain of 37.66%. Start a two-week free trial to Bespoke Premium to see our list of “Stocks for the COVID Economy.”
Declines Bigger In Texas
Over the past couple of weeks, we have been highlighting the record declines in the regional Federal Reserve banks’ manufacturing indices for the month of March (see here and here). The most recent of these indices, from the Dallas Fed, was released this morning, and results were as bad as the others. The headline reading fell to -70 from 1.2 last month. That is a record low for business activity eclipsing even the 2009 lows and was by far the largest month over month decline in the history of the survey (second chart). As for expectations six months later, the index fell to 39.5 from 18 which is likewise the largest decline on record. That leaves expectations at their lowest level since December of 2008.


That weak headline number comes on weakness across all of the individual components of the report. Many of these categories also experienced record declines which has completely changed the picture just a month ago. Last month, there were only three components across both current condition and six month outlook indices that were negative. Today there are only two (wages and benefits), and both of these have fallen dramatically.
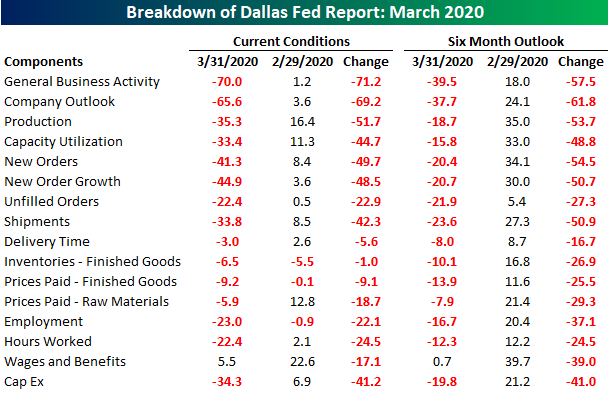
In this month’s survey, the Dallas Fed surveyed respondents on a number of COVID-19 related questions. Over three-quarters of respondents reported a negative impact on production and sales as a result of the virus while 67.5% reported weaker demand. The subindices echo these results. Each of the categories tracking demand like new orders, unfilled orders, and shipments fell dramatically in March as shown below. New orders (both current and the six-month outlook) experienced the largest decline on record. That leaves the index for current conditions at its lowest level since 2009 and the index for future expectations at its lowest level on record. The indices for unfilled orders are also at their lowest level since the financial crisis after experiencing the second-largest decline on record for the current conditions index and the largest decline ever for expectations. Given this lack of demand, shipments have also plummeted by an unprecedented amount.

It should come as no surprise following last week’s jobless claims number, but as with so many other components of this month’s survey, the indices for unemployment have also collapsed experiencing the largest declines ever. Both current conditions and future expectations indices are now at their lowest levels since 2008/2009. Start a two-week free trial to Bespoke Institutional to access our interactive economic indicators monitor and much more.

This Week’s Economic Indicators – 3/30/20
US economic data is beginning to show adverse effects from the coronavirus with several indicators doing so in dramatic fashion. About half of last week’s 30 releases came in worse than expected or than the prior period. Bloomberg’s weekly consumer comfort was one of the first releases of the week out on Tuesday. The headline index fell from 63.0 to 59.7, its largest one week decline since August of 2007. Markit’s preliminary PMIs for the month of March were released at the same time on Tuesday. While the reading on manufacturing did not fall as much as expected, it still came in with a contractionary reading which was also the weakest on record. The services counterpart on the other hand fell to 39.1 which was worse than the consensus forecast of 42 as well as a record low. MBA’s weekly mortgage applications came out the next morning falling 29.4% week-over-week; the largest decline since 2009. That was just a couple weeks after one of the strongest readings on record. Preliminary durable and capital good numbers were also released on Wednesday with core measures all showing declines in February. The biggest release of last week which we discussed on Thursday was jobless claims which more than doubled expectations of 1.5 million claims.
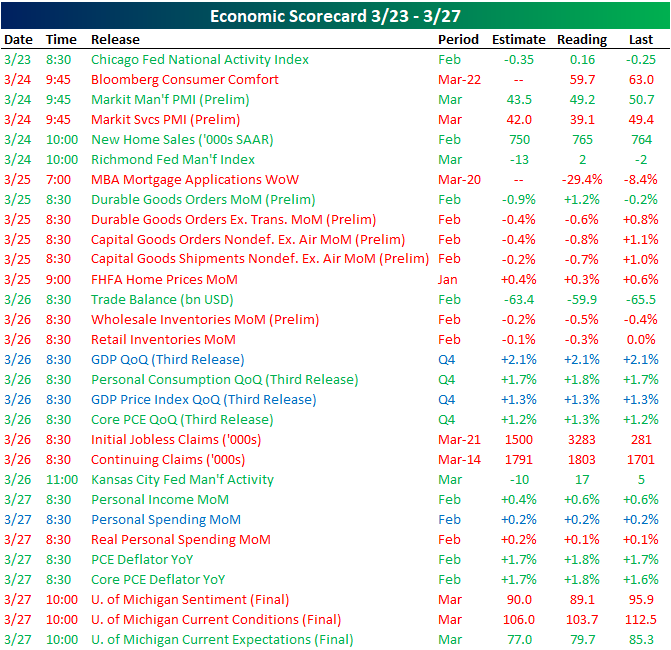
Turning to this week, we are likely to see more large swings in economic data as more February and March prints continue to come in. The Dallas Fed’s reading on the manufacturing sector and pending home sales were both out earlier this morning. While pending home sales held up reasonably well in February, the Dallas Fed’s index for March plummeted to a record low of -70. If Bloomberg’s weekly readings have been any indication, consumer sentiment as seen through the Conference Board’s indices is likely to take a major hit when they are released tomorrow morning. Forecasts are currently predicting a reading of 110 for the headline number which would be the sixth largest MoM decline on record. Following weak preliminary readings last week, final Markit numbers for March will also be out later this week with further declines penciled in. ISM’s manufacturing and non-manufacturing indices are also due out the same days. Labor data will once again be a hot topic this week with jobless claims once again expected to read in the millions. Additionally, the Nonfarm payroll number on Friday is expected to show the first negative reading in nearly a decade. Start a two-week free trial to Bespoke Institutional to access our interactive economic indicators monitor and much more.

Why Is The VIX So High?
With the equity market surging last week, seeing VIX close little-changed versus the prior Friday may have been confusing for some investors. But keep in mind that VIX is a measure of volatility, not just an inverse market index. In other words, it’s not just crashing down that sends the VIX higher but also crashing up. Generally, the realized volatility of the market and its level are inversely correlated in the short-term, so that big declines drive the VIX higher while grinding rallies send it plunging. But last week the S&P 500 moved at least 2.9% on four of five days…even though it gained over 10% on the week. That still-high realized volatility is why options markets that the VIX measures are still pricing high implied volatility. To illustrate this relationship, the chart below shows the average absolute percent change move (so big up and down days are counted the same) on a rolling two-week basis versus the VIX. Through Friday, the level of realized volatility (absolute changes in the market) and implied volatility (the VIX) were pretty consistent. Start a two-week free trial to Bespoke Premium to see our list of “Stocks for the COVID Economy.”

Tracking COVID-19 Across States
With the United States now the single-largest country for COVID-19 confirmed cases at 143,055 (as-of this writing), keeping track of state-level breakouts is becoming increasingly important for tracking the evolution of the disease globally. In the table below, we show statistics by state that include: deaths, change in deaths day-over-day, cases, change in cases day-over-day, tests, and the change in tests day-over-day in both raw numbers and adjusted for state population. We also show the percentage of tests that come back positive, as a percentage of new tests that day.
There’s a huge amount of diversity across states both in terms of the severity of outbreaks (deaths), best-guesses at size and growth (cases and case growth), and state response (test count growth). That’s true both on a raw basis and adjusted for population. New York looks by far the worst based on both absolute and per capita outbreak numbers, but it’s testing a lot of people. Unfortunately, almost half of the tests are coming back positive, which is not an encouraging sign in terms of stemming the outbreak. The opposite sort of state is Hawaii, which has had no deaths, only 150 confirmed cases and has seen only 1.2% of tests come back positive despite testing almost twice as many people per capita as California and running new tests at a per capita rate twice that of New York. Start a two-week free trial to Bespoke Premium to see our list of “Stocks for the COVID Economy.”

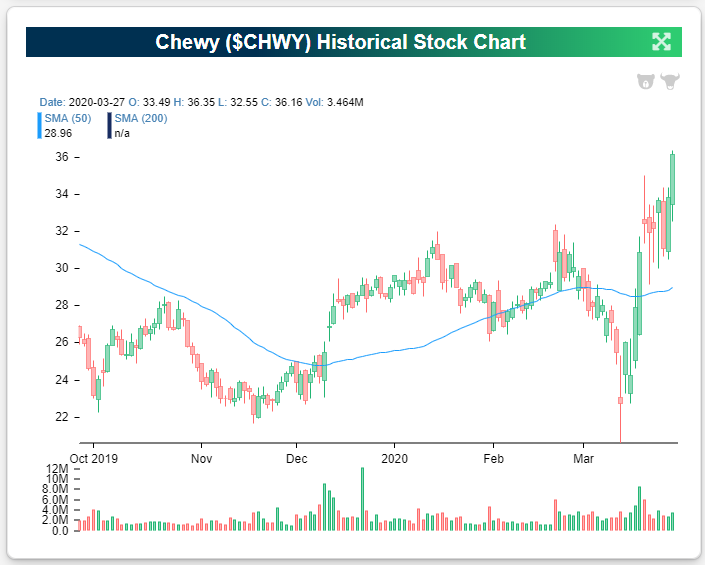
Chewy (CHWY) Breaks Out
Online pet store Chewy (CHWY) is one of our “Stocks for the COVID economy.” Consumers still have to feed and tend to their pets even during a pandemic, and instead of going to the pet store, online delivery is the new norm. Who knows how many customers Chewy has added over the last month or so, but we’d guess it’s a lot. And with a platform that allows for “auto-ship” of products on a regular basis, we’d also guess that these new customers will be sticky.
CHWY fell 36% from a high in late February to its recent low in mid-March. Since making that intraday low on March 12th, however, the stock is up 76.5%, and it broke out to a new high last Friday. Start a two-week free trial to Bespoke Premium to see our list of “Stocks for the COVID Economy.”
Massive Moves for Homebuilder Stocks
Below is a snapshot of major US homebuilder stocks run through our Trend Analyzer tool. Our Trend Analyzer shows both the year-to-date percentage change for each stock as well as its 5-day percentage change.
Incredibly, a major homebuilder like KB Home (KBH) rose 48.35% last week, but it’s still down 47.5% year-to-date. M/I Homes (MHO) is up 41.28% over the last week but is still down 53.3% year-to-date. You see similar numbers up and down the list. And even after a huge rally last week, every homebuilder on the list is still 20% below its 50-day moving average or more. Toll Brothers (TOL) is another name that is still down nearly 50% year-to-date even though it rallied 37% last week. Ahead of the open this morning, TOL is trading 42.75% below its 50-day moving average. Start a two-week free trial to Bespoke Premium to use our Trend Analyzer across the spectrum of US stocks and ETFs.

Bespoke’s Morning Lineup – 3/30/20 – A Quiet Monday
See what’s driving market performance around the world in today’s Morning Lineup. Bespoke’s Morning Lineup is the best way to start your trading day. Read it now by starting a two-week free trial to Bespoke Premium. CLICK HERE to learn more and start your free trial.
Here’s one we haven’t seen in a long time. The S&P 500 and Nasdaq are both poised to open within 0.10% of their close on Friday. While global equities have been uncharacteristically stable this morning, crude oil is still experiencing extreme volatility and briefly traded below $20 to its lowest level in 17 years.
Read today’s Bespoke Morning Lineup for a discussion of the latest trends and statistics of the outbreak, overnight moves in the market, and a great state by state summary of the latest Covid-19 trends in the United States.

While things are far from certain, one encouraging trend we have seen in recent trends related to the Covid-19 outbreak is that the day over day percent change in global case counts and deaths has shown signs of starting to flatten from the mid-single digits to the low single digits. Due to the fact that the decline came on a Sunday (we saw similar declines on prior Sundays), we would caution against reading too much into this, but in a world where we’re grasping at straws for signs of hope, this one is worth watching. While global trends are slowing, as noted in this morning’s report, US trends have still shown no similar signs of improvement.

Bespoke Brunch Reads: 3/29/20
Welcome to Bespoke Brunch Reads — a linkfest of the favorite things we read over the past week. The links are mostly market related, but there are some other interesting subjects covered as well. We hope you enjoy the food for thought as a supplement to the research we provide you during the week.
While you’re here, join Bespoke Premium for 3 months for just $95 with our 2020 Annual Outlook special offer.
Coronavirus Op Eds
The Real Miami by Udonis Haslem (The Players’ Tribune)
A moving and concise statement of principles from Miami native Udonis Haslem calling attention to the unique challenges posed by COVID-19 for lower income communities. [Link]
How Long Will the Coronavirus Lockdowns Go On? by Scott Gotlieb (WSJ)
Testing, studies to identify blood antibodies, and novel medications can all help get the US outbreak of COVID-19 contained and life back towards normal. [Link; paywall]
Corona-nomics
Don’t ‘Reopen’ the Economy. Don’t Let It Crash. Put It on Ice. by Matthew C. Klein (Barron’s)
An argument that the best economic policy for addressing the COVID-19 outbreak is full underwriting of all business revenues by the Treasury for the duration. [Link; paywall]
Longer-run economic consequences of pandemics by Oscar Jorda, Sanjay R. Singh, and Alan M. Taylor (FRBSF Working Papers)
The authors look to history for insight into likely macroeconomic consequences of the current pandemic, concluding a large downward adjustment for the real interest rate lasting approximately 3 decades and a substantial increase in real wages over that period. Notably major wars tend to have the opposite effect. [Link; 15 page PDF]
Pandemic Pups
Dogs being trained to sniff out COVID-19: charity (Yahoo!/AFP)
Trainers working with Medical Detection Dogs and two British schools will test whether dogs can detect the coronavirus; canines have proven adept at detecting malaria in the past. [Link]
Newest Shortage in New York: The City Is Running Out of Dogs to Foster by Bailey Lipschultz and David R. Baker (Bloomberg)
One of the happiest consequences of millions of New Yorkers being locked in their homes: shelters are being cleared of dogs as lonely lockdowns inspire adoptions and fosters that have basically emptied shelters in the city. [Link; auto-playing video]
Americans are panic buying food for their pets by Nathaniel Meyersohn (CNN)
Dog and cat food sales are soaring as consumers stockpile supplies of chow for their companions along with canned and frozen food for themselves. [Link]
Pandemic Labor
Instacart’s Gig Workers Are Planning a Massive, Nationwide Strike by Lauren Kaori Gurley (Vice)
As demand has surged thanks to stay-at-home orders, delivery service workers are organizing a national wildcat strike Monday in an effort to get hazard pay, hand sanitizer, and paid leave amidst the worst pandemic in a century. [Link]
Perdue workers walk off production line in Georgia over coronavirus safety measures by Matthew Prensky (Delmarva Now)
Dozens of workers at a chicken plant in Georgia walked off the job this week in order to protest working conditions and their possible exposure to coronavirus in their workplace. [Link; auto-playing video]
Migrant Farmworkers Whose Harvests Feed Europe Are Blocked at Borders by Liz Alderman, Melissa Eddy, and Amie Tsang (NYT)
Seasonal workers that are the backbone of harvests across Europe won’t be able to pick fruit and vegetables given lockdowns on travel thanks to COVID-19, leaving farms wondering how to get food out of the fields. [Link]
Viral Media
The Evening News Is Back (DNYUZ)
Looking for basic information about the state of the world amidst a massive pandemic, TV watchers have flocked to the nightly news on broadcast channels, driving audience numbers to 20 year highs. [Link]
South Korea drive-in cinemas enjoy sales boom over virus fears (Yahoo!/AFP)
With Koreans taking social distancing very seriously, drive-in theaters are a convenient way to watch a movie without risk of creating a disease cluster. [Link]
The Bad News
11 Million in U.S. at Serious Risk If Infected With COVID-19 by Dan Witters and Sangeeta Agrawal (Gallup)
Using the prevalence of diseases which can raise severity of COVID-19, Gallup has estimated that about 4.5% of the population is likely to be in deep trouble if they contract the disease. [Link]
What It Looks Like From Space When Everything Stops by Eric Roston (Bloomberg)
A rundown of high-traffic areas around the world that are basically empty at the hands of the COVID-19 outbreak. [Link]
Epidemic Italy
February Champions League Soccer Match in Italy Now Described as a “Biological Bomb” by Elliot Hannon (Slate)
When 40,000 residents of Bergamo visited Milan for a soccer match, they unintentionally brought back a huge wave of viral infections which the beleaguered city is still trying to get a grip on. [Link]
Family Is Italy’s Great Strength. Coronavirus Made It Deadly. by Margherita Stancati (WSJ)
A higher share of families with multiple generations living under the same roof has made Italy uniquely at risk for a catastrophic toll from COVID-19. [Link]
The real death toll for Covid-19 is at least 4 times the official numbers by Claudio Cancelli Luca Forest (Corriere Della Sera)
The epicenter of COVID-19’s impact on Italy likely has many more COVID-19 deaths than have been officially reported, with 5 times as many deaths as would be typical for this time of year versus twice as many based on official reports of viral deaths. [Link]
Market Mayhem
Poof! Legendary Ronin Capital Disappears (UPDATED) by Paul Rowady (Alphacution)
Some details around proprietary trading firm Ronin Capital’s blow-up and the collateral damage it caused across markets. [Link]
RBC Seeks Fire-Sale Buyers for Seized Mortgage Debt by Liz Hoffman and Gregory Zuckerman (WSJ)
The US branch of Canada’s largest bank seized assets from a client that had financed the bonds via repo facing RBC, prompting margin calls and eventually a forced unwind with RBC taking ownership of the portfolio to cover its loans to a mortgage REIT. [Link; paywall]
Retail Revolution
Inside the Story of How H-E-B Planned for the Pandemic by Dan Solomon and Paula Forbes (Texas Monthly)
Iconic Texas grocer H-E-B (we highly recommend the fresh tortillas) has introduced a range of policies and strategies to protect customers and meet massive demand for staples amidst pandemic stockpiling. [Link]
U.S. Retailers Plan to Stop Paying Rent to Offset Virus by Lauren Coleman-Lochner, Natalie Wong, and Edward Ludlow (Bloomberg)
With revenues falling off a cliff, businesses are slashing payrolls and also daring landlords to kick them out and try to replace solid leases which may suffer only a month or two of disruption. [Link; soft paywall, auto-playing video]
Lux Life
Swiss hotel offers luxury quarantine package including $500 coronavirus test by Natalie B. Compton (The Seattle Times)
Very wealthy clients can access in-room testing, doctor visits, and nurse care at Le Bijou in a range of properties across Switzerland. [Link; soft paywall]
Possible Solutions
Coronavirus: Singapore app allows for faster contact tracing by Hariz Baharudin and Lester Wong (Straits Times)
Anonymized data on proximity and duration of contacts who may have had exposure to the coronavirus is offering a possible technical solution to the problem of contact tracing exposures related to the COVID-19 crisis. [Link]
Arizona man dies after self-medicating to prevent COVID-19 coronavirus (12News)
After hearing exhortations from the President to use chloroquine to treat COVID-19, a couple in Arizona was hospitalized (one died) after taking a related compound. [Link; auto-playing video]
Read Bespoke’s most actionable market research by joining Bespoke Premium today! Get started here.
Have a great weekend!