
Existing Home Sales Blow The Doors Off
The housing market continues to blow the doors off, with total annualized existing home sales coming in at a rate of 6.85mm in October, including 6.12mm single family units. Those numbers are only 5.7% and 3.5% respectively below the record levels from the housing bubble of the mid-2000s. Check out the enormous numbers recently in the chart below:

Unlike during the prior housing bubble, inventories are extremely low now both on an absolute basis (down 20% YoY for all homes and 23% YoY for single family) and relative to demand; both total existing and single family home inventories are below 2.4 months of demand. Inventories relative to demand are half of what they were at the last housing market peak on a months’ supply basis.
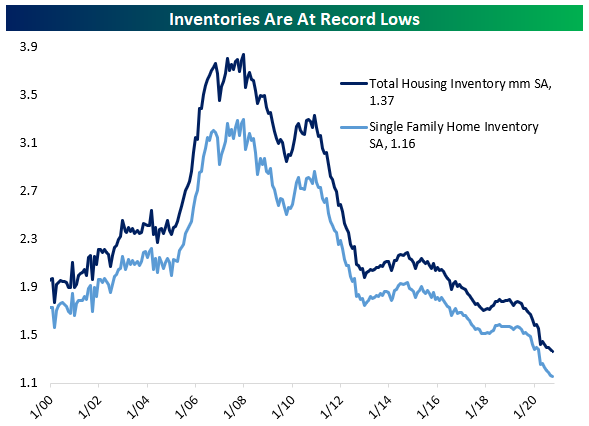
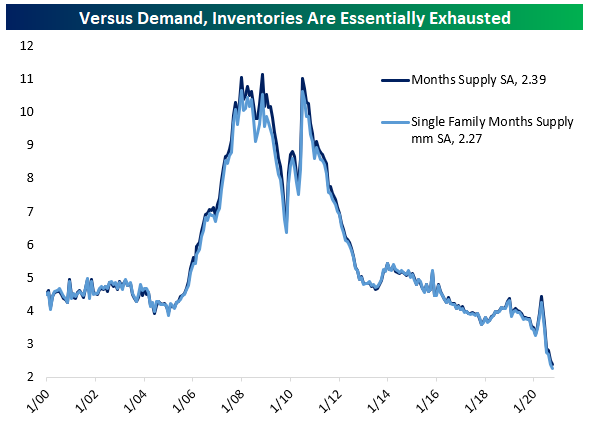
With so much demand for homes and so little supply, prices have exploded higher in the past few months. After adjusting for seasonality, prices are up a staggering 15% since the May lows, driven by both strong demand and a shift in mix towards higher-priced homes. This analysis was initially published in our post-market daily note The Closer. Click here to start a free trial to Bespoke Institutional and receive our Closer report and much more for the next two weeks, featuring more commentary and data on macro markets.

Bespoke’s Morning Lineup – 11/20/20 – Indecision
See what’s driving market performance around the world in today’s Morning Lineup. Bespoke’s Morning Lineup is the best way to start your trading day. Read it now by starting a two-week free trial to Bespoke Premium. CLICK HERE to learn more and start your free trial.
“I used to be indecisive but now I am not quite sure.” – Tommy Cooper
Depending on the index, futures are trading at either end of the flatline this morning, but that’s an improvement over where things stood last night. Following Treasury’s decision last night for the FOMC to returns funds from the emergency lending programs, futures initially traded lower, but shortly after the open in Asia, sentiment started to improve, and the losses were steadily erased.
In terms of data today, there’s nothing besides COVID to speak of as the economic calendar is blank and there’s very little in the way of earnings reports. With next week being Thanksgiving, maybe the market will have a few quiet days ahead of it. Or then again, maybe not!
Be sure to check out today’s Morning Lineup for a rundown of the latest stock-specific news of note, economic data in Japan, trends related to the COVID-19 outbreak, and much more.

While it seems like there has been a lot going on in the markets for the last two weeks, the reality is that we’ve essentially been rangebound. Below we show the intraday charts of the S&P 500 and Nasdaq over the last 15 trading days. Beginning with Pfizer’s positive vaccine news before the open on 11/9, the S&P 500 and Nasdaq have essentially been on a treadmill with a number of swings up and down, but really nothing to show for any of it.
Investors just can’t seem to make up their minds at this point between placing more emphasis on the shorter-term concerns on the impact of rising case counts or the positive long-term impacts of viable vaccines. Decisions. Decisions. One thing we are sure of is that there’s nothing wrong with some healthy consolidation to digest the big gains from earlier in the month and work off overbought conditions in the process, so this is perfectly normal.


KC Fed Decelerating
The second regional Fed release this morning came from the Kansas City Fed. Whereas the Philly Fed handily beat expectations, the 10th District’s headline reading matched expectations with a 2 point decline to 11. Similar to the Philly Fed report, expectations for six months in the future were also slightly lower this month.

Breadth across categories was on the weak side with more than half of the categories falling from October to November. While many of these indices fell from last month, they are still consistent with growth, just at a slower rate than October. The indices for expectations were also broadly lower across categories.

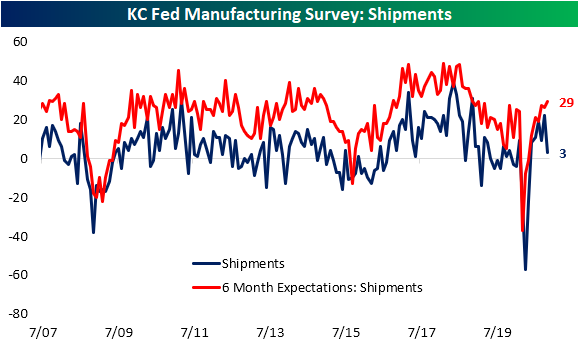
One of the most dramatic declines of the various categories of the report concerns shipments. While still consistent with overall growth in shipments, the November reading did mark a significant deceleration as the index fell 19 points to 3. That decline was in the 6th percentile of all monthly changes, and the new level is in the bottom third of the historic range after sitting in the top decile last month. Despite that weakness in shipments, production and new orders have held up much better, albeit they also fell this month. Not all new orders have held up though. New orders for exports were notably weak as the index showed a contractionary reading in the bottom decline of all readings.

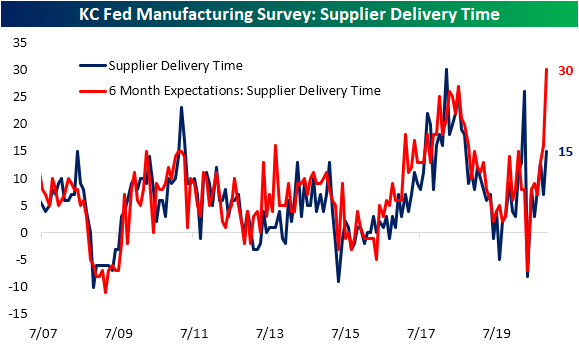
There is some evidence that supply chain issues could have played a role in that decline in shipments. The index for supplier delivery times gauges how long it takes for products to be delivered. Higher readings indicate longer lead times and vice versa. The current conditions index experienced a sizeable increase of 8 points to a reading of 15 this month. That is the highest reading since the huge spike higher in the spring, and the month over month increase was in the top decile of all monthly moves for the index. An even more notable move came from the index for expectations. This index nearly doubled coming in at a record high of 30. Only June of 2006 has seen a larger one month increase—18 points versus 14 today—in this index. In other words, while current lead times were in fact longer, reporting firms seem to see bigger issues on the horizon and could be related to the number of rising COVID cases in the region.
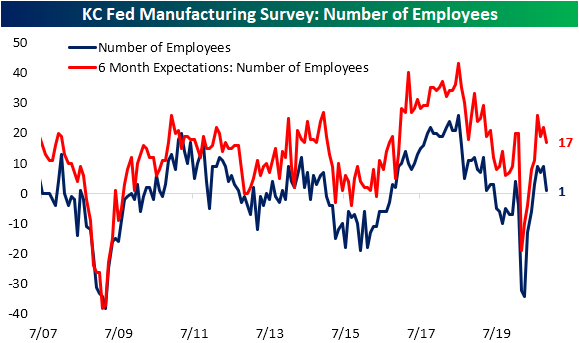
Whereas employment metrics were a bright spot for the Philadelphia Fed, in Kansas City’s district hiring decelerated to a barely expansionary reading of 1. Expectations for future hiring were also lower. The index for average workweek did provide a bit of a silver lining though as it rose to its highest reading since September of last year. Click here to view Bespoke’s premium membership options for our best research available.

Third District Thriving
In the big slug of economic data released today were two regional Federal Reserve bank readings on their districts’ manufacturing sector. The first and perhaps stronger of the two came out of Philadelphia. The headline number fell to 26.3 from 32.3, but that was better than a more aggressive downside forecast for a drop down to 22.5. While the headline index declines, it is still indicative of further growth to business conditions in the third district.

In addition to the headline number, every other category of the report pointed to expansionary activity in November with some currently in the top percentile of all readings throughout the history of the report going back to May of 1968. Breadth was a bit mixed, though, as four of the ten current condition indices fell from last month. In terms of future expectations, breadth was even weaker as seven of the eleven indices declined. For the headline index, the 18.4 point decline in expectations was in the bottom 3% of all readings. Overall, despite some deceleration in certain areas and a generally weaker outlook, the report pointed to further improvements in the district’s manufacturing sector.

Beginning with demand, the current conditions indicator for new orders remained positive around some of the strongest levels of the past several decades even after a 4.7 point decline. This means that fewer companies reported increases in orders in the month of November but nonetheless, a large share are still seeing growth in orders. Unfilled orders have also surged as that index climbed 13.9 points to 22.2. That is the highest level since March of 1973 and the month over month gain is in the top 5% of all monthly moves.

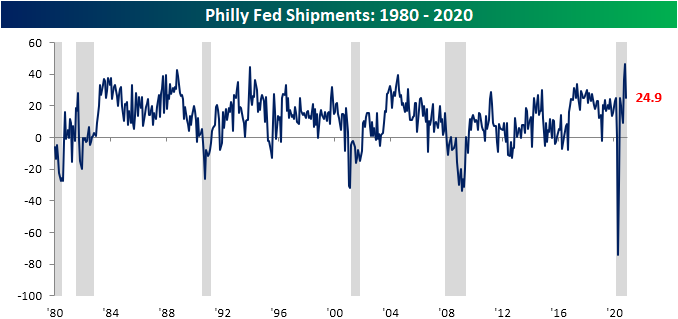
As unfilled orders have climbed dramatically, shipments have declined dramatically. This index fell 21.6 points this month which was the largest month-over-month decline since March and April. Outside of those declines, April of 2016 was the last time shipments had fallen by as much or more. Despite that decline, the index remains at healthy levels at the top end of the past few year’s range.
One of the most welcome changes in the report this month was employment-related. The index for the number of employees climbed to 27.2 this month. That is the highest level since July of last year and the increase this month was in the 98th percentile of all months. Meanwhile, the average workweek also picked up, rising to its highest level since May of 2018.

With demand strong and people returning to work, both prices paid and received have continued to accelerate. Prices Paid rose to the highest level in two years while prices received reached the highest level since February of last year. Click here to view Bespoke’s premium membership options for our best research available.

Continuing Claims Back Below The Pre-Pandemic Record High
Last week saw initial jobless claims come in at a new pandemic low of 709K which was closing the gap on the pre-pandemic record of 695K from October of 1982. Not only was that reading revised higher by 2K to 711K, but this week’s print rose to 742K missing expectations of a further decline down to 705K. That is the first time that claims have risen week over week since the week of October 9th. Granted, this week’s increase is not that significant as it is only at the highest level since two weeks ago (10/30), and it is still 15K below that week’s revised reading of 757K.
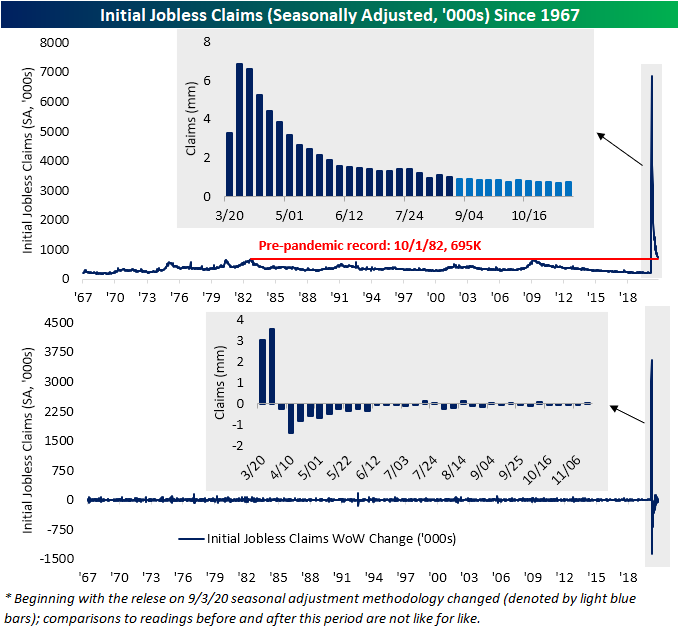
On a non-seasonally adjusted basis, claims were likewise higher rising from 725K to 743K. That brings it right back to almost exactly where things stood two weeks ago.

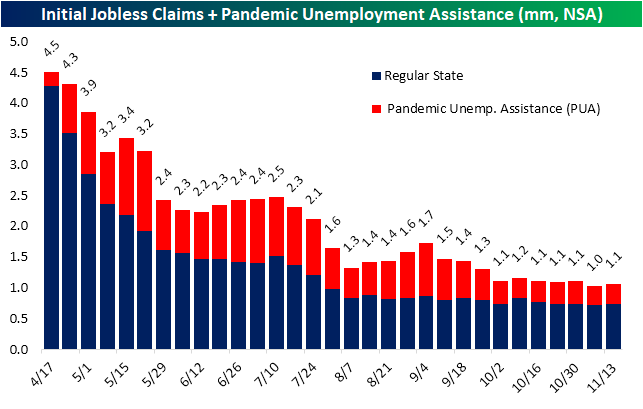
The inclusion of Pandemic Unemployment Assistance (PUA) claims helps to give a more complete picture. With the inclusion of this additional program, the overall outlook is pretty similar to just regular state claims. PUA claims likewise rose this week up to 320.2K from 296.4K last week; the highest level since only two weeks ago. Again, while that is not an improvement with total claims between PUA and regular state programs rising to 1.064 million from 1.021 million, claims have not made that significant of a move higher and that is at a time of year with some seasonal headwinds.
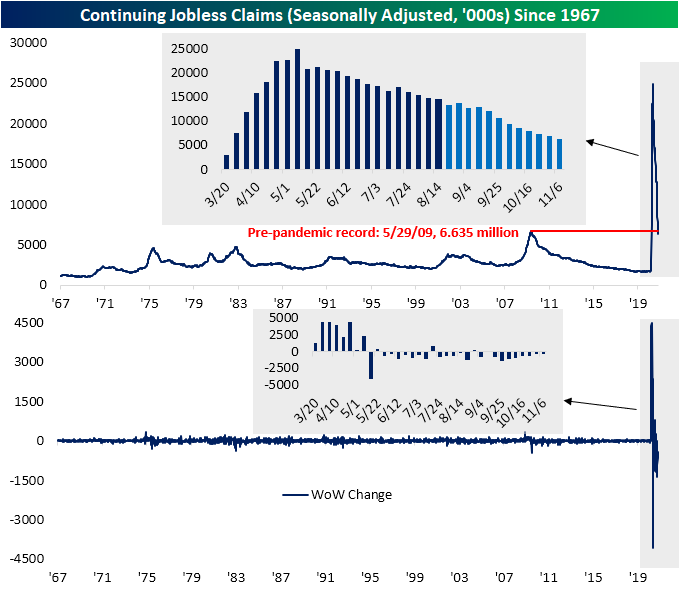
Continuing jobless claims are lagged an additional week to the initial claims data. Given this, last week’s drop to a new low for initial claims means continuing claims fell this week. Seasonally adjusted continuing claims fell to 6.372 million this week from 6.8 million the previous week. Although lower, that was not as good as forecasts were calling for as claims were expected to fall to 6.35 million. This week marked the second week in a row below 7 million for the first time since March. Not only was this a low for the pandemic, but that also finally brings claims back below the pre-pandemic record high of 6.635 million from May of 2009. So while claims are still at historically elevated levels and have a long way further to go, they are no longer as extreme as earlier this year and are at least to a degree back within a range with some historical precedence.
The data for all continuing claims programs like those for extended benefits and federal employees are lagged yet an additional week meaning the most recent print covers the final week of October. As shown below, through the end of October the two largest programs (regular state and PUA claims) have both continued to fall, but that is partially due to the expiration of benefits. Other programs covering extensions to benefits like Pandemic Emergency Unemployment Compensation (PEUC) and the Extended Benefits program have both continued to see claims rise with the most recent week marking new highs for the pandemic. Additionally, these programs make up for larger and larger shares of total claims. In other words, broadly claims continue to improve but a growing share of existing claims have been unemployed for long periods of time. Click here to view Bespoke’s premium membership options for our best research available.

Sentiment Stays Upbeat
As we noted in last Thursday’s Chart of the Day, sentiment as measured by the American Association of Individual Investors’ (AAII) weekly survey absolutely blew the doors off. More than half of respondents reported bullish sentiment—the highest bullish sentiment reading since January 2018—with the week over week increase the largest in over a decade. Turning to this week, bullish sentiment remains at the high end of the past several years’ range, but there was a significant moderation as only 44.35% report as bullish. That 11.5 percentage point turnaround was the largest drop in bullish sentiment since January 30th. In the history of the survey going back to the late 1980s, there have been 74 other weeks in which bullish sentiment has dropped at least 10 percentage points from a reading above 50%.

Compared to that double-digit move, bearish sentiment only rose 1.49 percentage points. That is, those that are no longer reporting as bullish did not necessarily turn around to take a pessimistic view this week. Currently, just over a quarter of respondents reported as bearish which is still muted relative to the past year’s readings and is still below the survey’s historical average of 30.63%.

Given bullish sentiment fell double digits and bearish sentiment saw a comparatively tiny move, investors appeared to be less polarized this week as neutral sentiment made up the difference rising exactly 10 percentage points. Staying true to round numbers, this was only the 100th time in the history of the survey that neutral sentiment rose double digits in a single week. After last week’s historically low reading of 19.29% (in the bottom 7.5% of all readings), neutral sentiment is now back up to 29.29% which is within a couple of percentage points of the historical average.

While that combination of higher neutral sentiment reading plus lower bullish sentiment points to things being less polarized than they were last week, sentiment still does not largely favor the bulls. As shown below, the bull-bear spread is now at 17.99 which remains at the high end of the past few years’ readings. Click here to view Bespoke’s premium membership options for our best research available.

Bespoke’s Morning Lineup – 11/19/20 – Three in a Row?
See what’s driving market performance around the world in today’s Morning Lineup. Bespoke’s Morning Lineup is the best way to start your trading day. Read it now by starting a two-week free trial to Bespoke Premium. CLICK HERE to learn more and start your free trial.
“Today people who hold cash equivalents feel comfortable. They shouldn’t. They have opted for a terrible long-term asset, one that pays virtually nothing and is certain to depreciate in value.” – Warren Buffett
Futures are lower again this morning, but what was looking like it would be a pretty rough day in the market when Europe opened has steadily improved in the last few hours. It’s a busy day for economic data today with initial and continuing jobless claims and the Philly Fed report coming out at 8:30. Initial claims came in higher than expected (742K vs 700K) while continuing claims were a bit lower (6.372 million vs 6.4 million). Regarding the Philly Fed report, manufacturing activity came in stronger than expected falling to just 26.3 from 32.3 versus expectations for a decline to 22.5).
At 10 we’ll get the latest reads on Leading Indicators and Existing Home Sales, and finally, at 11 AM we’ll get the November read on manufacturing in the Kansas City Federal Reserve district. Once we get those reports, though, that will be it for the week in terms of economic data.
Be sure to check out today’s Morning Lineup for a rundown of the latest stock-specific news of note, employment data in Australia, trends related to the COVID-19 outbreak, and much more.
The S&P 500 is on pace for its third straight day of declines today, and while rising numbers of COVID cases have been cited as a culprit, that’s been the case for weeks now, so why did the market finally decide to focus on it now? Another factor to consider is the fact that the market has seen an enormous rally this month, and heading into this week the S&P 500 was trading at ‘extreme’ overbought levels.
The chart below comes from page two of the Morning Lineup and shows the S&P 500’s daily overbought/oversold reading over the last year. Following Monday’s rally, the S&P 500 closed more than 2.3 standard deviations above its 50-day moving average which was the most overbought reading for the index since July 2018. Whenever markets get that extended it doesn’t necessarily mean that they have to trade lower from there, but it usually indicates that a period of consolidation is in order so that the market can catch its breath.

Stocks Flying Around the Globe
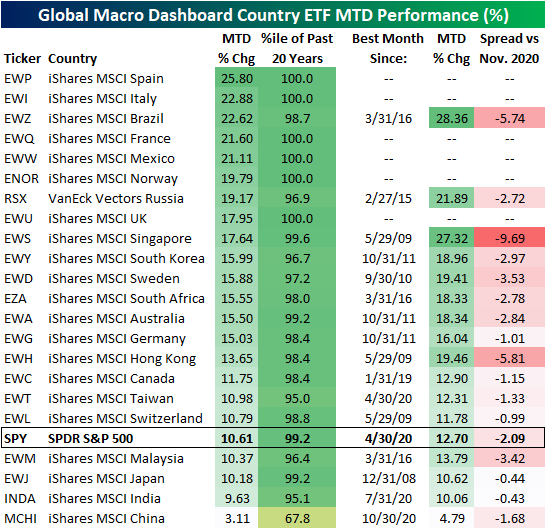
Since bottoming on the last trading day of November, the S&P 500 (SPY) has had a banner month so far this November rising 10.61% month to date. While there is still nearly two weeks left in the month, SPY is on pace for its best month since April. That is also in the top 1% of monthly moves of the past two decades. Other than April, the only month of the past 20 years that has seen a larger gain was October of 2011.
Looking across the various country ETFs in our Global Macro Dashboard, there similarly have been some massive moves so far this month. Several of these have risen over 20% and only two, India (INDA) and China (MSHI), have risen by single-digit percentages. Spain (EWP), Italy (EWI), France (EWQ), Mexico (EWW), Norway (ENOR), and the UK (EWU) are all on pace for their best month of the past twenty years. Every other country ETF is also seeing monthly moves in the top decile of their respective 20-year ranges. For some of these, like Singapore (EWS) or Switzerland (EWL), this month has been the best month in over a decade.Click here to view Bespoke’s premium membership options for our best research available.
S&P 500 Inductees: Class of 2020
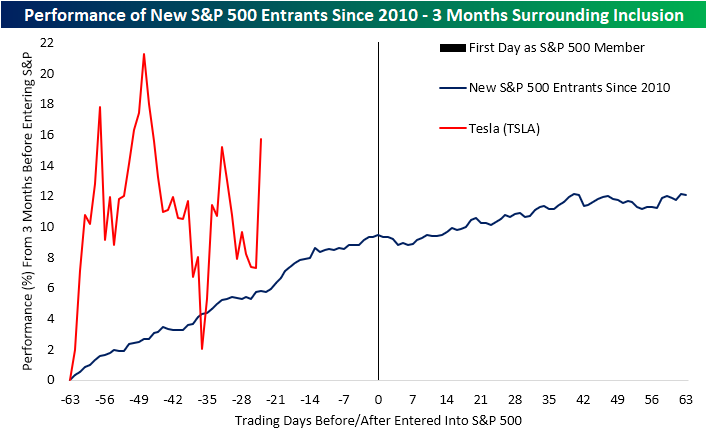
With Tesla (TSLA) set to be the next stock to join the S&P 500 in a little over a month, it will be the 20th change to the index (addition or removal of a stock) of 2020. That is basically in line with the average number of changes per year over the past decade (20.7). Of the current members of the S&P 500, 191 have entered the index since the start of 2010.
Below we show a chart from last night’s Closer depicting the performance of the stocks that have entered the S&P 500 in the past decade beginning three months before their entrance date (day number zero is the first day as an S&P 500 member) to three months after. As shown, historically over the past decade, new entrants to the large-cap benchmark have on average risen in the months leading up to inclusion. In the immediate days following inclusion, there is some sideways to slight downward movement but that is followed by a turn higher.
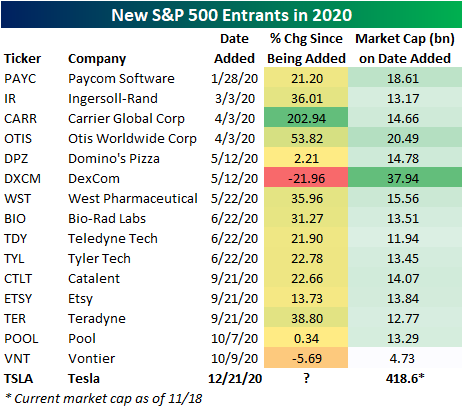
In the chart below we show the performance of just the stocks that have been included in the index since the start of 2020 from the close before the first day they trade as an S&P 500 stock through three months out. While it has not been a full three months since some of these have been added (i.e. Teradyne (TER), Catalent (CTLT), Etsy (ETSY), Pool Corp (POOL), and Vontier (VNT)), the average performance three months after inclusion has been a gain of 11.5%. Carrier Global (CARR), which was spun off of United Technologies (UTX) in the spring, experienced the largest move higher following its inclusion with a rally of 82.3%. TER is on pace for the second-largest gain having risen 39.04% since joining back in September. On the other hand, Paycom (PAYC) fell 24.27% after joining the S&P; the worst of any of these stocks.
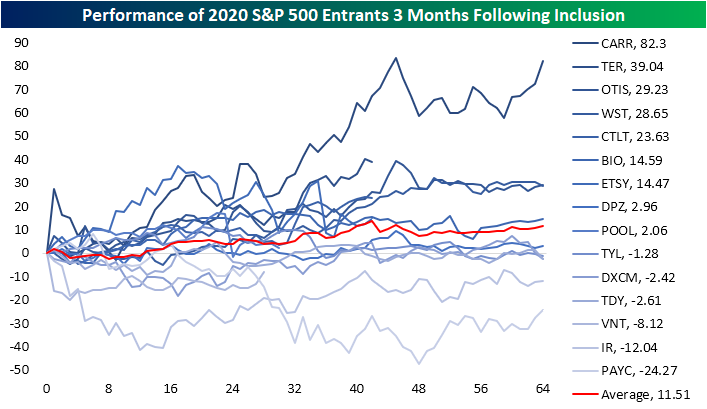
Paycom’s decline in the three months following its inclusion was largely a function of very poor timing though. The stock was added to the index in late January, meaning that 3 month period essentially covered the whole of the COVID Crash in February and March. Since its inclusion, though, it has rallied 21.2%. That is roughly 1.5 percentage points lower than the median performance to date of all 2020 additions since being added to the index. Dexcom (DXCM) and the newest addition Vontier (VNT) are the only stocks to currently sit below their levels from prior to addition.
As for what this means for Tesla (TSLA) in the months to come, recent history has shown new additions to the index have been treated well by investors, but TSLA has one major distinguishing feature: its size. As shown below, TSLA’s current market cap is $418.6 billion. By comparison of other additions in 2020, on the respective date it was added to the index, DexCom (DXCM) was the largest with a $37.94 billion market cap. That is 11 times smaller than TSLA today. By that same rate, the largest stock in terms of current market cap is Carrier (CARR) at $34.98 billion. With respect to CARR, TSLA is 12 times its size even after CARR’s stock price has tripled since being included into the S&P! Click here to view Bespoke’s premium membership options for our best research available.
Bespoke’s Morning Lineup – 11/18/20 – More Good Vaccine News and Strong Starts
See what’s driving market performance around the world in today’s Morning Lineup. Bespoke’s Morning Lineup is the best way to start your trading day. Read it now by starting a two-week free trial to Bespoke Premium. CLICK HERE to learn more and start your free trial.
“If the only tool you have is a hammer, you tend to see every problem as a nail.“ – Abraham Maslow
What was looking like a negative session for equities late last night steadily improved overnight, and futures are firmly in positive territory as the open nears. Sentiment was already improving, but Pfizer’s (PFE) announcement that its vaccine was actually 95% effective instead of 90% helped the positive tone. Also, the latest data on Housing Starts and Building Permits was inline to modestly better than expected.
Be sure to check out today’s Morning Lineup for a rundown of the latest stock-specific news of note, European economic data, trends related to the COVID-19 outbreak, and much more.
The big news outside of equities this morning is in cryptocurrencies as bitcoin’s price topped $18K for the first time since late 2017. After breaking out of its uptrending channel a few weeks back, bitcoin hasn’t looked back.

From a long-term perspective, bitcoin is now just $600 from its record high closing price, which would set the stage for a pretty textbook breakout if it occurs.

Given its attractiveness as a store of value, we like to compare bitcoin’s price to the price of gold. The last time bitcoin’s price was this high, gold was considerably lower, so one bitcoin would buy close to 15 ounces of gold. Today, the ratio is considerably lower at just under 10 ounces. So, there’s a way to go before the ratio gets back to record highs, but the recent move has taken the ratio back above its most recent peak in 2019.
