
Bespoke’s Morning Lineup – 12/4/20 – Positive Tone into Jobs Report
See what’s driving market performance around the world in today’s Morning Lineup. Bespoke’s Morning Lineup is the best way to start your trading day. Read it now by starting a two-week free trial to Bespoke Premium. CLICK HERE to learn more and start your free trial.
“I buy when other people are selling.” – J. Paul Getty
It’s safe to assume then that Mr. Getty hasn’t been buying much lately. Futures are higher again this morning putting the S&P 500 on pace for its fourth positive week in the last five, but in order to get there, we’ll have to get through the November jobs report. There have been some concerns about the health of the jobs market lately, but secondary indicators we track have been holding up relatively well.
Be sure to check out today’s Morning Lineup for updates on the latest market news and events, a discussion of the latest OPEC talks, factory orders in Germany, an update on the latest national and international COVID trends, and much more.

We’ve illustrated the positive breadth in the market in a number of different ways lately, but here’s another. For the last few days now, all 24 of the S&P 500’s Industry Groups have been trading above their 200-DMA. Looking back at the last five years, that doesn’t happen all that often. The last time there was such a high reading was at the start of the year on January 2nd. While the year may be on pace to finish right where it started in terms of breadth, it was far from a straight line as this reading went from 100% down to 0% and back to 100%. You can’t get any wider of a range than that!

Bearing Down Into The Holidays
The S&P 500 has pressed to more all-time highs, and as a result, sentiment has turned even more bullish. In this week’s AAII sentiment survey, nearly half of the respondents (49.07%) reported a bullish. That is up for a second week in a row and remains at some of the highest levels of the past few years, though, it is more moderate than the reading from the first week after the election when over 55% reported as bullish.
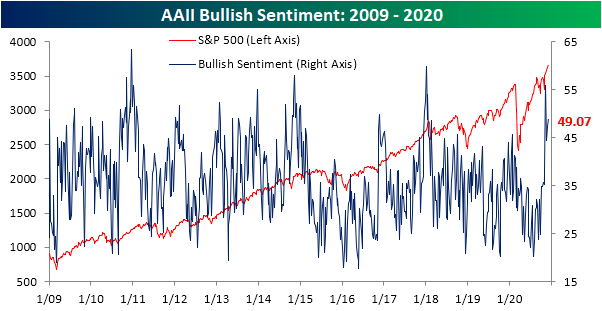
While bullish sentiment is still off its recent highs, bearish sentiment has continued to press to new lows. 22.66% of respondents reported as bearish this week. That is down from 27.47% last week and is the lowest reading for bearish sentiment since the final couple of weeks of last year and the first week of 2020.

Given this, the bull-bear spread remains widely in favor of bulls, but off of its highs from a few weeks ago. Just like bullish sentiment, it is still at some of the highest levels of the past few years. Outside of the early November high, the bull-bear spread is at the highest level since February 2018.

Neutral sentiment is perhaps the most normal of the sentiment categories. While bullish and bearish sentiment readings are several percentage points away from their historical averages, at 28.25% neutral sentiment is only 3.19 percentage points below its historical average. Click here to view Bespoke’s premium membership options for our best research available.

Equity Newsletter Exuberance
As we discussed in an earlier post, sentiment, as proxied by AAII’s weekly survey, has been overwhelmingly bullish. Other sentiment surveys are echoing the exuberance among investors. The Investors Intelligence survey of equity newsletter writers likewise saw bullish sentiment rise again this week from what were already strong levels. 64.7% of respondents reported as bullish this week. That is in the top 3% of all readings in the history of the survey. The last time this reading on bullish sentiment was this elevated was in January of 2018. Prior to that, you would need to go all the way back to February of 1987 to find a time that a higher share of respondents reported as bullish.
Meanwhile, just 16.7% of the respondents reported as bearish. While not at the same sort of extreme as bullish sentiment (in the bottom 13% of all readings), that is the lowest reading since early September.
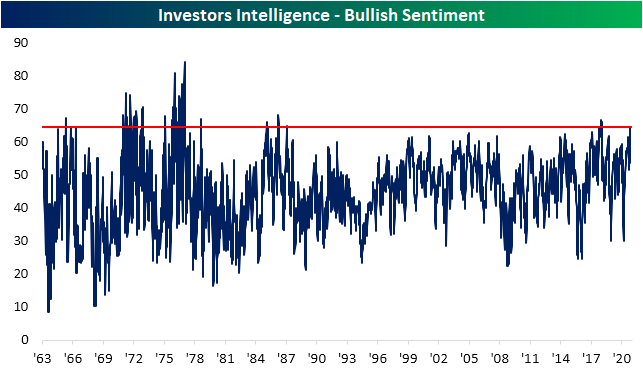

In addition to gauging bearish sentiment, the report also measures the percentage of respondents that are “looking for a correction”. This reading ticked slightly higher this week rising from 18.2% up to 18.6%. While slightly higher, that is still in the bottom 20% of all readings across the history of the survey. More recently, though, this was more of an extreme low. Last week’s reading of 18.2% was the lowest reading since December of 2006. Click here to view Bespoke’s premium membership options for our best research available.

Services Slowing
Just like the reading on manufacturing earlier this week, the ISM’s Non-Manufacturing survey showed overall growth in November, albeit at a slower rate. The headline reading for the services index beat expectations (55.9 vs 55.8 expected) but still came in below last month’s level of 56.6. That is a sixth consecutive month of expansionary readings (readings above 50 indicate growth/below 50 indicate contraction) although the reading for November was the lowest of those six months. The same applies to the composite of the manufacturing and services which fell from 56.9 to 56.1.

Looking across each of the individual indices of the report also resembled the manufacturing report. While most components continue to be consistent with further growth, November did see some slowing across a range of indicators.

The improvements in business activity have considerably moderated over the past few months. After a near-record high reading back in July, this index has fallen every month except for in September. At 58, the index is around levels similar to just before the pandemic began earlier this year. A slowdown in orders likely plays a role in this as the index for New Orders similarly sits in the middle of its historical range following a 1.6 point decline to 57.2 in November. While that is still indicative of new orders growth, it would be the slowest growth since August.


Export order growth slowed in November as that index fell to a barely expansionary reading of 50.4. While orders from outside the US were a bit weak, the index for imports rose to 55 which is the strongest level since January of this year (55.1). One important thing to note with these indices, though, is less than half of survey respondents report that they do not use or track imports/exports (only 29% for exports and 37% for imports). In other words, these readings only apply to a smaller sample of responding firms.

The continued growth in new orders has resulted in smaller inventories. For only the second time in the index’s history (the other instance being March of this year), the index for Inventory Sentiment came in below 50. That indicates a larger share of companies are reporting that inventories are too low rather than too high. As a result, the index for Inventories showed a contractionary reading of 49.3. That is not any sort of extreme reading but again points to declining inventories.
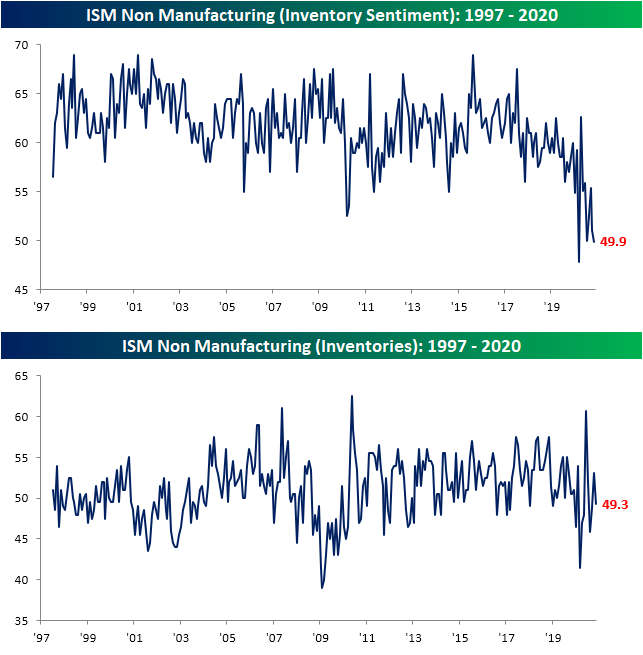
Stronger demand has filtered through to lower inventories which has, in turn, resulted in higher prices. The index for prices paid rose to 66.1 from 63.9 in October. That points to prices growing at their fastest pace since February of 2013.
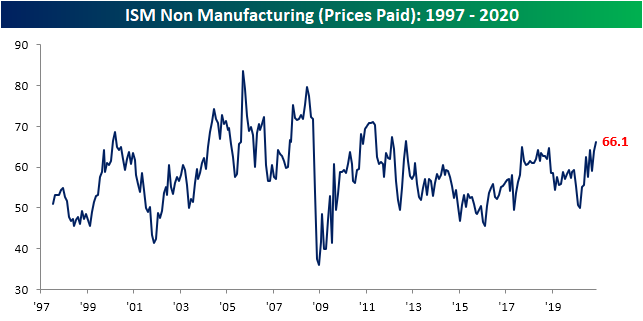
Staying on the topic of prices, with housing flying high, prices for construction contractors and construction supplies like lumber, PVC, and steel have all been on the rise as they remain in short supply. Outside of construction contractors, labor, in general, was cited as in short supply. That is consistent with some commentary concerning employment in Monday’s manufacturing release. But unlike Monday’s report in which the employment component fell to a contractionary reading, the services employment index showed a third straight expansionary reading at 51.5. Additionally, as COVID has made a resurgence in the past few months, PPE and other related products continue to be cited as some of the commodities seeing price increases. For PPE this month saw a 10th month in a row that these products were in short supply with higher prices.


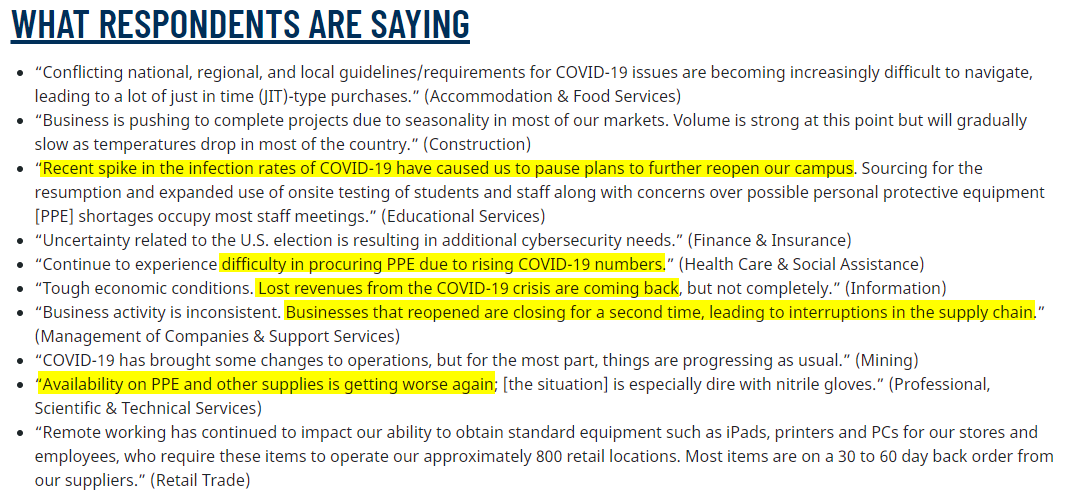
The commentary section reaffirms the COVID ressurgence impact. Quotes from various industries stated how higher infection rates have had negative impacts. Click here to view Bespoke’s premium membership options for our best research available.
Claims Back to the Lows
After two weeks of upticks, initial jobless claims saw some good news this week ahead of the Nonfarm Payrolls number on Friday. Claims experienced a sizeable decline falling 75K from last week’s upwardly revised reading of 787K. A decline had been expected with forecasts calling for a drop to 775K. Instead, the decline was much larger as claims came in at 712K. That is just 1K above the pandemic low from the first week of November. Although it is still a historically high reading, claims have continued to get closer to moving below the pre-pandemic record high of 695K from October of 1982.

The picture was even better for unadjusted claims. Although the current time of the year has historically marked a seasonal upswing in claims, the 48th week of the year has typically marked a decline week over week. Given the seasonal tailwind for the current week of the year, claims fell to a new low for the pandemic. Unadjusted claims came in at 713.8K, 122.5K below last week’s reading of 836.3. That was the largest weekly decline in the unadjusted number since the last major leg lower in the first week of August when claims fell by nearly 150K.

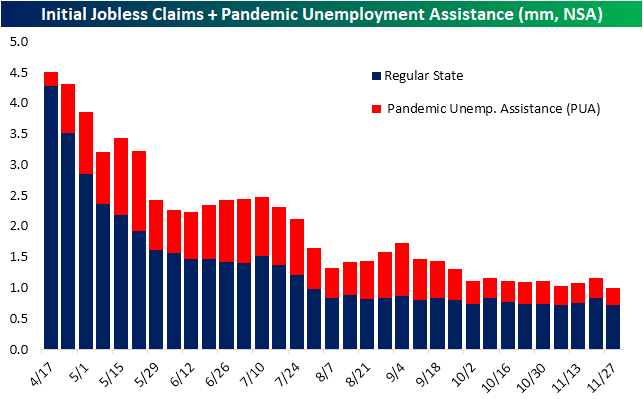
As we note every week, while the decline in regular state initial claims is a welcome sign no matter what, it does not show the entire picture. In the chart below, we show initial claims and claims through the Pandemic Unemployment Assistance program (PUA). This week, total claims between regular state and PUA also reached a new low for the pandemic coming in just above 1 million this week and below the previous low of 1.021 million from the first week of November. That was a result of not only the drop in regular state claims, but PUA claims also falling 30K to a new low.
While lagged an additional week to initial jobless claims, adjusted continuing claims likewise painted a pretty optimistic picture as well. Continuing claims fell 569K this week, down to 5.52 million, exceeding expectations for a decline to 5.8 million. That is the first reading below 6 million since March 20th, and it is also now well below what had been the pre-pandemic record high of 6.635 million from the global financial crisis.

Including the data for all programs of the weekly report adds yet another week of lag, but it does give a more complete picture. For the week of November 13th, total continuing claims fell to 20.2 million from 20.56 million the previous week. That is slightly below the level from the last week of October, which brings total claims to the lowest level since April. Taking a look across the programs, the overall decline was driven by drops in regular state claims and an even larger decline in PUA claims.
Given the length of time that many claims have been in place though, counts for programs that extended insurance once expiration is reached (which varies in length from state to state) like the Extended Benefits program and Pandemic Emergency Unemployment Compensation (PEUC) program have continued to rise. With regards to the Extended Benefits program, claims have now risen for 22 straight weeks through November 13th, albeit the most recent week’s 59.7K rise was the smallest week over week increase since August 21st. Similarly, PEUC claims have continued to rise with the most recent week adding another 79.7K. That leaves the total number of claims between these two programs at over 5.25 million for the first time of the pandemic. That means that despite some light at the end of the tunnel of the COVID front given positive vaccine news, with the pandemic continuing to drag on, nearly a quarter (26%) of all people receiving jobless benefits have been unemployed for an extended period of time. Click here to view Bespoke’s premium membership options for our best research available.

Bespoke’s Morning Lineup – 12/3/20 – Less Terrible Claims
See what’s driving market performance around the world in today’s Morning Lineup. Bespoke’s Morning Lineup is the best way to start your trading day. Read it now by starting a two-week free trial to Bespoke Premium. CLICK HERE to learn more and start your free trial.
“Confidence is not ‘I will profit on this trade.’ Confidence is ‘I will be fine if I don’t profit from this trade.’” – Yvan Byeajee
It’s a busy day for economic data, and it’s starting off on the right foot with both initial and continuing jobless claims coming in better than expected, albeit at still terrible levels. As bad as the numbers are, though, it’s encouraging that claims are moving in the right direction. With claims behind us, the next report of focus is the ISM Services report at 10 AM Eastern. Expectations for this report are also low as activity levels have started to decline in recent weeks as case counts rise.
Be sure to check out today’s Morning Lineup for updates on the latest market news and events, Markit PMI data for the services sector, an update on the latest national and international COVID trends, and much more.
The latest COVID wave has clearly been the most severe in terms of the number of confirmed cases, geographic reach, hospitalizations, and soon to be deaths. The chart below compares the 7-day average number of US confirmed COVID cases (red line) versus the relative strength of our basket of “Stocks for the COVID Economy” that we first published in early March versus the S&P 500 (blue line).
In the early stages of this wave, right before and up to the announcement of the vaccine from Pfizer (PFE) on 11/9, COVID stocks underperformed the S&P 500 rather sharply, but since 11/9, COVID stocks have once again started to outperform the S&P 500. They still remain well off their highs on a relative basis, but the initial reaction to vaccine news appears to have been overdone.

Salesforce Big Buys
The past couple of weeks had seen some rumblings that one of the newest additions to the Dow, Salesforce.com (CRM), was in talks to buy Slack (WORK). On Tuesday, the deal was officially announced to the public with the transaction valued at approximately just over $25 billion. The deal is set to be CRM’s largest acquisition to date, surpassing last year’s $14 billion acquisition of Tableau Software. While that would nearly double the previous record-sized acquisition for the company, there have been several other acquisitions valued at more than $1 billion at the time of the announcement.

The announcement concerning Slack is CRM’s seventh acquisition with a value of at least $1 billion, and it is the second such deal of 2020 after software company Vlocity was taken on back in February. Additionally, while the announced deal with Slack is the largest in terms of dollars, as a percentage of CRM’s market cap it is actually roughly in line with the Tableau acquisition and will be slightly larger than the deal with Exact Target in 2013.
As for these past deals, a negative reaction in the stock price of CRM has very much been the norm one week after the deal was announced. As CRM has fallen over 9% in today’s session, it is already on pace to see the worst stock price reaction since the announcement of a deal with MuleSoft in 2018. While positive returns have come down to a coinflip one to three months later, in the times the stock has rallied, the gains have been double digits. Additionally, six months out has consistently seen Salesforce higher with an average gain of over 20%. Click here to view Bespoke’s premium membership options for our best research available.

Market Caps and YTD Performance Drivers in November
In yesterday’s B.I.G. Tip report, we showed a decile analysis of performance in the month of November based upon a range of metrics. One of the most notable themes was performance based on market cap. Whereas for most of this year the stocks with the largest market caps have outperformed, the opposite was true in November. If the small-cap Russell 2000’s return to new all-time highs wasn’t indication enough, the decile of Russell 1000 stocks with the smallest market caps rose an average of 28.5% in November. That is head and shoulders better than the next decile (the 9th) in which the average stock rose 17.09%. As you move up the ladder in terms of market cap, performance worsened with the largest stocks seeing some of the worst performance on the month. The first decile saw an average gain of 12.39%. That group includes stocks with market caps above $100 billion including the trillion-dollar club: Apple (AAPL), Microsoft (MSFT), Amazon (AMZN), and Google (GOOG).

Again, some of the stocks with the largest market caps have also been the ones that have risen the most this year. Given this, the stocks that were up the most on a year-to-date basis through the end of October were also the ones that underperformed the most in November and vice versa. As shown below, the decile of stocks that have been the top performers from the start of the year through October averaged a gain of 12% in November. The second decile averaged an even smaller 9.35% rally. On the other end of the spectrum, November saw heavy rotation into the stocks that had been most beaten up this year. The decile of the worst performers averaged a substantial 38.08% rally in November. Deciles 8 and 9 similarly saw big rallies of 16.05% and 21.45%, respectively. These deciles included a lot of reopening stocks like airlines, energy, travel, regional banks, and brick and mortar heavy retail. Click here to view Bespoke’s premium membership options for our best research available.

Hard to Beat Steel
In Monday’s Chart of the Day and Closer, we noted the recent outperformance of industrial metals relative to other commodities, namely precious metals like gold. Given the strength of industrial metals, in the equities space, stocks related to the steel industry have been surging in recent days. Over the five days through yesterday’s close, the Steel ETF (SLX) which tracks these types of stocks has been the top-performing ETF of the US groups screen in our Trend Analyzer with a nearly 8% rally as shown below. That massive rally has left SLX as the most overbought ETF of this screen. Other metal related groups like the Junior Gold Miners (GDXJ) and S&P Metals and Mining ETF (XME) have also been top performers.
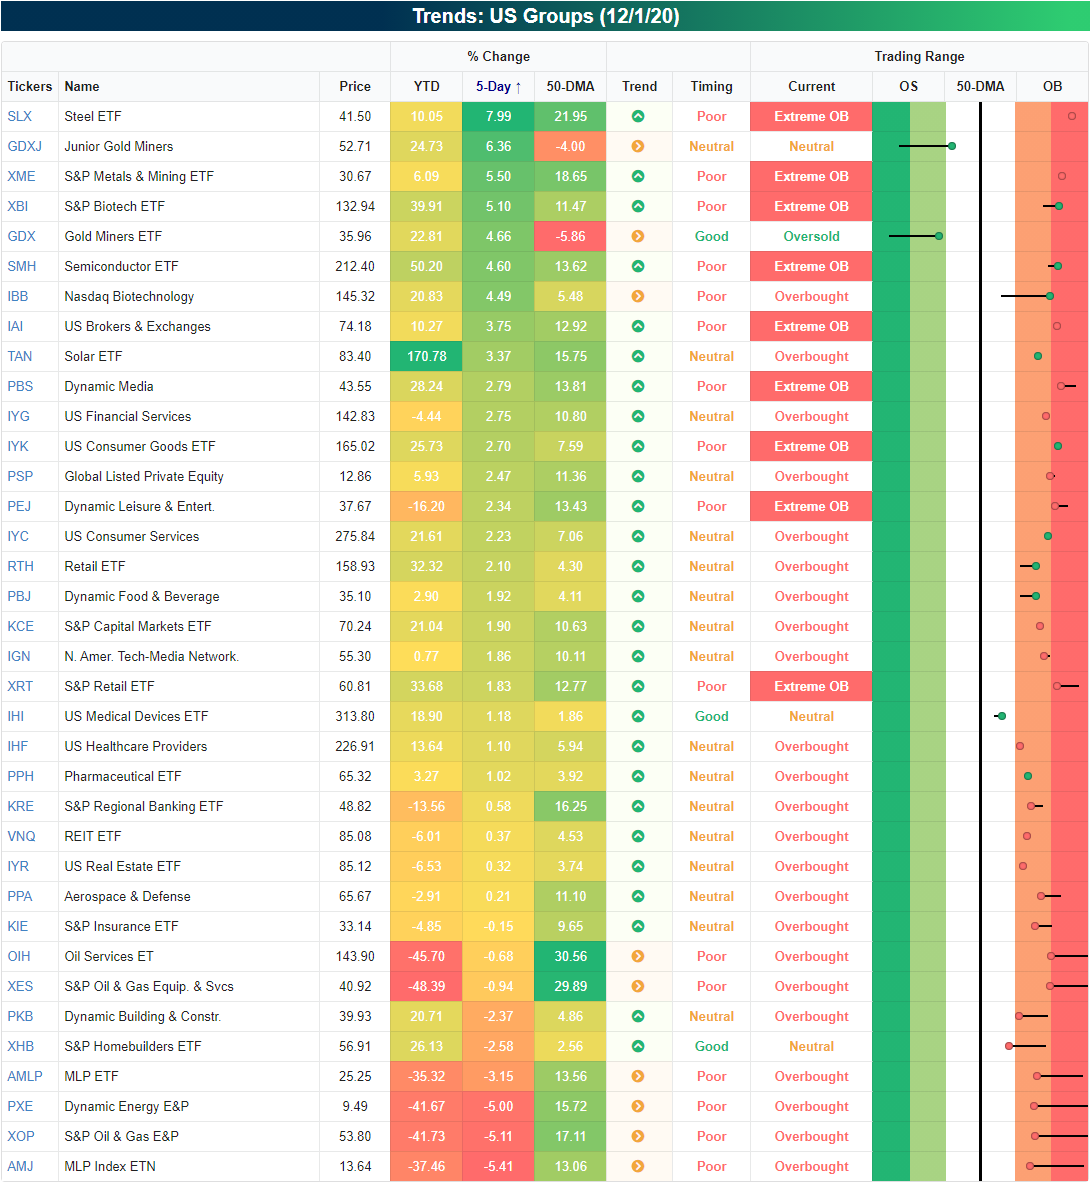
While there are plenty of reasons for steel’s rally including bets on a recovery in global growth, seasonality also appears to play a role. As shown in the snapshot of our Seasonality Tool below, for the current week of the year over the past 10 years, SLX has been the top-performing ETF with a median rally of 2.26%.

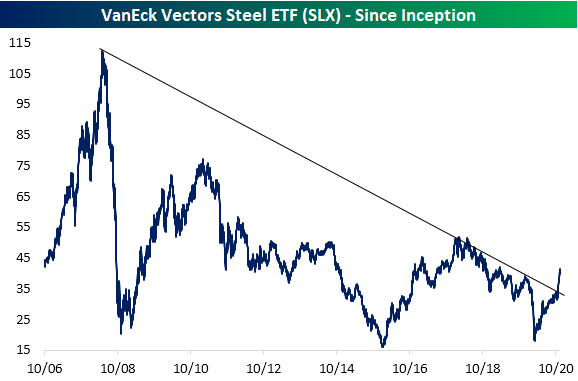
With SLX’s massive rally over the past several months which has accelerated in part thanks to seasonal tailwinds more recently, the ETF’s long-term downtrend that has been in place since not long after its inception has now been broken. As shown below, SLX is now around its highest levels since April of last year. While that is a positive from a long-term perspective, on a shorter-term basis SLX is running very hot. As shown in the second chart below, the ETF currently trades over 2.5 standard deviations above its 50-DMA. That is a historically elevated overbought reading as it is in the 98th percentile of the historical range. Click here to view Bespoke’s premium membership options for our best research available.

Bespoke’s Morning Lineup – 12/2/20 – Wednesday Hangover
See what’s driving market performance around the world in today’s Morning Lineup. Bespoke’s Morning Lineup is the best way to start your trading day. Read it now by starting a two-week free trial to Bespoke Premium. CLICK HERE to learn more and start your free trial.
“Well, I don’t have any greater insight than anybody else.” – Jensen Huang
Hangover on a Wednesday? Well, there is football today, so anything is possible! After a great start to the month yesterday, futures are indicated lower this morning as concerns over a stalemate on any agreement related to a stimulus/spending bill weigh on sentiment. ADP Private Payrolls for November was just released and came in weaker than expected. While economists were forecasting an increase of 440K jobs, the actual reading came in more than 100K weaker at 307K. That’s a pretty big miss, but there has been little reaction in the futures market on the premise that ADP has been consistently weaker than expected over the last few months.
Be sure to check out today’s Morning Lineup for updates on the latest market news and events, Eurozone auto sales, an update on the latest national and international COVID trends, and much more.
Equities have continued to do well lately, but semis have been an area of notable strength. While the S&P 500 has rallied nearly 1% in the last three trading days, the Philadelphia Semiconductor Index (SOX) has rallied over 1% on each of the last three trading days for a total gain of over 4%. Semis are considered one of the more cyclical sectors of the market, so their recent strength is a good sign.
