Shorts and Bad Breadth Shakes Sentiment
Outside of the outrageous moves of heavily shorted names, breadth in recent days has actually been on the weak side. As a result of weakening breadth coupled with people questioning the likelihood of a bubble given the oddity of those shorted stocks’ moves, investors appear to have turned a bit more cautious. AAII’s reading on bullish sentiment dropped 4.8 percentage points from 42.5% down to 37.7%. That is the first sub-40 reading since the first week of November and is the lowest reading since the last week of October. The week over week decline was also the largest since the 11.49 percentage point decile coming off the recent peak in mid-November.
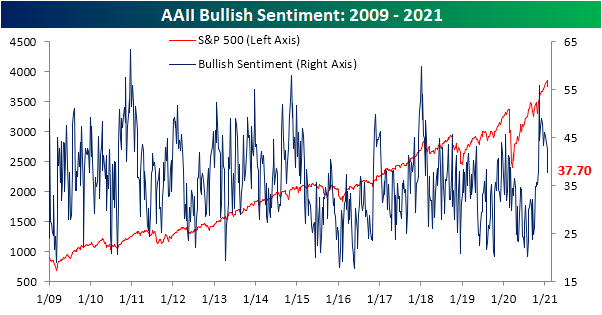
The losses in bullish sentiment were met with a 3.8 percentage point increase in bearish sentiment. That brings bearish sentiment to the highest level since the week of October 8th. Additionally, this was a fourth consecutive week that bearish sentiment has risen; the longest such streak since four weeks of increases during the bear market from the weeks of February 20th through March 12th.

Sentiment has been increasingly less in favor of the bullish camp over the past few weeks, but this week marked the first time since the week of October 15th that bullish sentiment was outweighed by bearish sentiment.

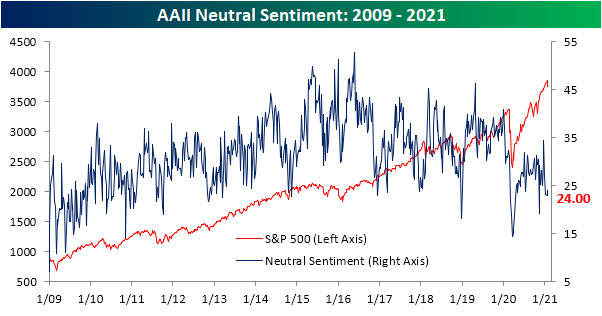
Not all of the losses to bullish sentiment went to bears though. Neutral sentiment was likewise higher with 24% of respondents reporting as such. While higher, that is still below where the reading has stood for most of the past year. Click here to view Bespoke’s premium membership options for our best research available.
Improvements Resume for Jobless Claims
For the second week in a row, initial jobless claims showed an improvement. Rather than the decline to 875K that had been penciled in by economists, first-time claims fell to 847K from 914K last week. Claims have now fallen 80K since the multi-month peak two weeks ago but are still 136K above the pandemic low of 711K from the first week of November.

On a non-seasonally adjusted basis, claims likewise were lower falling by 101.5K to 874K. Similar to the seasonally adjusted number, while off the peak, that is still well above the pandemic lows from the fall. Additionally, we would note that like last week (the third week of the year), the current week of the year (fourth) has rarely seen non-seasonally adjusted claims move higher. In the history of the data going back to 1967, only 9% of years have seen claims rise week over week in the fourth week of the year.

Last week, we noted how the decline in regular state claims was not necessarily shared by claims for Pandemic Unemployment Assistance (PUA). This week, the two moved more in sync as more than 100K decline in regular state claims was accompanied by a 20.5K decline in PUA claims. Combined, that makes for 1.3 million new claims this week; an improvement from the prior week but not as strong of a number as the start of the year/final weeks of 2020.

As for continuing claims, there have continued to be improvements as seasonally adjusted claims fell to 4.771 million rather than the 5.088 million reading that was expected. Last week’s reading was also revised lower from 5.054 million to 4.974 million. That means that total continuing claims fell below 5 million last week for the first time since March and stayed below 5 million in the most recent week.
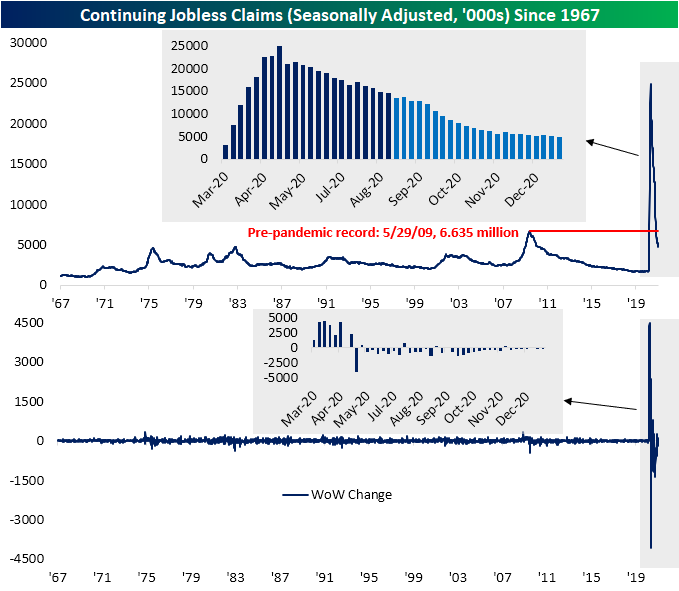
Including all other programs to garner a more complete picture of continuing claims adds a couple of weeks of lag to initial jobless claims data meaning the most recent week is for the week of January 8th. The surge in initial jobless claims for that week showed up as total continuing claims across all programs rose from 16.022 million in the first week of the year to 18.319 million. That was the first uptick of any kind since the week of November 27th when they rose by 1.6 million, and it was also the largest week over week increase since the week of May 8th when they rose by 3.793 million. The bulk of that uptick came from PUA claims which rose 1.627 million, but PEUC claims and the extended benefits program also saw increases of 836.6K and 96.04K, respectively. As we have noted in the past few weeks, those upticks were likely the result of catch up from the end of 2020 as expirations of some of these programs were narrowly avoided with the signing of the spending bill. Click here to view Bespoke’s premium membership options for our best research available.


Bespoke’s Morning Lineup – 1/28/21 – Differing Options
See what’s driving market performance around the world in today’s Morning Lineup. Bespoke’s Morning Lineup is the best way to start your trading day. Read it now by starting a two-week free trial to Bespoke Premium. CLICK HERE to learn more and start your free trial.
“There is nothing new in Wall Street. There can’t be because speculation is as old as the hills. Whatever happens in the stock market to-day has happened before and will happen again.” – Edwin Lefevre, Reminiscences of a Stock Operator
After some of the individual stock moves we have seen in the last few days and continue to see this morning, it seems odd to see futures for the S&P 500 only modestly lower. The pace of earnings season has really started to pick up steam in the last 24 hours, and the next 24 hours will be busy as well. So far, companies have been reporting strong results, but given the run-ups we’ve seen in stocks leading up to the reporting period and the high level of expectations, it’s not too surprising to see investors selling the news.
As if all the earnings news wasn’t’ enough to deal with, there’s also a tone of economic date to navigate through over the next two days as well, including today’s releases of Jobless Claims, Q4 GDP, Leading Indicators, New Home Sales, and the KC Fed report.
Be sure to check out today’s Morning Lineup for updates on the latest market news and events, earnings reports from around the world, Economic data out of Europe, an update on the latest national and international COVID trends, and much more.

Yesterday was an interesting day in the market. Interesting may be an understatement, but our point is that while the S&P 500 was down just over 2.5%, the upward move in the VIX was suggestive of a much larger downside move. The VIX’s massive upside move of 14.2 points Wednesday was the 17th day in the index’s history that it jumped ten or more points in a single day. On those days, the S&P 500’s average decline was 6.27% (median: 5.89%). Of those 17 days, yesterday’s 2.57% decline ranks as the smallest decline of them all. Even on the days where the VIX rose by less than it did yesterday but was still up more than 10 points, the S&P 500’s median decline was 5.28%. The smallest one-day decline of those days was -3.5% – nearly a full percentage point more than Wednesday’s decline. Based on the S&P 500’s performance on prior days where the VIX had a large one-day increase, yesterday there was a disconnect between sentiment in the market and the options market.

And Then There Were Four
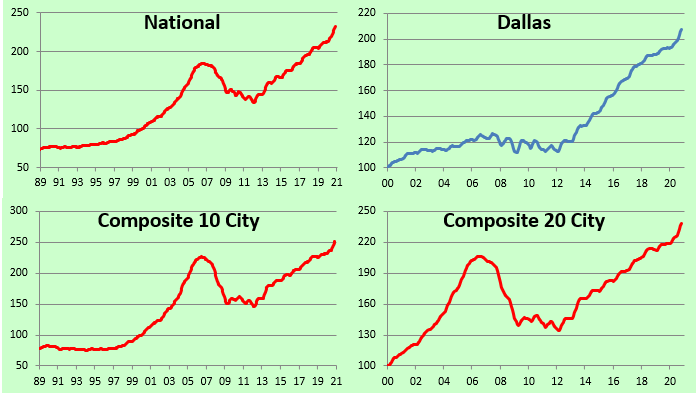
S&P/Case-Shiller home price figures for November 2020 were released on Tuesday, and below are the details. Month-over-month, every single city saw home-price gains, with New York and Boston gaining the most. Chicago and Cleveland saw the smallest MoM gains. On a year-over-year basis, every city is up at least 7%, with Phoenix, San Diego, and Seattle prices up the most. Click here to view Bespoke’s premium membership options for our best research available.

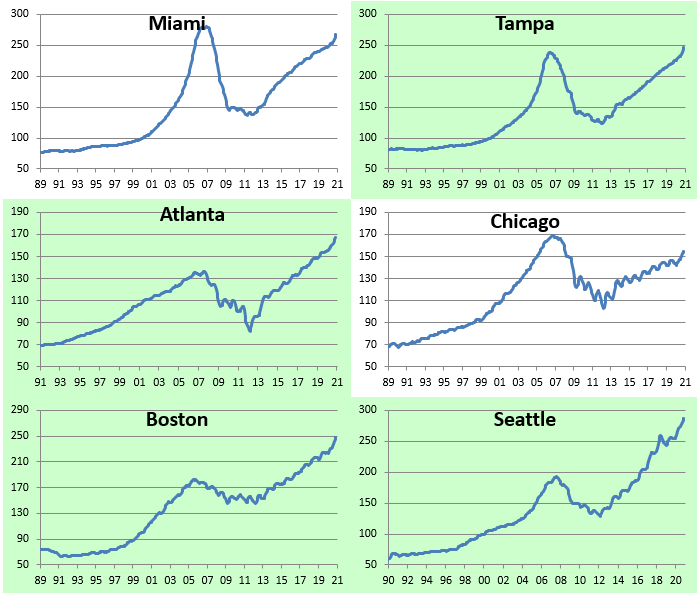
Below is an updated look at where home prices stand relative to their mid-2000s housing bubble peaks. Three cities saw home prices break above their prior highs in November — Tampa, DC, and New York. There are now only four cities that remain in the red versus their housing-bubble highs — Phoenix, Miami, Chicago, and Las Vegas.

Below are historical home price charts for the various cities and composite indices tracked by S&P/Case-Shiller. Cities in green are at new all-time highs. Yes, there’s now a lot of green!


Bespoke’s Morning Lineup – 1/27/21 – Game Time
See what’s driving market performance around the world in today’s Morning Lineup. Bespoke’s Morning Lineup is the best way to start your trading day. Read it now by starting a two-week free trial to Bespoke Premium. CLICK HERE to learn more and start your free trial.
“Beware of false knowledge; it is more dangerous than ignorance.” – George Bernard Shaw
Shares of GameStop (GME) are trading up over 50% in the pre-market, and while that may sound ludicrous, earlier this morning they were up well over 100%! The pre-market rally lin GME lost its steam following a CNBC report that Melvin Capital completely exited its short position on Tuesday afternoon. The crying uncle of one of the most notable shorts on GME would presumably mark the peak of this surge, but then again, no one would have really predicted that things would have gone this far to begin with. It’s interesting to note that much of the moves in GME have been driven by options trading, so when those markets open at 9:30 things could get a lot more interesting.
From GME, where will things go next? Was this just a one-shot deal, or will the traders that originally targeted GME move on to other targets? From a broader market perspective, though, it’s hard to look at what’s going on in the market right now and frame it as a positive. Also, keep in mind that today is an FOMC meeting day, and while there will likely be no changes to policy, we can guarantee that the subject of GME will come up in the 2:30 press conference.
Be sure to check out today’s Morning Lineup for updates on the latest market news and events, earnings reports from around the world, Economic data out of Europe and Asia, an update on the latest national and international COVID trends, and much more.
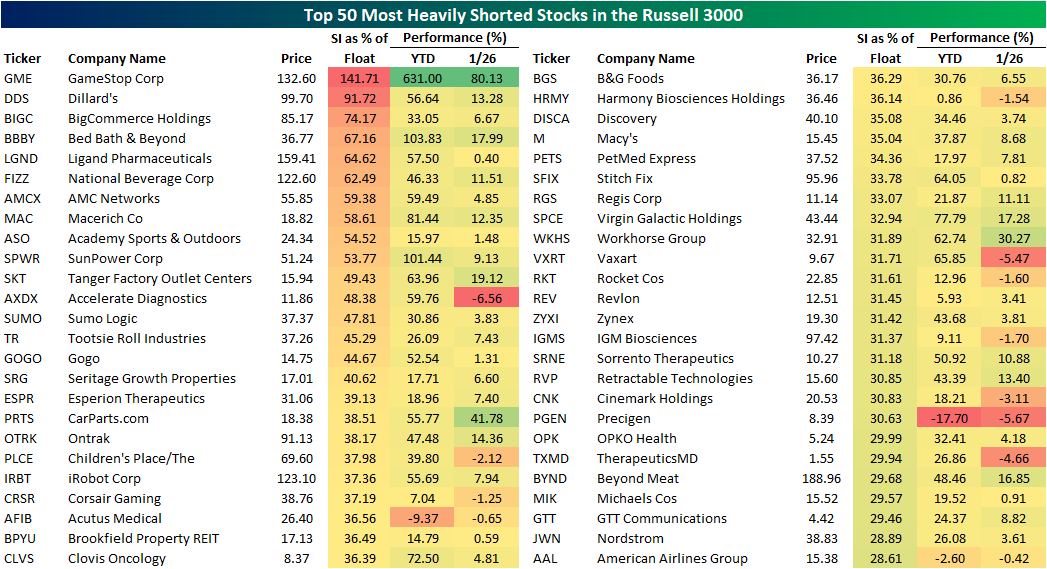
Yesterday, we showed a version of the table below showing the performance of the most heavily shorted Russell 300 stocks as of the end of 2020. As we noted, heading into yesterday’s session GME was up an incredible 307%. The other stocks were also doing well with every single one of them up at least 10% and half of them up over 50%. Since we published that list, the performance of these stocks has only gone much higher. Through yesterday’s close, the 16 stocks listed below are up an average of 96% while the median gain is still an incredible 58%. Along with GME, Bed Bath and Beyond (BBBY) and SunPower (SPWR) have also doubled since the start of the year.

Most Shorted Stocks Towering Over the Rest
GameStop (GME) and its historic short squeeze continues to be the talk of the town today with the stock up better than 90% as of this writing. But as we noted multiple times recently including in last night’s Closer, more broadly stocks with high short interest have been massive outperformers. Breaking down the Russell 3,000 into deciles (10 groups of ~300 stocks each) based on their short interest as a percentage of equity float, the comparison of the most shorted stocks to the rest is stark. The decile of the most shorted stocks is the only one in the green today with an average gain of more than 2%. That compares to an average loss of 0.51% for the other deciles. Even excluding GME, that average gain is 1.95%.
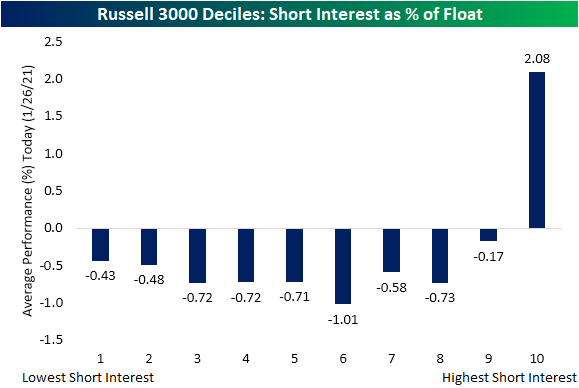
The contrast is just as stark on a year-to-date basis. While every decile is up year to date, the group of the most heavily shorted stocks has risen 26.88% on average while the stocks in the decile of least shorted stocks is up just 2.84%.

In the table below, we show the 50 Russell 3,000 stocks with the highest short interest as a percent of float. Other than GME, Bed Bath & Beyond (BBBY) and SunPower (SPWR) have also more than doubled this year. Of the 50 most shorted stocks, only American Airlines (AAL), Precigen (PGEN), and Acutus Medical (AFIB) are down YTD. Each of these is also lower in trading today. Click here to view Bespoke’s premium membership options for our best research available.
Price to Sales Surge
The price to sales ratio is a valuation metric that is calculated by dividing market cap by annual sales. In a normal market environment, a company with a lower price to sales ratio looks more attractive than a company with a higher price to sales ratio. Based on the price action we’ve seen recently, however, this is not a normal market environment! Lately, the higher the price to sales ratio, the higher the share-price return.
Looking at the S&P 500 as a whole, the index’s current price to sales ratio is just under 3 at 2.89. That’s about 75% above the S&P’s average price to sales ratio of 1.65 seen since 1995. The S&P 500 Technology sector’s price to sales ratio has climbed to 7.03. That’s more than double the average price to sales ratio of 3.12 of the Tech sector since 1995.
As shown below, the S&P 500’s price to sales ratio is currently solidly above the peak reading it saw in March 2000 at the top of the Dot Com boom. The Technology sector’s price to sales ratio has not quite made it to its Dot Com peak of 7.87, but it’s getting close. Click here to view Bespoke’s premium membership options for our best research available.

Slightly More Confident
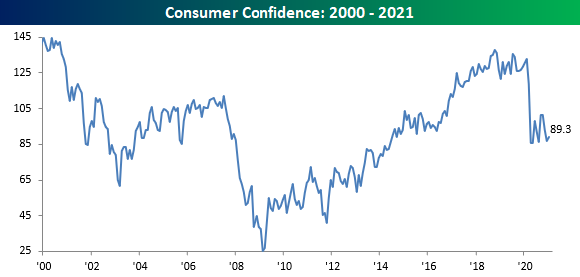
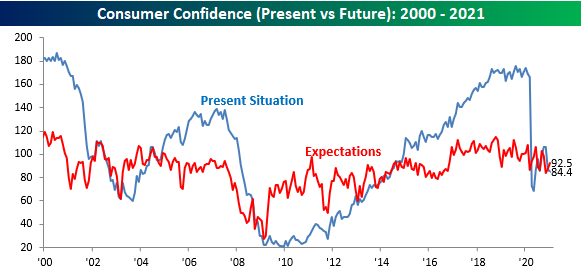
While a number of economic indicators have seen tremendous rebounds off their COVID lows, one that sticks out as a major outlier has been Consumer Confidence; that remained the case in January as well. In this month’s report, overall confidence rose from 87.1 up to 89.3 compared to expectations for an increase to 89.0. As illustrated in the chart below, after the initial plunge last Spring, Consumer Confidence has been bouncing up and down for the last ten months at levels well below the pre-Covid peak.
Whether you look at consumer sentiment towards present conditions or the future, it’s a similar picture. Expectations were already much lower heading into COVID, so they didn’t fall nearly as much, but after the plunge in the Present Situation Index, consumers feel roughly the same about the present as they do about the future.
With all the positive news about the vaccine rollout and the market at record highs, why aren’t consumers more confident? Chalk it up as a case of “It’s a recession when your neighbor loses his job; it’s a depression when you lose yours.” As shown in the chart below, the gauge of “Jobs Plentiful” embedded in the Consumer Confidence report remains extremely weak, and if you look closely, it’s also showing some signs of rolling over. When consumers are worried about hanging on to their jobs, it’s going to be hard for them to be confident.

There have been some crazy moves in the stock market, so we were surprised to see that consumer optimism towards the stock market actually fell this month. In this month’s survey, just 34.8% of consumers said they expect stock prices to increase, while nearly an equal number expect stock prices to decline. In this survey, at least, it doesn’t appear as though consumers are anywhere close to irrationally exuberant.

Lastly, we wanted to highlight where consumers expect interest rates to go. Back in April at the height of the pandemic, the percentage of consumers expecting interest rates to rise was nearly equal to the percentage that expected rates to fall. Since then, though, we’ve seen a steady increase in the percentage of those expecting rates to rise. Granted, when rates are at or near zero, it’s hard to expect rates to go any lower, but with little improvement in both overall confidence and the percentage of consumers viewing the job market as getting better, you wouldn’t expect to see half of all consumers anticipating a higher rate environment. Click here to view Bespoke’s premium membership options for our best research available.

Richmond Area Manufacturing Receding
Just like yesterday’s reading out Dallas, this morning’s release of the Richmond Fed’s Manufacturing survey was disappointing relative to expectations. Forecasts were calling for the index to hold steady at the December reading of 19. Instead, it fell 5 points to the lowest level since July. Like the Dallas Fed’s survey, this reading points to a still-growing but also decelerating manufacturing sector in the Fifth District that also goes contrary to other strong readings like those from Markit and the neighboring Philly Fed; both released last week.

That decline in the headline number was shared in most of the underlying components. Of the 17 sub-indices, 12 were lower month over month. For some of these, those declines were historically large and brought the indices to the bottom percentiles of historical readings. Currently, there are now four indices indicating contraction. Two have to do with expenditures, one with finished good inventories, and the other for the availability of skills. As for the indices for future expectations, breadth was similarly weak.
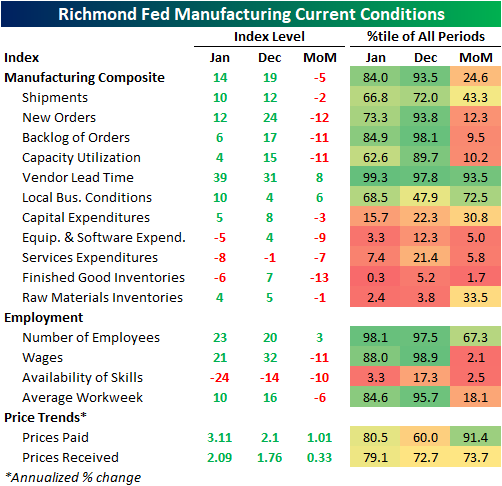

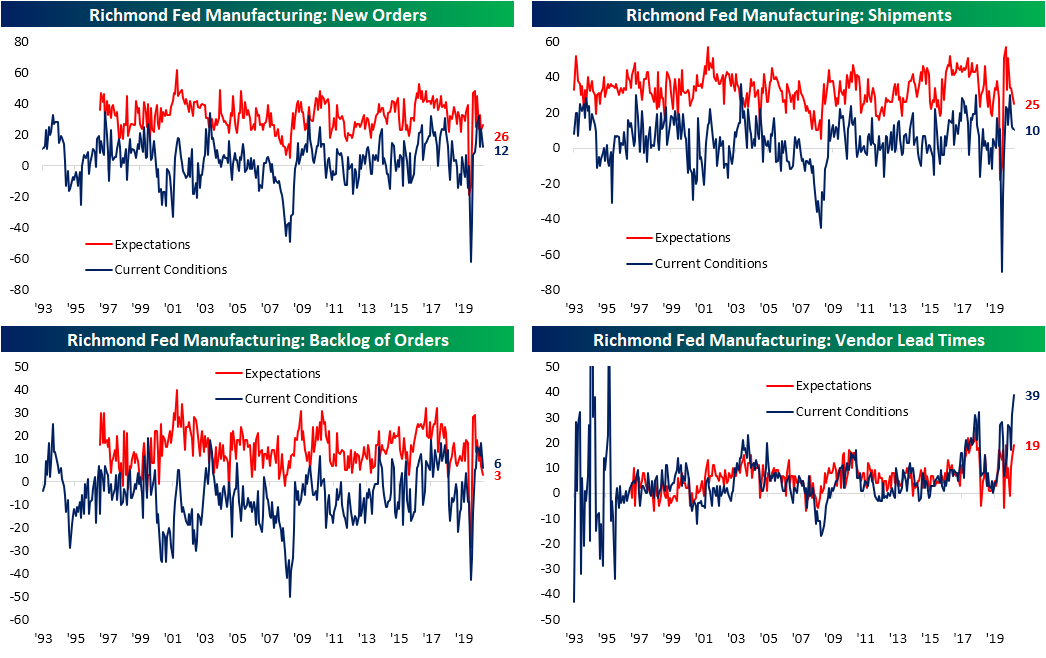
New Orders erased all of the move higher from December as it came in at 12, just as it did in November. With New Orders growing at a slower pace, the Backlog of Orders likewise grew at a more muted pace. That index fell to 6, the lowest reading since August. The 11 point MoM drop was also in the bottom decile of all monthly moves. Given the deceleration of these two, Shipments likewise pulled back. The index for Shipments fell to 10, the lowest reading since the last contractionary reading back in June. While that slowdown in shipments is likely in part due to some slowing in demand, supply issues also appear to be a potential issue. Higher readings in the Vendor Lead Time index means that suppliers’ products are taking longer to reach the surveyed manufacturers. This month, the index rose to a reading of 39. That is in the top 1% of all readings in the history of the survey. The only higher readings came early in the survey’s life in December of 1994 (282) and January of 1996 (75).
As orders still grow, manufacturers are taking on more employees. The index for the Number of Employees rose from 20 in December to 23 in January. That ties the pandemic highs from September and October for the highest reading since August of 2018. Similarly, the index for expectations for Number of Employees made its way higher in January. At 34, the index has only been higher once back in September. Although employers are taking on more people and expect to keep doing so at a historic rate, both of the indices for Wages and the Average Workweek were lower. Regardless, they both remain at historically strong levels and consistent with further growth. Additionally, one of the components of the report that is the most at an extreme is the index for Availability of Skills. The index dropped another 10 points in January and now sits in the bottom 3% of all readings since the series begins just over a decade ago. In other words, firms are experiencing a historic shortage of labor with desired skills.

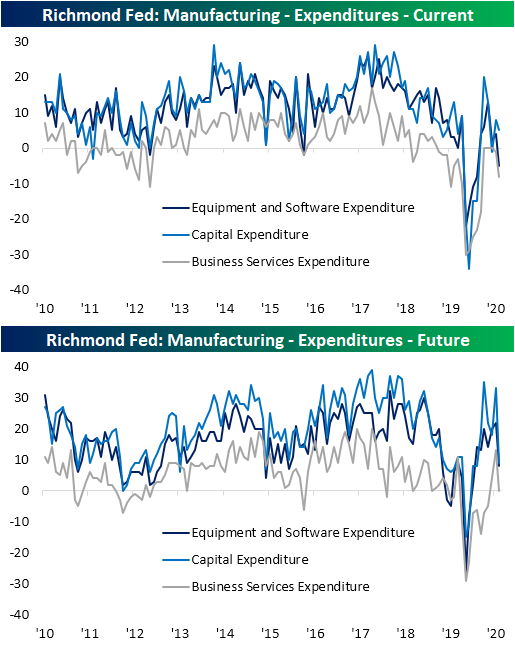
Contrary to the increase in employment, firms are cutting costs elsewhere. For the current conditions indices of the three expenditure related topics, each one was lower in January with Equipment and Software Expenditure and Business Services Expenditure both falling into contractionary territory.
Finally, just as we have seen in other manufacturing surveys, prices are showing further acceleration for both prices paid and received. Prices paid came in at the highest level since April of 2019 and prices received at the highest level in 11 months. Click here to view Bespoke’s premium membership options for our best research available.

Bespoke’s Morning Lineup – 1/26/21 – Short Circuit
See what’s driving market performance around the world in today’s Morning Lineup. Bespoke’s Morning Lineup is the best way to start your trading day. Read it now by starting a two-week free trial to Bespoke Premium. CLICK HERE to learn more and start your free trial.
“Every once in a while, the market does something so stupid it takes your breath away.” – Jim Cramer
We’re continuing to see some crazy moves in the market once again this morning. Take a recent tweet from Elon Musk where he said that he ‘kinda’ loves Etsy. In reaction, the stock is up over 8% in the pre-market. Etsy has a market cap of about $25 billion, so that tweet alone was worth about $2 billion.
Elsewhere in the markets, US futures are higher on the heels of a rally in Europe. The overnight pattern heading into this morning is the complete opposite of yesterday. Whereas yesterday it was Europe that was trading lower after a strong session in Asia, today its Europe rallying after a so-so Asia session.
Be sure to check out today’s Morning Lineup for updates on the latest market news and events, earnings reports in Asia and Europe, Economic data out of Asia, an update on the latest national and international COVID trends, and much more.
Shares of GameStop (GME) are up another 19% in the pre-market this morning, and while a move like that in what just a few weeks ago was considered a washed-up company would normally raise eyebrows, but after the insanity we’ve witnessed in the stock over the last few days, today’s move is nothing. While this year’s moves in GME have been the biggest outlier, it’s part of a broader trend where traders have been targetting stocks with the highest short interest.
The chart below is from Monday’s Closer and shows the performance of Russell 3000 stocks so far this year grouped into deciles based on short interest. There has been a clear trend where stocks with higher short interest have outperformed their peers with lower short interest, but the most heavily shorted stocks stand in a league of their own gaining 22%! The deciles of stocks with the second and third highest average short interest levels are also both up over 10%, but they’re only up half as much as the most heavily shorted stocks.

So, which stocks make up this basket of most heavily shorted stocks? We don’t have enough space to list all of them, but in the table below we show the 16 stocks in the Russell 3000 that had more than 40% of their float sold short as of year-end. Topping the list is GameStop (GME) which had more than 100% of its float sold short as of year-end. Year to date, that stock is up an incredible 307%. The other stocks, however, haven’t been slouches either. Every single one of them is up at least 10% YTD, and half of them are up at least 50%. 50%!!!!
