Bespoke’s Morning Lineup – 2/26/21 – Uneasy Markets
See what’s driving market performance around the world in today’s Morning Lineup. Bespoke’s Morning Lineup is the best way to start your trading day. Read it now by starting a two-week free trial to Bespoke Premium. CLICK HERE to learn more and start your free trial.
“We will ensure that there is no unwarranted tightening of financing conditions,” – Isabel Schnabel, ECB Board Member
Well, that didn’t take long. Just days into a market growing uneasy with the rise in government bond yields and Christine Lagarde noted that the ECB is ‘closely monitoring’ the situation in fixed income markets, Isabel Schnabel, a prominent member of the ECB tried to reassure markets that the ECB “will ensure that there is no unwarranted tightening on financing conditions”. She went on to add that the central bank would add further support to the markets if rising yields threaten to hurt growth. On both sides of the Atlantic, central bankers are doing their best to reassure markets that they will keep rates low, but for now, at least, the market isn’t so confident.
Futures have been volatile this morning and depending on when you look they may be up or down, and they are currently on the downside for both the S&P 500 and the Nasdaq. The economic calendar is busy with Wholesale Inventories, Personal Income, and Personal Spending at 8:30 AM. At 9:45, we’ll get the release of the February Chicago PMI, and then at 10:00, we’ll close out the week with the University of Michigan Sentiment Index.
Be sure to check out today’s Morning Lineup for updates on the latest market news and events, earnings reports from around the world, ARK Invest fund flows, economic data out of Europe, an update on the latest national and international COVID trends, including a new series of charts tracking vaccinations, and much more.
Also, Paul Hickey appeared on CNBC’s Squawk Box this morning to discuss the current moves in interest rates and what they mean for the market. You can see that segment here.

Thursday was a day many bulls would rather forget as the S&P 500 dropped over 2%, and the Nasdaq 100 fell more than 3%. Historically, declines of these magnitudes usually see a modest bounceback the following day, but believe it or not, the distribution of returns based on the day of the market decline varies widely. The charts below show the S&P 500’s and Nasdaq 100’s average next-day return (top charts) and the percentage of time each index is up (bottom charts) following days when they experience sharp declines.
When the S&P 500 declines more than 2% on a Thursday, the average next-day return is just 0.02% with positive returns 50.6% of the time. Of all the days of the week, that is the second weakest next day return and the second-lowest percentage of positive returns.
For the Nasdaq 100, it’s a similar setup. When that index declines more than 3% on Thursdays, the average next-day return is a gain of 0.05% with positive returns just 47.3% of the time. More than any other day of the week, when the Nasdaq 100 drops 3% on a Thursday, the likelihood of a down Friday is the highest.

Kansas City Fed Goes Out With A Bang
The last of the regional Fed manufacturing reports for the month of February went out with a bang. The Kansas City Fed’s composite manufacturing index rose from 17 to 24 in February, exceeding expectations by 9 points. That brought the index to the highest level since June 2018 and is also in the top 2% of all monthly reading since the survey began in 2001. Expectations also remain historically optimistic with that index in the top 1% of all months, also rising to the highest level since June of 2018.

Not only was the headline index strong but most of the components of the report similarly came in at historically strong levels. Both Backlog of Orders and Supplier Delivery Times came in at record highs while all but three other indices are in the top decline of all prior readings. Most indices were higher month over month, though, there were a few components that fell like Shipments, New Orders, New Orders for Exports, and Inventories for Finished Goods.
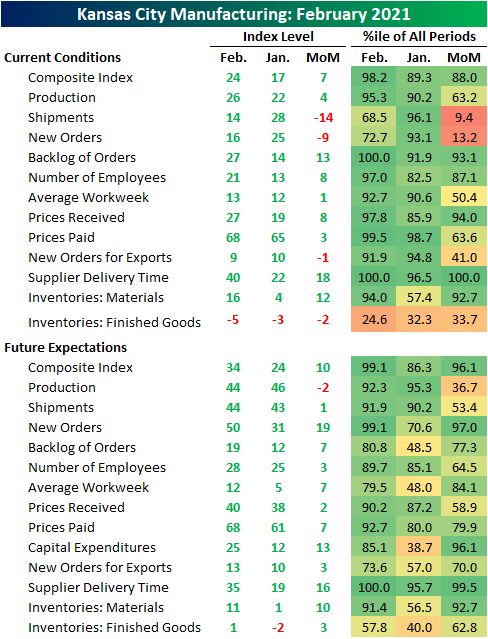
Two of the weaker components of the report were the indices for New Orders and Shipments. While still at healthy levels, the declines this month meant that new orders and shipments both decelerated in February. But even though the indices for current conditions fell, expectations indices were much stronger. As shown below, both expectations indices for New Orders and Shipments were higher month over month with the former coming in the top 1% of all months. Although the reading in New Orders pointed to some slowing, Backlog of Orders accelerated rising to 27, the highest level on record.

The other index reaching a record high was Delivery Times. Higher readings in this index indicate longer lead times. The 18 point increase month over month in February left the prior record of 30 from March 2018 in the dust. Manufacturers also do not appear to have high hopes that supply chains will normalize in the near future either. The expectations index likewise came in at a record high of 35.

Alongside longer lead times, prices are on the rise as has been observed in other manufacturing reports. The indices for both Prices Paid and Prices Received were higher this month. Starting with Prices Paid, the current conditions index rose to the second-highest reading on record behind April 2011. Expectations were also at the highest level since April 2011. Consistent with other manufacturing surveys from the other regional Feds, Prices Received are more muted but are nonetheless at the highest level in some time. Rising to 27 this month, the index for Prices Received rose to the highest level since August 2008. Click here to view Bespoke’s premium membership options for our best research available.

Bulls Stay in Charge
The major indices have been a bit mixed in the past week, and in turn, bullish sentiment took a small turn lower. 45.9% of investors responding to the AAII weekly sentiment survey reported as bullish this week. That’s down from 47.1% last week but still fairly elevated in the top decile of the past five years’ readings.

Although bullish sentiment took a small turn lower, bearish sentiment also has kept grinding lower. Less than a quarter of respondents (23.8) reported as bearish this week which was down from 25.4% the previous week. That is the lowest level since the week of December 24th when just under 22% of respondents reported as bearish. In the four weeks since recent the bearish sentiment high of 38.3%, the reading has fallen 14.5 percentage points. That makes for the biggest four-week decline since November 2019 when bearish sentiment fell over 20 percentage points from 43.96% to 23.93%.

While both bullish and bearish sentiment were lower, the decline in bearish sentiment was larger meaning the bull-bear spread continued to move higher. The spread rose from 21.7 up to 22.1 which is the highest level since the first week of December. That is also the fourth week in a row that the spread has moved in favor of bulls.

The losses to both bulls and bears meant more investors reported neutral sentiment. This reading tipped back above 30% for the first time in seven weeks. Click here to view Bespoke’s premium membership options for our best research available.
Was It The Weather?
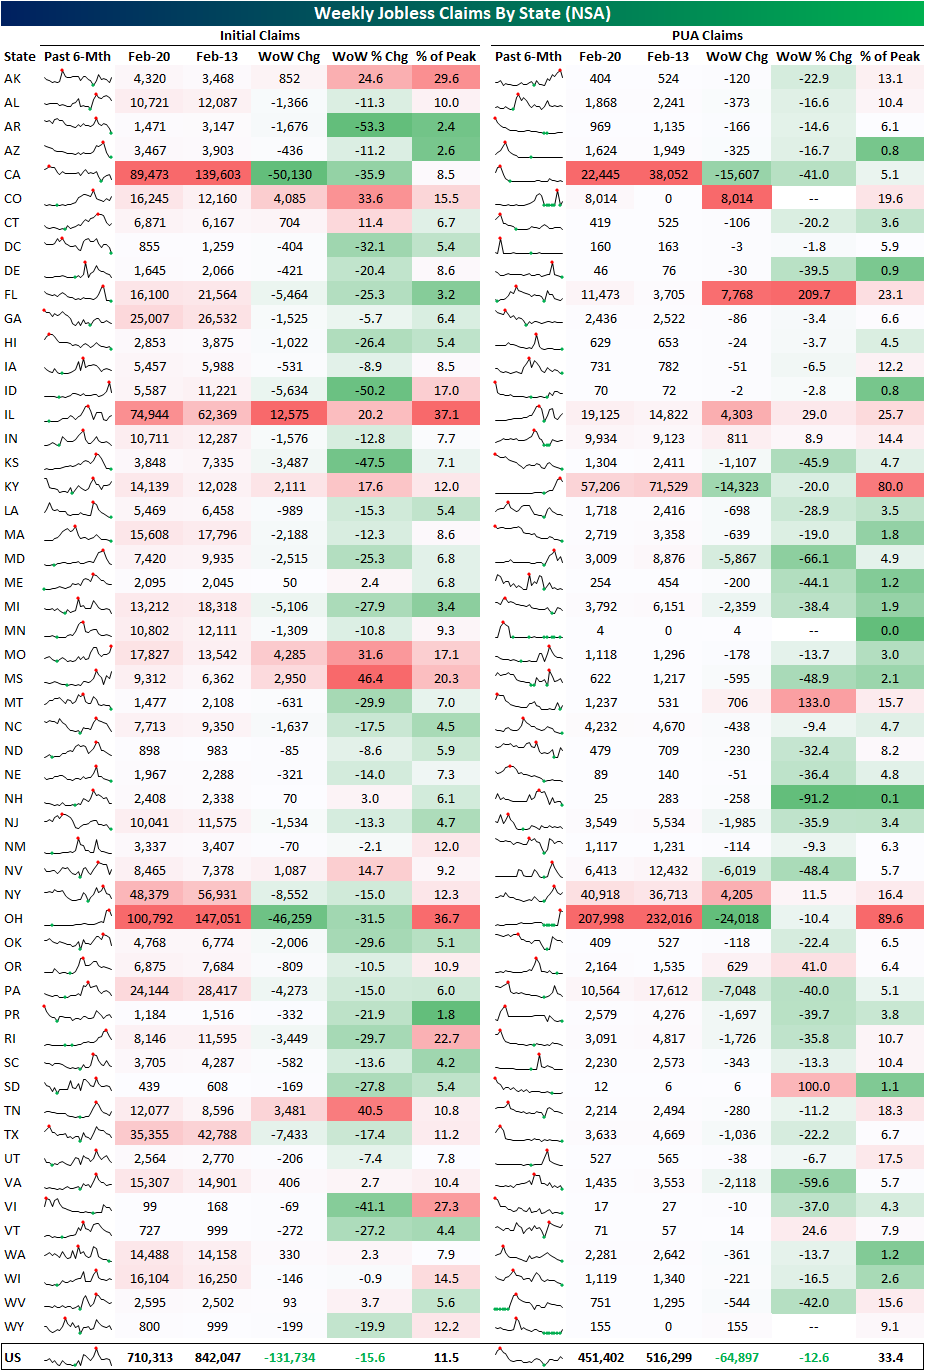
While the weather may have artificially depressed the actual levels, today’s release of initial jobless claims came in at the lowest level since the last week of November. Seasonally adjusted claims totaled 730K, down 111K from last week’s revised reading of 841K (from the original 861K). While claims were expected to decline, this week’s release exceeded expectations by 95K.

On an unadjusted basis, claims also experienced a significant decline dropping by 131.7K. That was the largest weekly decline since mid-January when they fell by 176.7K. At 710.3K, this week’s print was the lowest level of jobless claims since last March. We would also note that the current week of the year has historically seen claims decline. The current week of the year (eighth) has only seen unadjusted claims rise week over week 13% of the time of all years since the data begins in 1967.

Pandemic Unemployment Assistance (PUA) also saw lower claims this week dropping from a multi-month high of 512.86K last week back down to 451.4K. Excluding last week, that is still one of the highest levels since early December. Despite this, the coincident drop in regular state claims meant the total between the two dropped to 1.162 million which is the lowest since the last week of 2020.

As we noted earlier, adverse weather in states like Texas was one factor that may have caused distortions in this week’s reading. While that could be a factor, we would note that other states were far larger contributors to the decline in aggregate claims. In the table below, we show the readings in regular state and PUA claims for every state for the current and past week as well as six-month charts. The states that saw the largest declines this week for regular state claims were California and Ohio with 50K and 46K declines, respectively. These two states also accounted for the largest shares of PUA claims. The next largest decline in regular state claims was an 8.5K drop in New York and then Texas’ 7.4K decline. While that was the largest decline for Texas since November, the big drop from Ohio was more of a factor. Accounting for over a third of the net decline in total aggregate decline this week, Ohio’s level of claims has skyrocketed recently with the additional qualm that the state has been flagging a high number of fraudulent claims. In other words, while some headlines have pointed to weather in the South affecting the lower claims counts, there are other potentially more impactful factors at play.
Turning over to continuing claims, the declines keep coming with claims for the week ending February 12th falling to 4.419 million. That is the sixth consecutive decline, and once again the lowest level of the pandemic.
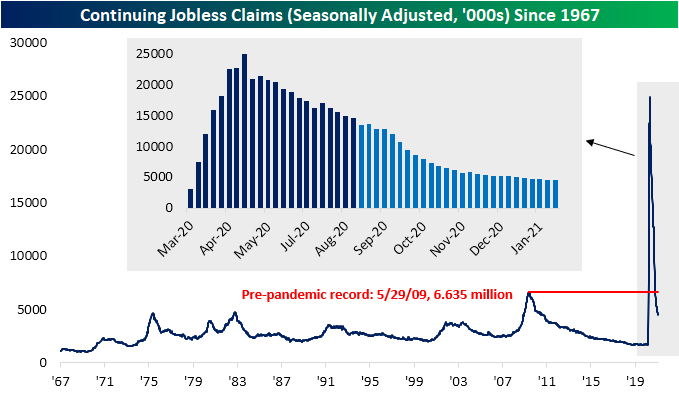
Adding in other programs creates an additional week’s lag meaning the most recent data is for the first week of February. Total claims continued to trend a bit higher moving back above 19 million almost solely due to an over 1 million uptick in Pandemic Emergency Unemployment Compensation (PEUC). Due to that increase, the program accounted for a new high of more than a quarter of total continuing claims for the week of February 2nd. Click here to view Bespoke’s premium membership options for our best research available.


Bespoke’s Morning Lineup – 2/25/21 – Good Economic Data
See what’s driving market performance around the world in today’s Morning Lineup. Bespoke’s Morning Lineup is the best way to start your trading day. Read it now by starting a two-week free trial to Bespoke Premium. CLICK HERE to learn more and start your free trial.
“All intelligent investing is value investing. Acquiring more that you are paying for. You must value the business in order to value the stock.” – Charlie Munger
The setup this morning is looking a lot like yesterday. Treasury yields are sharply higher, futures are lower, and bitcoin is above $50K. Yesterday, all those pre-market trends reversed themselves as Treasury yields gave up much of their gains, equities surged, and bitcoin pulled back. Will we see a repeat today?.
If lower treasury yields are what you’re looking for, this morning’s economic data isn’t likely to help much. Durable Goods Orders not only came in much better than expected (3.4% vs 1.1%), but December’s report was also revised higher from 0.5% up to 1.2%. Jobless claims came in 95K below estimates, although weather issues may have distorted that number. Lastly, the second look at Q4 GDP came in slightly lower than forecasts at 4.1% compared to estimates for growth of 4.2%.
Be sure to check out today’s Morning Lineup for updates on the latest market news and events, earnings reports from around the world, sentiment data out of Europe, an update on the latest national and international COVID trends, and much more.
It’s been a tale of two markets for the major US equity indices over the last week. The Nasdaq 100 and S&P 500, both of which are loaded with mega-caps, have dropped more than 1% over the last five trading days, but smaller-cap focused indices have surged more than 2%, while the less tech-centric Dow Jones is up over 1% also. Most of the index ETFs shown have declined relative to their trading ranges in the last week, and all but one of them are still at least at overbought levels. The one index ETF that isn’t overbought heading into today is QQQ, and given its recent pullback, its timing score now ranks as ‘Good’.

The reason for QQQ’s ‘Good’ timing score is the fact that on Tuesday the Nasdaq 100 looks to have successfully tested its 50-day moving average and saw a decent follow-through on Wednesday. This morning, tech is under pressure again, so watch the $319 level to see if QQQ can continue to hold the line.

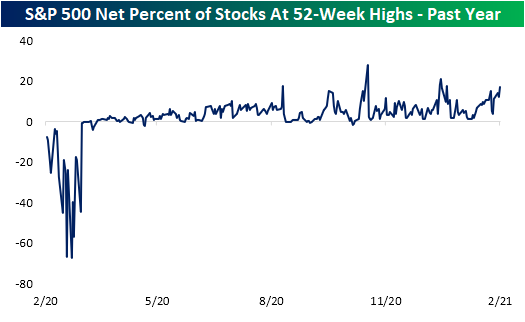
New Highs Picking Back Up Thanks to Cyclicals
As equities bounce back today, a number of stocks are back up to 52-week highs intraday. As shown in the chart below, the reading on net new highs (percentage of stocks reaching new 52-week highs today minus the percentage reaching new 52-lows) for the S&P 500 is up to 16.8% which is on pace to be the highest level since January 12th. Over the past year, including today there have only been six days that the S&P 500 saw a stronger reading in net new highs.
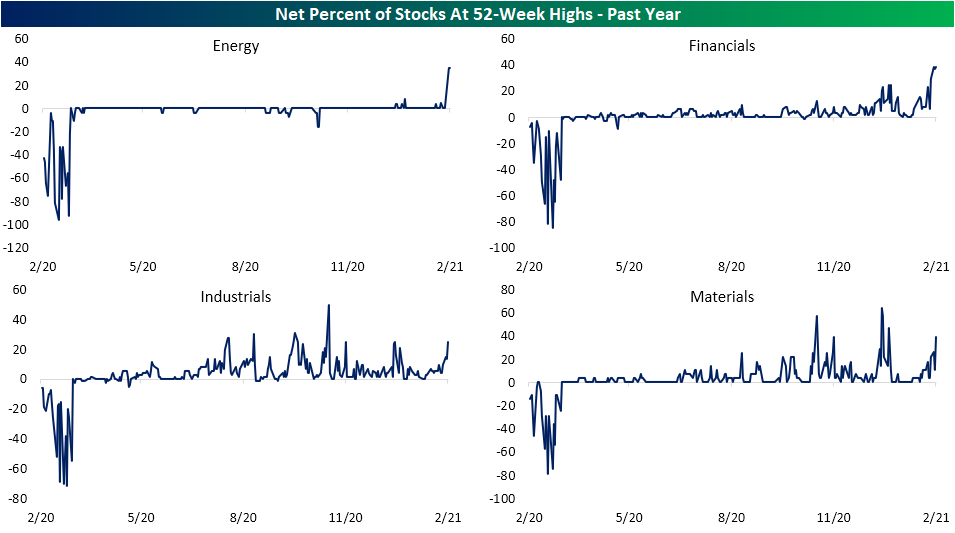
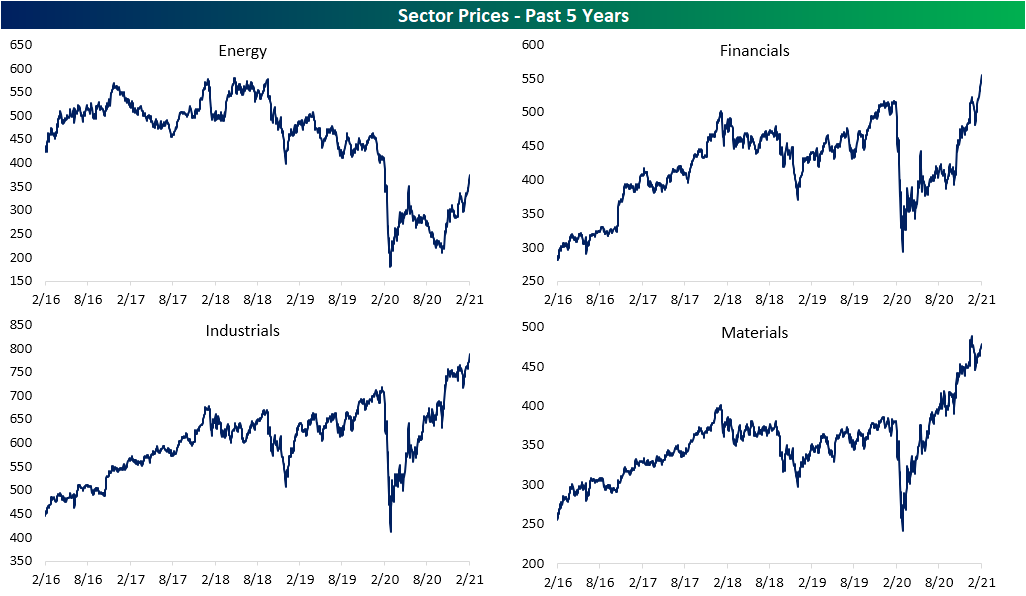
Looking across each of the eleven sectors, traditionally cyclical ones have stood out. Sectors that have been the best performers in the past week like Energy, Financials, Industrials, and Materials are also leading in new highs. The most impressive reading of these has been Energy. Over 34% of its stocks reached 52-week highs today which is the strongest reading since 5/17/18. While that is partially a result of big gains in these stocks recently, the higher number of new 52-week highs also has to do with higher prices of these stocks from prior to the COVID crash finally falling further into the rearview. For instance, as shown in the second set of charts below, even after its huge gains since the lows just over a year ago, the Energy sector still sits well below levels from prior to 2020. As for the other sectors, they not only have strong readings in net 52-week highs but also are making new highs in terms of price. Next to Energy, the reading for the Financials sector is the most notable at 38.46%; the highest since December 2019. While not at multi-year highs, Industrials and Materials have also seen some of the strongest readings in the number of new highs of the past year. AT 39.29%, Materials has the strongest reading of all sectors. Click here to view Bespoke’s premium membership options for our best research available.
Bespoke’s Morning Lineup – 2/24/21 – Asia Down, Europe Up
See what’s driving market performance around the world in today’s Morning Lineup. Bespoke’s Morning Lineup is the best way to start your trading day. Read it now by starting a two-week free trial to Bespoke Premium. CLICK HERE to learn more and start your free trial.
“Nothing is so exhausting as indecision, and nothing is so futile.” – Bertrand Russell
With Asia down overnight and Europe higher, the US is looking to break the tie in favor of the bulls as futures extend the rebound from Tuesday morning’s lows. As one might expect given the positive tone in equities, treasury yields are a bit higher. The economic calendar is light today as New Home Sales are the only report scheduled, but Fed Chair Powell will resume his semi-annual monetary report to Congress and a number of other FOMC officials are also scheduled to speak.
Powell is unlikely to say anything new this morning relative to yesterday, but with investors on edge regarding the direction of interest rates, uncertainty remains high as investors weigh the pros and cons of valuations, economic growth, a receding of the winter COVID wave, the potential for less accommodative monetary policy, and many other factors. With all these cross-currents, days like yesterday are likely to be more common.
Be sure to check out today’s Morning Lineup for updates on the latest market news and events, earnings reports from around the world, a discussion of fund flows from the ARKK funds, economic data out of Europe, an update on the latest national and international COVID trends, and much more.
Seasonal trends have been a tailwind for the market over the last several months, but the winds may be starting to shift. As shown in the snapshot from our Seasonality Tool, while the S&P 500’s historical returns from the last ten years over the following week, month, and three months are all positive, relative to all prior periods of similar duration, they rank below the 50th percentile.

More Than Meets the Eye to Fifth District Manufacturing
The fourth of the five regional Fed manufacturing surveys was released this morning from the Richmond Fed. The Manufacturing Composite held firm at 14 in February, unchanged from January but worse than the expected 1 point uptick that was penciled in by economists. Even though it did not live up to forecasts, that reading is still healthy and indicative of continued growth in the region’s manufacturing economy.

Although there was no change in the headline number, under the hood, there were some more interesting moves. Breadth in this month’s report was generally positive with only the indices for New Orders, Local Business Conditions, Raw Materials Inventories, and Availability of Skills lower month over month. The latter two categories not only are in contraction after the past month’s decline but are also now at record lows; neither of which is necessarily a bad thing. The only indices in contraction are for Services Expenditures and Inventories for both Finished Goods and Raw Materials.

While the New Orders index was lower, it remains at a healthy level consistent with growth. While new demand slowed down slightly, Shipments, Vendor Lead Times, and Order Backlogs were all higher. For the index of Backlog Orders, the 12 point increase was the highest month-over-month increase since June and July when the index rose 19 points two months in a row. Now at 18, the index is also tied with November of 2017 and March of 2004 for the third-highest reading on record. Only May 2000 and June 1994 have seen higher readings of 19 and 25, respectively.
Vendor Lead Times are at an even more notable high. Higher readings in this index mean products from vendors/suppliers are taking more time to reach their destination while lower readings mean shorter lead times. The index rose another 7 points to 46 this month. The only higher readings in this index came in the early days of the survey back in January 1996 and December 1994 when those readings were 75 and 282, respectively. Putting all of this together, new orders continue to grow leading to further growth in backlogs, and although businesses are shipping their products, some supply chain issues are constraining things.

With demand still growing and only slowing slightly, the long lead times are playing a role in dwindling inventories. Both indices for Raw Material Inventories and Finished Good Inventories sit in contraction. With regards to inputs, the Raw Material Inventories index’s reading of -8 was a record low. In spite of the index for Finished Good Inventories rising 3 points this month, it still sits in the bottom 1% of all readings.

In turn, prices are on the rise. Prices paid were up 4.47% annualized while prices received were up a more modest 2.83%. For prices paid, that is the most prices have accelerated since April 2019 when they were up 5.3% annualized. Higher readings in the expectations indices for both of these indicate that the region’s manufacturers are expecting these price increases to continue in the future.

The report painted a pretty positive picture concerning employment as well. While employment growth slowed a bit with the index for Number of Employees falling one point to 22, the index remains in the top 3% of all readings while the index for expectations for Number of Employees is in the top 1% of all months. Additionally, one potential reason for the decline in February’s reading of current conditions appears to be a lack of labor. The index for the Availability of Skills reached a record low of -28 in February. Given this, wages were higher back up to the same level as December. Click here to view Bespoke’s premium membership options for our best research available.

Where the Jobs Are and Aren’t
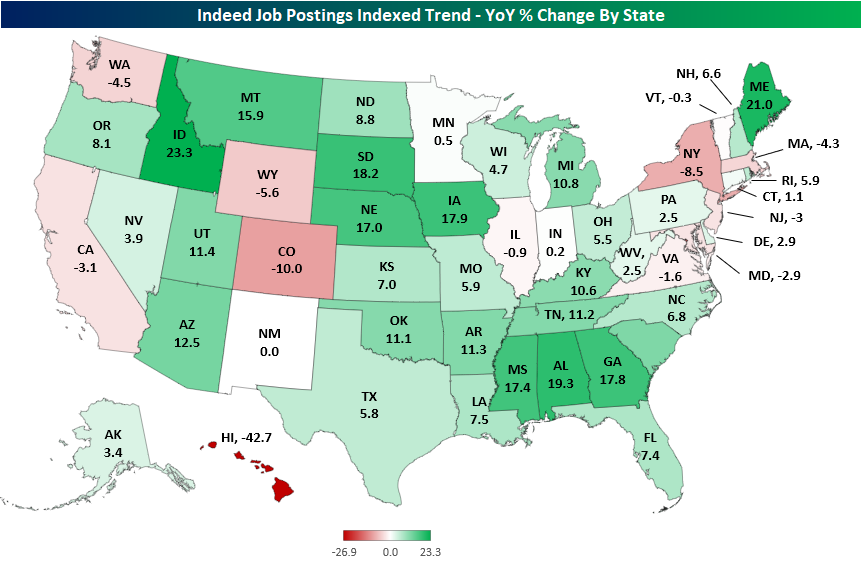
In last night’s Closer, we reviewed data from job listings website Indeed.com made available through the St. Louis Fed. While somewhat convoluted, Indeed’s indices show the year-over-year change in the seven-day moving average of the seasonally adjusted number of job postings on their website indexed to February 1st of 2020. For the most recent data updated through February 12th, job listings in the US have continued to trend higher up 3.9% year over year. Indeed also breaks down this data on a state-by-state basis. As shown in the heatmap below, most states in the Midwest and South currently have postings up year over year, but some coastal states like New York and California as well as some Southwestern states are lagging in their recoveries. By far the worst state continues to be Hawaii which is likely a result of a crippled travel industry.
Getting even more granular, Indeed also provides the data broken down by metro areas with populations larger than 500,000 people of which there are 110. Below we show the 20 metros that have the strongest and weakest job posting readings as of February 12th. Unsurprising given the state-level reading, Honolulu, Hawaii has the weakest reading followed by San Jose and San Francisco, California. Taking a look at the other weakest metro areas, there are a number of massive areas like New York City, LA, Boston, Chicago, DC, Seattle, and Denver to name a few. On the other hand, smaller metro areas dominate the list of those that have job postings most improved from a year ago.

Further quantifying this, in the chart below we show the average reading of metro areas grouped by their respective populations. As shown, metros with smaller populations (those under 1 million people) have seen the strongest growth in job postings, up over 11% year over year. As you move up the ladder of higher and higher populations, the job postings readings get weaker. Metros with populations between 2 and 3 million people only have postings up 0.56% year over year. The worst of these groups are the largest metros with populations over 4 million. On average, this group’s job postings are only up 0.35%. Click here to view Bespoke’s premium membership options for our best research available.

Consumers Still Stuck in a Rut
The stock market and economy have both exhibited different degrees of v-shaped patterns over the last year, but one area where the v-shaped pattern has been noticeably missing involves Consumer Confidence. The latest read on consumer sentiment for the month of February showed a modest improvement from January’s downwardly revised reading of 88.9. While economists were forecasting the headline reading to come in at a level of 90.0, the actual reading showed a modestly larger increase coming in at 91.3. Even as financial conditions and the economy improve and vaccines roll out, though, consumers remain stuck in a rut.
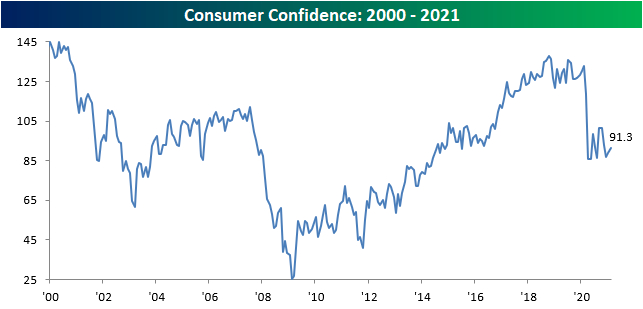
Breaking out confidence by Present Conditions and Expectations shows the same trend. While sentiment towards the present has seen a bigger bounce off the lows, expectations continue to trend lower. At first glance, this seems strange given the improved trends regarding COVID case counts and the rollout of the vaccines, but then again, if you told most Americans a year ago that we’d still be at the current level of restrictions and closures, they wouldn’t have believed you. Maybe the fact that expectations remain so muted is just consumers taking the attitude of, “I’ll believe it when I see it.”

Another reason for the muted sentiment is the fact that jobs simply aren’t there yet. Like overall confidence, the ‘Jobs Plentiful’ index has barely bounced off its lows. As long as jobs remain hard to find, don’t expect consumer sentiment to improve much.

One surprising aspect of this month’s report concerned sentiment towards the stock market. While there’s an overall abundance of bullish sentiment, the percentage of consumers in this survey expecting higher stock prices is barely higher than the percentage expecting lower stock prices. Normally, when the stock market makes record highs, consumers are bullish towards the market. This month, though, the lack of consumer enthusiasm has even made its way into sentiment towards the stock market. Click here to view Bespoke’s premium membership options for our best research available.
