Bespoke’s Morning Lineup – 3/17/21 – Walking the Tightrope
See what’s driving market performance around the world in today’s Morning Lineup. Bespoke’s Morning Lineup is the best way to start your trading day. Read it now by starting a two-week free trial to Bespoke Premium. CLICK HERE to learn more and start your free trial.
PELLEY: Fair to say you simply flooded the system with money?
POWELL: Yes. We did.
Ten months ago, Fed Chair Jay Powell appeared on 60 Minutes to explain the Federal Reserve’s unprecedented response to the COVID pandemic and assure Americans that the Fed would be there at the ready to provide whatever financial support the economy needed. As the exchange between Pelley and Powell above indicates, Powell was pretty blunt in his explanation. Today, market participants eagerly await the Fed Chair’s explanation for how the Committee plans to proceed now that the US appears to be coming out from the other side of the pandemic. It’s much easier to throw money at a problem than it is to take that money back when the problem starts to go away, so it’s pretty safe to assume that the Fed Chair will be a lot more nuanced with his comments today than he was last May.
It may be St Patrick’s Day, but there’s not a lot of green on the screens today as US equity futures (especially the Nasdaq), commodities, Treasuries, and even bitcoin are all mostly flat to lower on the day. Housing Starts and Building Permits were just released, and following yesterday’s weaker than expected homebuilder sentiment report for March, these reports (based on February data) both came in significantly weaker than expected. Despite the miss, though, US Treasury yields haven’t pulled back, so there’s been no relief for the Nasdaq.
Be sure to check out today’s Morning Lineup for updates on the latest market news and events, an update on economic data out of Asia and Europe, the latest US and international COVID trends including our series of charts tracking vaccinations, and much more.

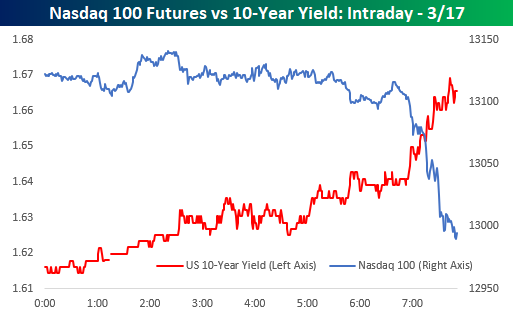
To say the balancing act the FOMC finds itself in is delicate would be an understatement. An intraday chart of the 10-Year US Treasury Yield versus Nasdaq 100 futures provides an excellent example. Just after 6 AM eastern treasury yields spiked higher and the pavlovian response in the equity futures markets was to hit the bids sending futures sharply lower. Powell sure has his work cut out for him this afternoon!
Sentiment Holding Back Homebuilders
The National Association of Home Builder’s measure of homebuilder sentiment fell again in March. Although the index’s 2 point decline down to 82 leaves it 8 points off the November record high, the current level of sentiment is still a few points above the pre-pandemic record high.
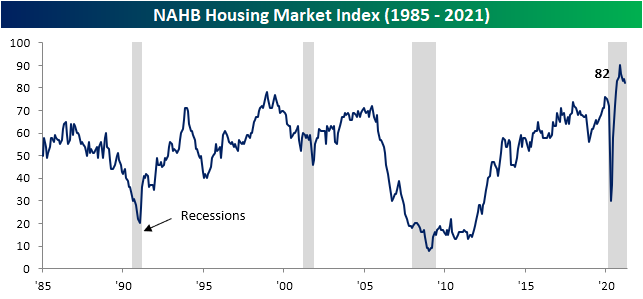
A decline in present sales drove that decline as the index fell 3 points from 90 to 87. As with the headline number, although that is a decline from the peak of 96 in November, the current reading is still above anything recorded prior to the pandemic. Additionally, considering the indices for Future Sales and Traffic have held up better, that decline in Present Sales does not necessarily point to a broader downturn in demand. Even though Present Sales were lower, the index for Future Sales rose by 3 points recovering the ground lost in February while Buyer Traffic also avoided a decline as that index went unchanged from February. Again rather than a broader deterioration of conditions, the decline in Present Sales could be a result of issues like rising prices of things like lumber and higher mortgage rates which in turn means overall higher costs of a new home.

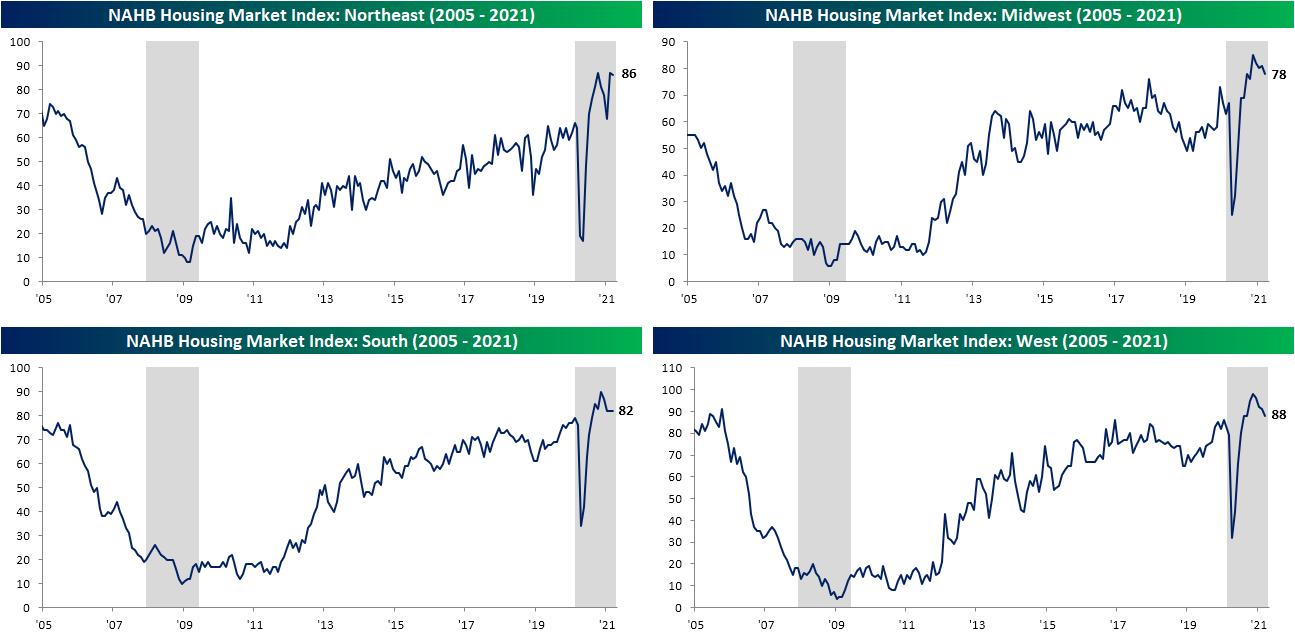
The South was the only region to avoid a decline in March. That index held steady at 82 for the third month in a row. The Northeast also fared a bit better than the other regions as the index only fell one point from last month’s level that was tied with October for a record high. The Midwest and the West fell more sharply with each index dropping 3 points. Regardless of those declines, both indices continue to come in at historically strong levels.
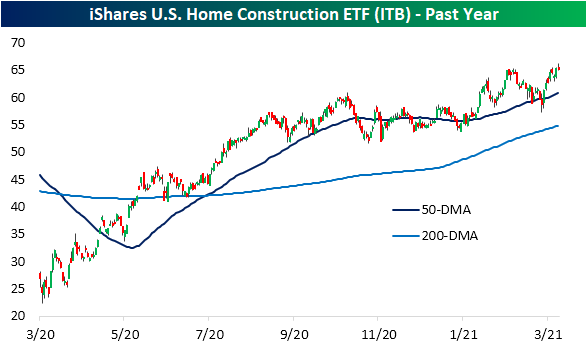
With the weaker headline release providing a bit of a headwind in terms of catalysts, the iShares Home Construction ETF (ITB) is fighting to break out and hold above its early February highs today. Last week it unsuccessfully tried to take out resistance, but still remains right below its prior highs.
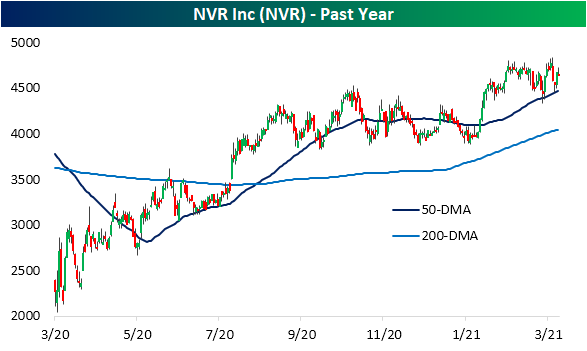
Looking across S&P 1500 homebuilder stocks, there are two in our Trend Analyzer tool that currently earn “good” timing scores: TopBuild (BLD) and NVR (NVR). Whereas the broader group is testing 52-week highs, BLD and NVR are some of the few that are not currently overbought having recently pulled back a bit. After taking a brief dip below its 50-DMA late last month, BLD has been fluctuating around its moving average over the past few days. NVR on the other hand was unsuccessful in breaking out last week which was followed by a successful bounce off of its 50-DMA yesterday. Start a two-week free trial to Bespoke Institutional to access our interactive economic indicators monitor and much more.

Bespoke’s Morning Lineup – 3/16/21 – Retail Sales Reset
See what’s driving market performance around the world in today’s Morning Lineup. Bespoke’s Morning Lineup is the best way to start your trading day. Read it now by starting a two-week free trial to Bespoke Premium. CLICK HERE to learn more and start your free trial.
“Change is the law of life and those who look only to the past or present are certain to miss the future.” – John F. Kennedy
In what seems like a change of pace from recent weeks, Nasdaq futures are leading the way higher this morning as it is actually the only one of the major indices indicated to open higher on the day. Futures weakened modestly following the release of the February Retail Sales report, and the 10-year yield is still slightly lower. The headline Retail Sales readings came in well below consensus forecasts, but mitigating factors like the storms that hit the midwest and a big upward revision to January’s report helped to soften the blow. Next up on the economic calendar is Industrial Production and Capacity Utilization at 9:15 Eastern and then Business Inventories and Homebuilder Sentiment at 10 AM.
Be sure to check out today’s Morning Lineup for updates on the latest market news and events, including a recap of moves in the rates market overnight, an update on inflation data out of Europe, Australian Housing and Central Bank data, economic sentiment, the latest US and international COVID trends including our series of charts tracking vaccinations, and much more.
Yesterday, we highlighted the fact that semis have been lagging the broader market rally. Despite the weakness, the SOX had a positive start to the week yesterday and actually managed to close back above its 50-DMA for the first time since late February. It’s a start.
Lastly, if you didn’t catch it yesterday, make sure to check out yesterday’s CNBC segment with Paul Hickey discussing markets and the state of business travel in the future.

Big Expectations Out of New York
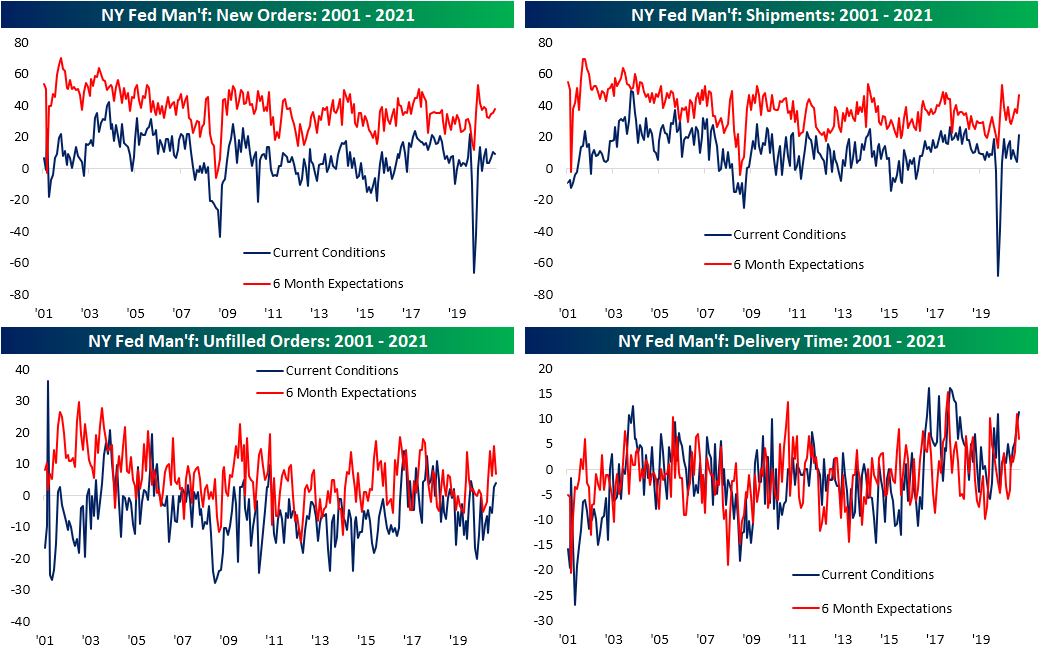
This morning the New York Fed released its monthly reading on the region’s manufacturing sector. The headline index was expected to move up to 15 from February’s reading of 12.1. Instead, the increase was even larger as the index rose 5.3 points to 17.4. In addition to that being the ninth consecutive month that the region’s manufacturing sector expanded, it also surpassed the summer high of 17.2 making for the strongest reading since November 2018.

In addition to the headline number moving higher, every other indicator also continues to show expansionary readings painting a broadly positive picture for the region’s manufacturers. The only indices to show any deceleration in March were those for New Orders and Number of Employees. Six-month expectations also remain positive, although there were more of these that were lower on a month-over-month basis.

As previously mentioned, New Orders was one of just two areas in the report to experience a deceleration in March. Falling to 9.1, this month’s reading sits in the middle of its historical range still consistent with a seventh straight month of growth in new orders. Other related indicators remain much stronger though.
With orders still growing, the index for Unfilled Orders expanded for a second month in a row climbing to the highest level since February of last year. Shipments picked up even more significantly. The index rose 17.1 points to 21.1. That is the ninth-largest month-over-month increase since the start of the survey in 2001. The most recent moves of similar or larger size were 29.1 and 42.3 point increases in May and June, respectively, of last year. As with the headline number, that is now the highest level since November 2018. Although shipments are accelerating, Delivery Times were also higher. That index now sits in the top 3% of readings
In spite of those long lead times and high demand, inventories are rising with that index gaining 1.6 points to the highest level in just over a year. Like delivery times, that stands in the top decile of readings. Looking to the future, responding firms broadly expect higher inventory levels six months down the road. That index climbed 4.6 points to 19.5 which is the second-highest reading on record behind a print of 20.3 in January 2018.

Another area of the report that continues to come in notably high is prices. Generally speaking, price increases and expectations for price increases are being reported at one of the highest clips of the past decade. Both indices for Prices Paid and Received currently are in the top 3% of all readings. Starting with a look at Prices Paid, March marked the eighth month in a row that the index rose month-over-month as it has reached the highest level since May of 2011. Similarly, expectations came in at the highest level in nine years. While Prices Received have only risen three months in a row, it is also at the highest level since May of 2011 and expectations are at the highest level since April of 2011.

While current and future indices are moving in sync with one another with regards to prices, those for employment moved in opposite directions. The index for Number of Employees was still consistent with further employment gains in March, but the index fell to the lowest level since November. While hiring growth decelerated, responding firms are much more optimistic when it comes to employment six months down the road. That index climbed 14.8 points to 31.4. That was the fourth-largest uptick on record. The only larger one-month moves were in March 2008 (+22.8 to 31.9), October 2001 (+20.5 to 12.3), and September 2004 (+16.1 to 29.2). The index is now at the highest level since June 2010.
As for Average Workweek, things were a bit more modest with the current conditions index rising to the highest level since October. Again, the index for expectations was even stronger rising to a two-year high. Click here to view Bespoke’s premium membership options for our best research available.

Bespoke’s Morning Lineup – 3/15/21 – Small Seeking Seven
See what’s driving market performance around the world in today’s Morning Lineup. Bespoke’s Morning Lineup is the best way to start your trading day. Read it now by starting a two-week free trial to Bespoke Premium. CLICK HERE to learn more and start your free trial.
Capital isn’t scarce, vision is.” – Sam Walton
Small-cap stocks are looking to continue a big streak today with the Russell 2000 looking to extend its current winning streak to seven straight days. Right now, the streak’s prospects aren’t looking great as Russell 2000 futures, along with the Nasdaq, are marginally lower as Treasury yields rise.
The economic calendar is quiet today with Empire Manufacturing the only major report on the calendar. While consensus estimates called for a headline reading of 13.0, the actual print came in at 17.4, which was the highest level since October 2018.
Be sure to check out today’s Morning Lineup for updates on the latest market news and events, including a recap of moves in the rates market overnight, an update of moves in the Asian and European market, Chinese economic data, an update on the latest national and international COVID trends, including our series of charts tracking vaccinations, and much more.
Below, we show the intraday charts of the S&P 500, Nasdaq 100, Russell 2000, and the Philadelphia Semiconductor Index (SOX) over the last four weeks. For the first three indices, last week was a big one as they put an end to their streaks of lower highs last week. The one outlier was the SOX. It too rallied last week but not by nearly enough to break its own downtrend. For an index that historically acts as a leading indicator for the broader market, the relative underperformance of the SOX isn’t ideal.

Bespoke Brunch Reads: 3/14/21
Welcome to Bespoke Brunch Reads — a linkfest of the favorite things we read over the past week. The links are mostly market related, but there are some other interesting subjects covered as well. We hope you enjoy the food for thought as a supplement to the research we provide you during the week.
While you’re here, join Bespoke Premium with a 30-day free trial!
Cars
Standstill Traffic May Be the Only Thing Keeping Crash Deaths From Skyrocketing by Alissa Walker (Curbed)
Despite a pandemic-fueled collapse in the number of vehicle miles travelled, traffic deaths soared in 2020 as clear roads meant higher speeds and more death. [Link]
We Called 8 Dealerships Asking About EVs. Here’s What They Told Us by Adam Ismail (Jalopnik)
Whether or not dealerships embrace electric vehicles will be a key to how fast they roll out in the United States, and the early indication from this informal review of dealerships across the country. [Link]
Speculation
Young retail investors plan to spend almost half of their stimulus checks on stocks, Deutsche survey claims by Holly Ellyatt (CNBC)
A survey of retail investors suggest that the latest round of stimulus checks are in large part destined for the equity market, driven mostly by younger stock buyers. [Link]
The most frequently asked questions by Robinhood traders reveal ‘new type of uninformed equity-market participant’ by Andrew Keshner (MarketWatch)
During Robinhood platform outages, stocks that were widely owned by Robinhood traders became more liquid and less volatile, suggesting that high volume free to trade buyers and sellers on the platform are adding noise to market prices. [Link]
SPAC Pioneers Reap the Rewards After Waiting Nearly 30 Years by Amrith Ramkumar (WSJ)
Blank check companies were first introduced in 1993 but didn’t really catch on until the last few years; they’re now 70% of IPOs and have raised $75bn this year alone. [Link; paywall]
NFTs
The Whales of NBA Top Shot Made a Fortune Buying LeBron Highlights by Ben Cohen (WSJ)
Digital trading cards known as non-fungible tokens have proven to be a spectacular speculation, with unique clips (which are of course widely available on YouTube or other sites) trading for millions of dollars. [Link; paywall]
Why the NFT Craze Is a Bubble Waiting to Pop by James Surowiecki (Marker)
Unique digital assets are the latest mania fueled by blockchain technology and rabid speculator enthusiasm for the next big thing. [Link]
Tech
This Chip for AI Works Using Light, Not Electrons by Will Knight (Wired)
Instead of running electrons through transistors, a startup that got its beginnings at MIT is using light to build chips that have radically higher throughput potential…if they work. [Link; soft paywall]
Tesla Is Plugging a Secret Mega-Battery Into the Texas Grid by Dana Hull and Naureen Malik (Yahoo! Finance/Bloomberg)
A subsidiary of the electric vehicle company is developing a battery near Houston that can store 100 megawatts, enough to power 20,000 homes on a hot day in Texas. [Link]
POLITICO Playbook: Scoop: Biden taps another Big Tech trustbuster by Ryan Lizza, Tarra Palmeri, Eugene Daniels, and Rachael Bade (Politico)
The Biden Administration has made multiple appointments that suggest a tight focus on antitrust in the tech industry, with a White House economic advisor and a Federal Trade Commission member both falling inside that category. [Link]
Weird News
The bizarre tale of the world’s last lost tourist, who thought Maine was San Francisco by Andrew Chamings (SFGate)
Back in 1977, a German tourist got confused on a layover and mistook Bangor, Maine for San Francisco, sparking an international media frenzy over a very confused man who spoke no English. [Link]
Brood X cicadas are about to put on one of the wildest shows in nature. And D.C. is the main stage. by Darryl Fears (WaPo)
The Delaware Valley, central Midwest, Hamptons, and eastern Tennessee are all due to receive an unholy storm of cicadas this summer as Brood X emerges from its long slumber. [Link; soft paywall]
Tax Trouble
He Got $300,000 From Credit-Card Rewards. The IRS Said It Was Taxable Income. by Richard Rubin (WSJ)
A physicist who spent $6.4mm on gift cards which he rolled into money orders deposited to his bank. The transactions were so large and numerous that they were flagged by the Treasury Department, eventually leading to an IRS investigation. [Link; paywall]
Food & Drink
Union officials: Tate’s Bake Shop workers threatened with deportation if they unionize (Long Island News 12)
Undocumented workers for Long Island bakery Tate’s are being threatened with deportation in response to a unionization drive. Tate’s is owned by Mondelez. [Link; auto-playing video]
The True Cost of a Cocktail by John Debary (Punch)
Ever wonder why a drink at a cocktail bar hits your wallet so hard? A breakdown of the costs that a cocktail typically embeds in its high menu price. [Link]
Furniture
Booming furniture sales mean ‘unprecedented’ delays for sofas and desks by Abha Bhattarai (WaPo)
Huge demand for furniture to upgrade homes that Americans are spending far more time in than usual is driving an unprecedented disruption to supply chains. [Link; soft paywall]
Read Bespoke’s most actionable market research by joining Bespoke Premium today! Get started here.
Have a great weekend!
Households’ Equity Market Exposure Continues To Rise
Last night the Federal Reserve updated its quarterly Flow of Funds (Z.1) report for Q4. The quarterly report measures income, savings, assets, and liabilities of various macroeconomic sectors. Looking at households specifically, we can measure aggregate exposure to stocks by looking at their holdings of equity investments relative to other assets. We note that this does not include mutual fund shares but it does include ETFs, closed-end funds, and REITs.
As shown below, the value of equity market assets held by households is up to 16.8/% of total assets, the highest since Q3 of 1969 and surpassing the 16.7% peak from the tech bubble. Looking at financial assets only, equity exposure is the highest since the 24.2% peak from 2000, but is nonetheless extremely elevated. We should note that while this signal is certainly a contrarian indicator, it doesn’t necessarily mean that equity markets must decline in value; there’s no reason that markets can’t continue to climb and raise the share of equity ownership further.

Things look different when we include household holdings of mutual funds and other exposure to equities. In the chart below we account for indirect allocations to equities. By this measure, Q4 equity market exposure rose to 38.0% of financial assets (versus the Q1 2000 peak of 38.3%). Equity exposure as a percentage of all financial assets hit a record, surpassing the old peak of 26.4% with a 27.0% reading in Q4. In short, households are very aggressively exposed to equity markets. This blog post is adapted from an analysis included in our nightly Closer report. Click here to start a free trial of Bespoke Institutional to get immediate access.

Bespoke’s Morning Lineup – 3/12/21 – More Yield Drama
See what’s driving market performance around the world in today’s Morning Lineup. Bespoke’s Morning Lineup is the best way to start your trading day. Read it now by starting a two-week free trial to Bespoke Premium. CLICK HERE to learn more and start your free trial.
“If you work really hard, and you’re kind, amazing things will happen.” – Conan O’Brien
With US Treasury yields rising overnight, tech stocks are under pressure this morning, while DJIA futures are higher as shares of Boeing (BA) are taking off in the pre-market. At current levels, the 10 and 30-year US Treasuries are on pace to close at post-pandemic highs in terms of yields. The only other report on the calendar this morning is Michigan Confidence at 10 AM.
Be sure to check out today’s Morning Lineup for updates on the latest market news and events, including a recap of moves in the rates market overnight, an update of moves in the Asian and European market, European Manufacturing, an update on the latest national and international COVID trends, including our series of charts tracking vaccinations, and much more.
Overall breadth in the market has and continues to be strong. This morning’s example comes from the percentage of S&P 500 Industry Groups trading above their 50 and 200 moving averages. Starting with the percentage of Industry Groups above their longer-term 200-DMA, that reading currently stands at just above 90%. During the recent equity market sell-off, that reading dropped down to as low as 75.0% but has rebounded back towards its recent highs.

Relative to the shorter-term 50-DMA, the breadth reading isn’t quite as strong but still stands at a healthy two-thirds and is up from under 50% during the recent sell-off. Obviously, this is a more volatile reading, but the longer it churns around the 50% level, the more likely it is that we see these lower readings start to drag down the strong readings in the percentage of groups above their 200-DMA. Not much of a worry yet, but something to watch going forward.

Two Sentiment Surveys Go In Opposite Directions
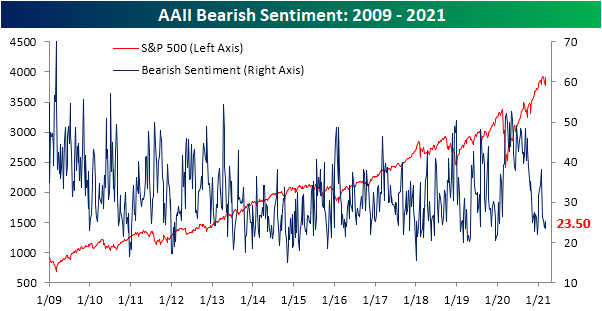
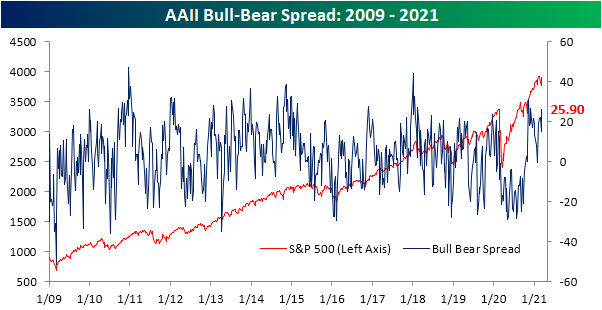
As equities have rebounded in the past week with the S&P 500 and Dow returning to all-time highs today, sentiment has gotten a boost. After falling in back-to-back weeks, bullish sentiment as measured by the AAII’s weekly survey snapped back rising 9.1 percentage points to 49.4%. That was the biggest one-week increase since the week of November 12th when it rose 17.88 percentage points, and it is also the highest level of bullish sentiment since then.

The declines in bullish sentiment of the prior two weeks saw neutral rather than bearish sentiment pick up the difference. This week again bearish sentiment went less changed than bullish or neutral. Bearish sentiment was only slightly lower falling 1.8 percentage points to 23.5%. That is the lowest level of bearish sentiment since the second to last week of 2020 when it bottomed out at 21.99%.
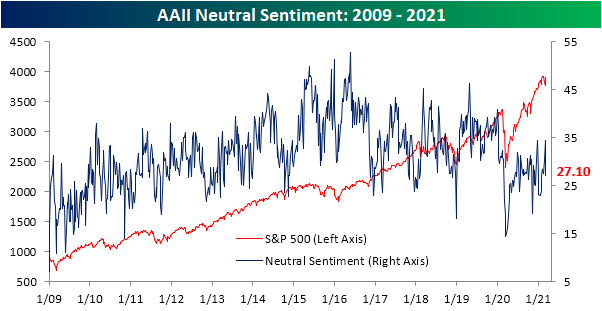
That means the gains in bullish sentiment took from the big decline in the percentage of respondents reporting as neutral. Only 27.1% of respondents reported as neutral this week, down 7.3 percentage points from the prior week. That was the largest single-week decline since the end of 2020 as sentiment is back to the same level as the start of February.
These changes in sentiment have meant that the bull-bear spread took a sharp move higher rising to 25.9. That is the highest level in the spread since the first week of December when it was slightly higher at 26.41. Prior to that, the only recent reading that was as high was November 12th which was the highest level in over two years.
While the AAII’s survey has reflected the bounce in equities over the past week, another sentiment survey is not yet reflecting this week’s price action. The Investors Intelligence survey of equity newsletter writers showed bullish sentiment fell 2.9 percentage points to 51%. That is the lowest level since the end of last May when it was 50.5%. Meanwhile, bearish sentiment rose 2 percentage points to 20.6%; the highest since early November. This survey also queries respondents on whether or not they are looking for a correction. With the Nasdaq having met the technical definition of a correction earlier this week (a 10% decline from a high), it’s not surprising that the highest share of respondents, 28.4%, reported that they are looking for a correction since late September. Click here to view Bespoke’s premium membership options for our best research available.

Jobless Claims Weaker Under The Surface
After a small uptick last week, initial jobless claims have resumed their move lower coming in at 712K this week and 13K below expectations. The 42K decline from last week’s upwardly revised reading (745K previously to 754K) entirely erased the prior week’s 18K increase as claims now stand just 1K above the pandemic low of 711K reached in the first week of November. While that is still a historically elevated reading, it is only within 17K of the pre-pandemic record of 695K.

While the adjusted number is just off the pandemic low, on a non-seasonally adjusted basis claims did reach a new low. At 709.5K, claims have taken out the previous 716.6K low from two weeks ago. From a seasonal perspective, declines during the current week of the year are the norm. Historically, the current week of the year (10th) has seen claims fall two-thirds of the time.

Adding in Pandemic Unemployment Assistance (PUA), the improvement in claims data was less impressive. PUA claims were actually higher by 41.86K on a week over week basis bringing total claims between that program and regular state claims to 1.188 million from 1.193 million last week. That is still roughly 181K above the pandemic low from early November and little changed from the past few weeks’ readings.
On a state-level basis, while a majority of states continue to report lower initial claims for both programs, the single biggest contributor to national claims continues to be Ohio. Ohio reported 126.9K regular state claims which is 20K more than the next biggest contributor, California (105.9K). For PUA claims, Ohio’s 261.7K claims in the most recent week are over 45K more than the combined total PUA claims for all other states and territories. For continuing claims, things are a bit less extreme with Ohio only accounting for 4.13% of all regular state continuing claims and 8.67% of total PUA continuing claims.

Like initial claims, continuing claims have also continued to improve, coming in below expectations (4.144 million vs. 4.2 million expected) which was also a new low for the pandemic. The 193K decline was the eighth weekly decline in a row as claims have fallen every week except for three in the past half-year.
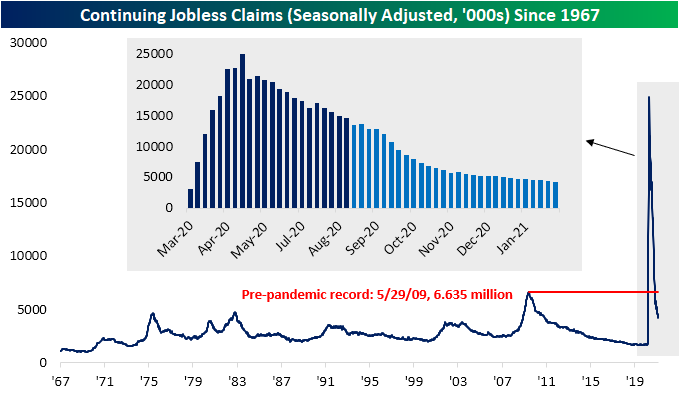
Including all programs adds an extra week’s delay to the data. For the data as of the week of February 19th, total claims were an entirely different story as they rose by over 2 million rising back above 20 million for the first time since early December. That week saw an uptick across programs, but the biggest factors were PUA claims and Pandemic Emergency Unemployment Compensation (PEUC) which rose by 1.058 million and 986.35K, respectively. For PUA claims, that was the largest increase since January 8th when there was some catch-up following the signing of the spending bill. Click here to view Bespoke’s premium membership options for our best research available.

