Claims Finally Break Below 500K
Last week’s number for seasonally adjusted initial jobless claims was revised higher by 37K. That means that while the original print of 553K was the lowest level of not only April but also of the entire pandemic, the revised reading actually changed that to make for the highest level of claims in three weeks. In spite of this, in the most recent week’s data, jobless claims dropped by 92K to 498K. That is the first reading below 500K of the pandemic era and is now down over 90% from the high in claims just over a year ago. This week’s reading is also for the first time less than double the reading from just before the massive upswing in claims in March of last year.

While there is the added factor of seasonal tailwinds—every week from the second week of April through the end of May has historically averaged a week over week decline in SA claims—on a non-seasonally adjusted basis, the data was just as positive. Although claims did not take out the 500K level by this measure, they did fall over 100K to 504.7K which also marked a pandemic low. PUA claims dropped around 20K to just above 100K. Again, that makes for the lowest level of claims both for this program and on a combined basis since the start of the pandemic.

Lagged an additional week to initial claims, continuing claims continue to look less positive. As we mentioned last week, though it doesn’t take away from the fact that there have been massive and consistent improvements in just a year’s time, continuing claims have experienced a significant deceleration in improvements over the past few months. The past couple of weeks have been the pinnacle of this. Last week’s reading was revised lower by 7K meaning the print only saw a 1K increase WoW, but that still snapped a 14 week-long streak of consecutive sequential declines. Pair that with the 37K increase to 3.69 million this week, and continuing claims have experienced the first back-to-back increases since last May when jobless claims were rising by well above 1 million per week.

Even though continuing claims via the regular state programs have plateaued, that gives an incomplete picture. Including all other programs helps to solve that, though it does create an additional week’s lag to the data meaning the most recent week is through April 16th. Including all programs, the tone is more optimistic. Total claims across all programs fell by 404K to 16.185 million. Barring the irregular drop in the first week of the year to 16.048 million when some plans had lapsed due to the timing of the signing of the spending bill, that makes for the lowest level of claims since the first week of last April. Considering the lack of improvements in regular state claims and the fact that the program accounts for a smaller share of total claims than earlier in the pandemic, the main drivers of the overall decline in total claims were significant drops in PUA claims and the Pandemic Emergency Unemployment Compensation (PEUC) program. Click here to view Bespoke’s premium membership options for our best research available.


Cruise Stocks Running Aground
The CDC issued guidance this week on how cruise operators can run test cruises in order to move closer to returning to ‘normal’ cruising operations. At the surface, one would assume that anything that moves the industry closer to returning back to business would be a positive for the sector, but when the cruise stocks have already bounced so much off their lows, a lot of the good news appears to be priced in.
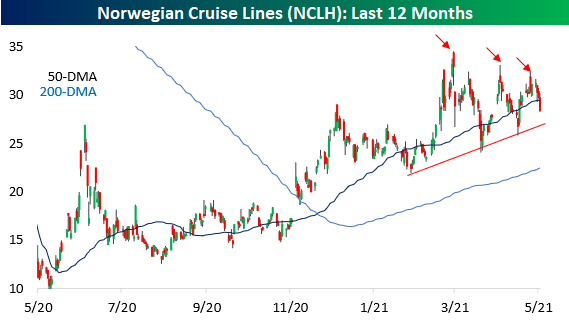
A key sign of good news being priced into a stock happens when you start to see selling into strength, and that’s exactly what we’ve seen over the last several weeks in the cruise operators. The charts below show the performance of Carnival (CCL), Norwegian Cruise Lines (NCLH), and Royal Caribbean (RCL). In each chart, we have included red arrows over days when the stocks saw strong intraday gains only to reverse lower from their highs into the close. Not only have we seen a number of these types of reversals in the last several weeks, but in most cases, each successive intraday high has been lower than the prior peak. The fact that investors are selling strength at progressively lower levels suggests a degree of eagerness to exit positions. If you’re willing to sell something for $38 today that you were selling for $40 last week, you’re what they call a motivated seller.
While the selling into strength in these cruise stocks may be disheartening if you are long, at this point the cruise operators haven’t yet shown any meaningful signs of breaking down. CCL still remains comfortably above its highs from last June and December, and each recent sell-off has been met with some buying at higher levels (motivated buyers) causing a series of higher lows. For NCLH, it’s a similar story. Of the three stocks, the only one that has been experiencing lower lows from each reversal has been RCL, but while it is currently modestly below its late 2020 high, it has yet to show a meaningful breakdown. Looking for full access to our research and market analysis? Sign up for a two-week trial today.


Bespoke’s Morning Lineup – 5/6/21 – Under 500K!
See what’s driving market performance around the world in today’s Morning Lineup. Bespoke’s Morning Lineup is the best way to start your trading day. Read it now by starting a two-week free trial to Bespoke Premium. CLICK HERE to learn more and start your free trial.
“Chronic indecision is not only inefficient and counterproductive, but it is deeply corrosive to morale.” – Robert Iger, The Ride of a Lifetime
US Equity futures are indicated higher but only modestly so as the Nasdaq looks to avoid a five-day losing streak. The big news of the morning, though, is Initial Jobless Claims which dropped below 500K for the first time since the pandemic began.
Read today’s Morning Lineup for a recap of all the major market news and events including a snapshot of major US and international index performance, as well as the latest US and international COVID trends including our vaccination trackers (which continue to show a significant deceleration in vaccine uptake), and much more.

Remember those days earlier in the year when you could look at the yield on the 10-year US Treasury and know exactly which way the Nasdaq was going. That’s still the case today, but it’s just the opposite relationship. Whereas yields and the Nasdaq were negatively correlated for much of the year, the opposite has been the case recently where the 10-year yield and the Nasdaq have been trading in the same direction over the last four trading days. That’s the way the market works, though; just when a pattern becomes so ingrained in the minds of investors, the script changes!

Still No Love for Strong Earnings
For a few quarters now we have seen extremely strong earnings reports relative to expectations. Over the long-term going back to the early 2000s, roughly 60% of stocks have topped quarterly earnings estimates. Over the last year, the beat rate has jumped up to 76%, and this earnings season we’ve seen an 81% beat rate. Prior to the current bull market that began in March 2020, an earnings beat resulted in a one-day share price gain of 1.78% on average, but so far in 2021, stocks that have beaten earnings estimates have actually averaged a one-day decline of 0.01%. This essentially means that an earnings beat is now viewed as par for the course; something that is a given. This is likely something we’ll continue to see until earnings beat rates drop back down to more normal levels.
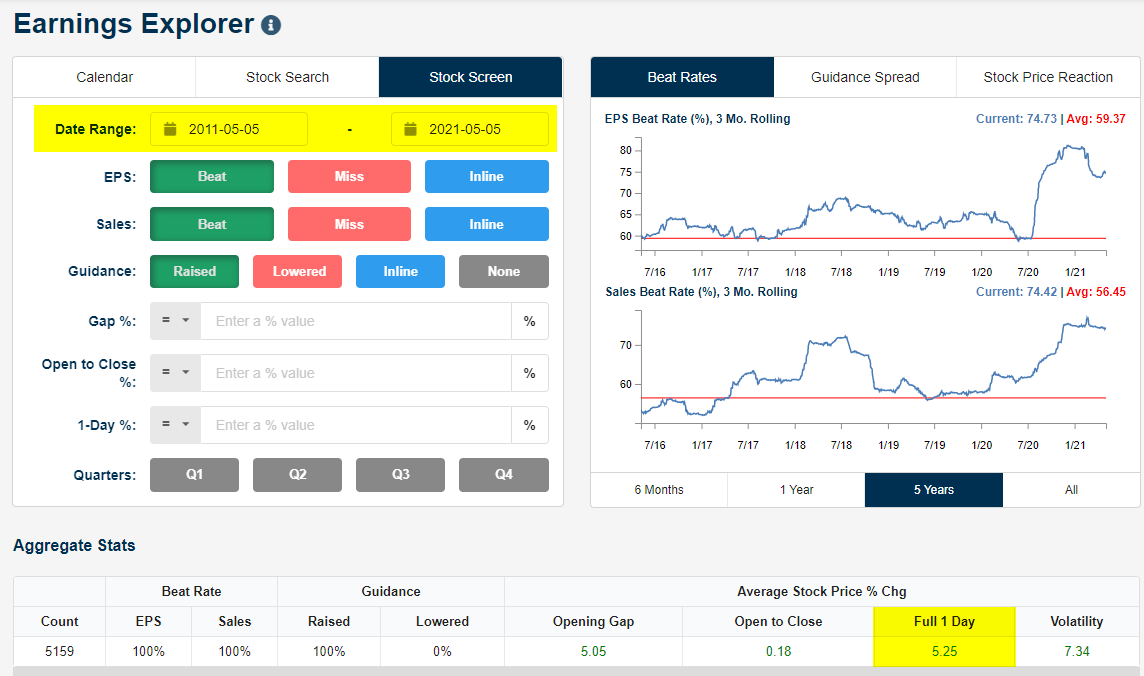
An earnings triple play is a term we coined back in the mid-2000s for a company that not only beats earnings estimates but also tops sales estimates and raises forward guidance. Triple plays (beat EPS, beat sales, raise guidance) are the “cream of the crop” of earnings season, and stocks that report triple plays have historically reacted very positively to the news.
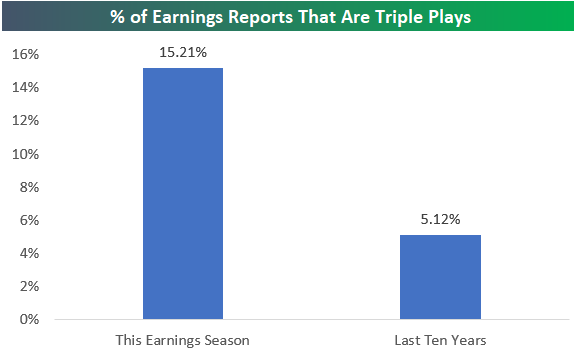
Along with an increase in the percentage of companies beating EPS estimates, we’ve also seen a sharp rise in earnings triple plays. Over the last 10 years, 5.12% of the roughly 100,000 earnings reports in our Earnings Explorer database have been triple plays. So far this earnings season, 15.21% of all earnings reports have been triple plays!
Given the sharp rise in the number of triple plays this earnings season, the normal share-price jump that usually accompanies the report has just not materialized. Below is a snapshot we took using our Earnings Explorer that provides a summary of all earnings triple plays seen over the last ten years. During this span, we’ve seen 5,159 earnings triple plays since May 2011, and these triple plays have averaged a one-day gain of 5.25% in reaction to the news. A one-day gain of 5.25% is nothing to sneeze at, but it’s to be expected (normally) when a company reports a strong quarter and raises forward guidance.
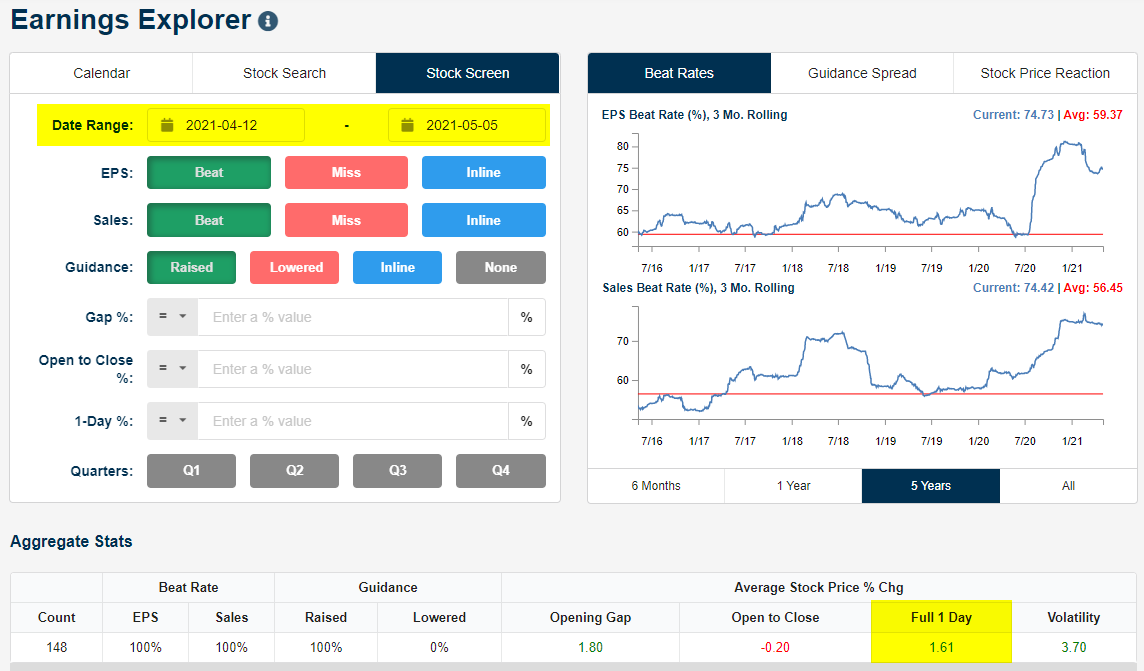
If we only look at earnings triple plays so far this earnings season, however, we see that they’re hardly gaining at all in reaction to the strong report. The 148 triple plays seen so far this season since April 12th have averaged a one-day gain of just 1.61%. That’s less than a third of the usual gain seen for triple plays. Similar to the commentary above around earnings beats, until we see the number of triple plays drop back down to more normal levels, investors will likely continue to shrug at them. Our Earnings Explorer is an excellent resource that’s available with a Bespoke Institutional membership. You can start using it today with a two-week trial.
Indian Stocks Peaked as COVID Cases Bottomed
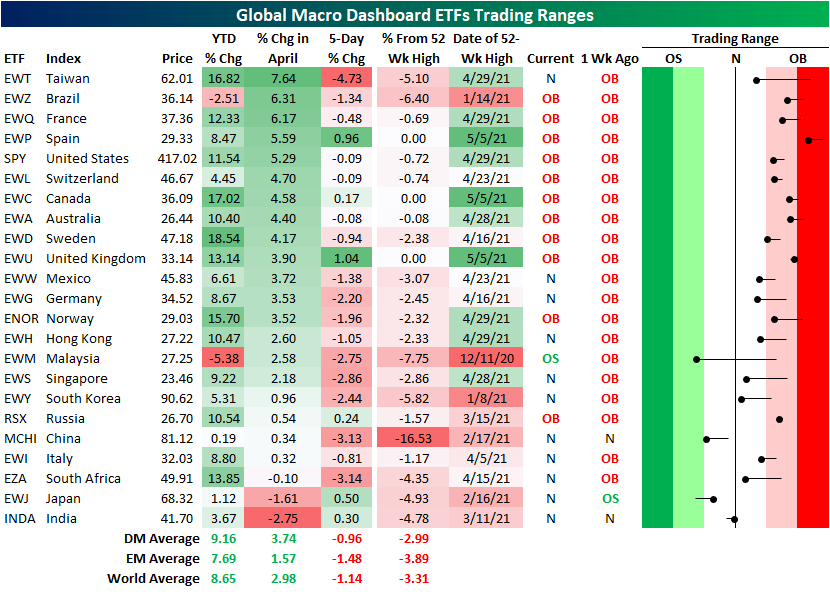
Glancing across the ETFs tracking the stock markets of the 23 countries in our Global Macro Dashboard, broadly there has been some downside mean reversion in the past week. Whereas all but three countries were over one standard deviation above their 50-DMAs last week, today that number has been roughly cut in half with only 11 countries still overbought. Many of those today are even sitting on the cusp of falling out of overbought territory. The top-performing country in the month of April was Taiwan (EWT), but over the past five days, it has been the worst performer of the group resulting in one of the biggest moves within respective trading ranges. EWT is now in neutral territory compared to extreme overbought levels last week. Another APAC country to have seen a massive move in its trading range was Malaysia (EWM). EWM fell from overbought levels all the way through its 50-DMA to oversold territory.
Elsewhere in the region, two other notable countries are India (INDA) and Japan (EWJ). As we noted in last week’s Bespoke Report, there were very few losers across asset classes in April, but two exceptions were India and Japan which fell 2.75% and 1.61%, respectively. As such, these were the two worst-performing country ETFs in April. While INDA was the worst performer last month, in the past week it is outperforming the rest of the world with a 30 bps gain. That compares to a 1.14% average loss across all 23 countries. That is also far better than the 1.48% average decline for emerging market countries.
The major factor in the weakness in Indian equities recently has been the deteriorated COVID situation in the country. As shown below, new COVID cases per day per million bottomed in mid-February but have grown exponentially ever since. Currently, new cases per day per million people are running at a pandemic high of 276.2. Interestingly, that upswing in cases coincided with the equity market stalling out and entering a short-term downtrend. Recently, case counts continue to grow albeit that growth rate has slowed a bit. Hand in hand with that slowdown, INDA has begun to turn higher and has broken the downtrend that has been in place since the March 11th 52-week high. Today, it is trading 1.76% higher and is even testing its 50-DMA from below. In both cases, those small reversals in trends are welcome signs but there is still plenty of room left for improvement. Click here to view Bespoke’s premium membership options for our best research available.

2020 Winners’ 200-Day Takeout
Thematic ETFs like those centered around clean energy and IPOs were some of the biggest winners in the ETF space in 2020, but 2021 has been the polar opposite for these same names. From the start to finish of 2020 the Invesco Solar ETF (TAN) rallied 233.64% while the broader iShares Global Clean Energy ETF (ICLN) also gained an impressive 140%. This year, though, both have been under pressure falling 25.3% and 22.1%, respectively. The worst of those declines happened in February whereas most of the time since early March has seen them stuck in a bit of consolidation. At the end of April, there were unsuccessful attempts to break back out above their 50-DMAs, and the subsequent legs lower off of those moving averages has led to breaks below the longer-term 200-DMAs this week.
While not in the clean energy space, the Renaissance IPO ETF (IPO) has traded similarly. After more than doubling in 2020, IPO has dropped 9.13% year to date and is also moving below its 200-DMA today. Cathie Wood’s popular ARK Innovation ETF (ARKK) has fallen a similar 9.31% this year after rallying almost 150% last year. While it hasn’t closed below it yet, it too is testing its 200-DMA in the wake of a recent failed attempt at moving back above its 50-DMA. For each of these ETFs, this week is marking the first close below or meaningful tests of their 200-DMAs in almost a year. Click here to view Bespoke’s premium membership options for our best research available.

Bespoke’s Morning Lineup – 5/5/21 – Payrolls Miss Forecasts
See what’s driving market performance around the world in today’s Morning Lineup. Bespoke’s Morning Lineup is the best way to start your trading day. Read it now by starting a two-week free trial to Bespoke Premium. CLICK HERE to learn more and start your free trial.
“When everything seems to be going against you, remember that the airplane takes off against the wind, not with it.” – Henry Ford
After causing some confusion and concern regarding interest rates yesterday, Treasury Secretary Janet Yellen sought to clarify her comments after the close yesterday, and futures are attempting to rally following yesterday’s weakness in response. Leading the way higher in the pre-market, the Nasdaq is looking to regain some of its steep losses. While Treasury yields were down yesterday in reaction to commentary suggesting rates would need to rise, the 10-year yield is back above 1.6% this morning after Yellen said she was neither predicting nor suggesting a need for rate hikes.
The only economic data release so far today has been ADP Private Payrolls which missed expectations by just over 100K (742K vs 875K).
Read today’s Morning Lineup for a recap of all the major market news and events including the biggest overnight events, some key earnings reports, economic data from around the world including Services sector data from Markit, as well as the latest US and international COVID trends including our vaccination trackers (which continue to show a significant deceleration in vaccine uptake), and much more.
After the mega-cap tech stocks couldn’t rally on great earnings last week, US equities have been struggling over the last week as the S&P 500 is down fractionally while the Nasdaq 100 has dropped close to 2.5%. Stocks haven’t just been weak in the US, though. The snapshot of regional international ETFs from our Trend Analyzer shows that the only ETF in the category that is up over the last week is the International Dividend Achievers (PID). Besides that, every other ETF is up over 1%. Leading the way to the downside, it has been Asia and Emerging Markets which have declined over 2%.
As a result of the recent weakness, we’ve certainly seen some cooling off in the boil we had been seeing. While the vast majority of ETFs in the category were overbought at this time last week, every one of them with the exception of PID is now in neutral territory.

Bespoke Consumer Pulse Report — May 2021
Bespoke’s Consumer Pulse Report is an analysis of a huge consumer survey that we run each month. Our goal with this survey is to track trends across the economic and financial landscape in the US. Using the results from our proprietary monthly survey, we dissect and analyze all of the data and publish the Consumer Pulse Report, which we sell access to on a subscription basis. Sign up for a 30-day free trial to our Bespoke Consumer Pulse subscription service. With a trial, you’ll get coverage of consumer electronics, social media, streaming media, retail, autos, and much more. The report also has numerous proprietary US economic data points that are extremely timely and useful for investors.
We’ve just released our most recent monthly report to Pulse subscribers, and it’s definitely worth the read if you’re curious about the health of the consumer in the current market environment. Start a 30-day free trial for a full breakdown of all of our proprietary Pulse economic indicators.

Ethereum Surges and Then Some
For many years, Ethereum may have felt like the ugly ‘step crypto’ to bitcoin, but like the swan in the fairy-tale, it has come into its own lately. Just in the last two weeks its price has surged over 50%. 50% in two weeks! Ethereum’s market cap currently clocks in at about $380 billion (compared to $1 trillion for bitcoin), so the 50% rally in two weeks works out to an increase of around $50 billion. What’s even more amazing about Ethereum’s surge over the last two weeks is that it isn’t even close to a record in terms of two-week gains. As recently as January, Ethereum saw its value more than double in two weeks.
The chart below shows the rolling two-week change of Ethereum over the last three years. During that span, there have actually been five other periods where the two-week change was even higher.

When anything appreciates 50%+ in a two-week span, it only seems logical that it would experience some sort of reversion to the mean. Then again, a two-week rally of 50% seems to defy all logic in the first place, so who knows. The chart below shows the price of ether over the last three years with red dots showing every time the trailing two-week return was greater than 50%. Looking at the chart, there were pullbacks following some of the prior periods, but they were hardly guaranteed. After the most recent surge in January, for example, ether prices barely experienced a hiccup.

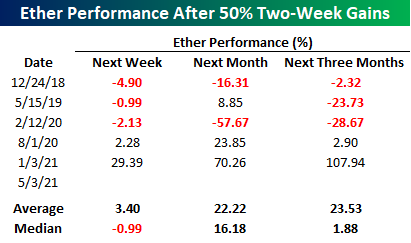
The table below shows the performance of ether over the following week, month, and three months after the first day in each period where ether prices saw a 50% two-week gain. In three of the five prior periods, ether was lower in price a week later for a median decline of 1%. One month later, though, ether rallied three out of five times for a median gain of 16.2%, and three months later, the median gain was 1.88%.
Looking at the results, there is obviously no clear trend in ether prices following similar surges over a two-week span, but the magnitude of the moves in either direction shows just how volatile investing/trading in the crypto-space can be. Click here to view Bespoke’s premium membership options for our best research available.
Bespoke’s Morning Lineup – 5/4/21 – Early Weakness
See what’s driving market performance around the world in today’s Morning Lineup. Bespoke’s Morning Lineup is the best way to start your trading day. Read it now by starting a two-week free trial to Bespoke Premium. CLICK HERE to learn more and start your free trial.
“As society becomes more and more complex, cheating will in many ways become progressively easier and easier to do and harder to police or even understand.” – Vitalik Buterin
Equity futures were mixed up until about an hour ago with the DJIA indicated to open higher while the Nasdaq was lower. Shortly before 8 AM Eastern, we saw a leg lower with the Nasdaq leading the way and now down closer to 1%. Oddly enough, while one might expect the weakness, especially in the Nasdaq, to coincide with a tick higher in rates, yields on the 10-year actually dropped below 1.6% as futures moved lower. In the grand scheme of things, this isn’t a major move, but it does mark a continuation of the trend of weaker breadth we have seen in the Nasdaq lately that we discussed in last week’s Bespoke Report.
Read today’s Morning Lineup for a recap of all the major market news and events including the biggest overnight events, some key earnings reports, economic data from around the world, as well as the latest US and international COVID trends including our vaccination trackers (which continue to show a significant deceleration in vaccine uptake), and much more.
Moving from the equity market world to the crypto world, just when the general public was finally becoming familiar and comfortable with bitcoin, ethereum has taken the spotlight. While bitcoin has essentially moved sideways over the last 2+ months, the price of ether has practically doubled. Following the divergent performances, the relative strength of ether versus bitcoin has surged in the last several weeks to the point where ether is actually outperforming bitcoin over the last three years.

Looking at it another way, the ratio of bitcoin to gold has plummetted. Back in September 2019, the ratio of bitcoin to gold peaked out at 61.1. Then around the March 2020 equity market lows, the ratio had shrunk to just under 50. Through yesterday, the ratio has now been cut by two-thirds since March 2020 to 17.5 – the lowest level since the summer of 2018.

Compared to gold, ether’s value has surged. At the start of the year, ether was worth less than a half-ounce of gold. Yesterday, it was worth nearly two ounces of gold! Talk about a rally.
