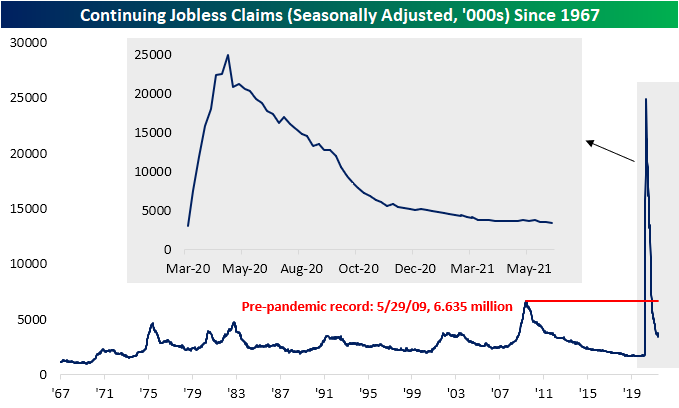
Claims Disappoint But Resume Improvements
Last week, jobless claims saw a significant one-week uptick off the pandemic lows, and while claims are still elevated around some of the highest levels since mid-May, there was an improvement this week with a 7K decline to 411K. Granted, that also did not live up to expectations of a decline back down to 380K which would have been just 6K above the pandemic low.

On a non-seasonally adjusted basis, claims through regular state programs actually came in below 400K falling 14.7K to 393.1K. A sequential decline in the non-seasonally adjusted number for the current week of the year is somewhat unusual as this reading on jobless claims has historically risen two-thirds of the time. While regular state claims were lower, claims through the Pandemic Unemployment Assistance (PUA) program were higher. The past several weeks have seen steady improvements in PUA claim counts with a low of 71.2K at the beginning of the month, but after rising for two straight weeks now, it is back above 100K for the first time since the first week of May.

Since the last week of April, continuing jobless claims have been pretty choppy with every other week seeing a rise in claims. Granted, the weeks in between in which claims have fallen have seen larger declines than the previous week’s increase. This week was yet another example of this as claims fell 144K to erase last week’s 17K uptick which brought claims to a new pandemic low of 3.39 million. In other words, continuing claims are not improving in as consistent of a manner as they did for most of the past year, but nonetheless, they have continued to improve.
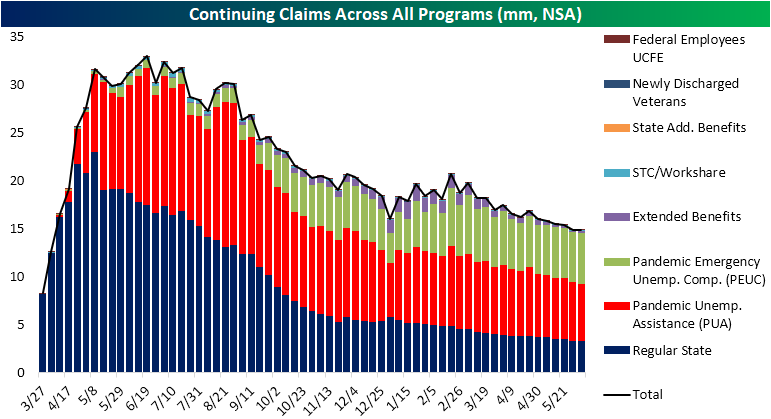
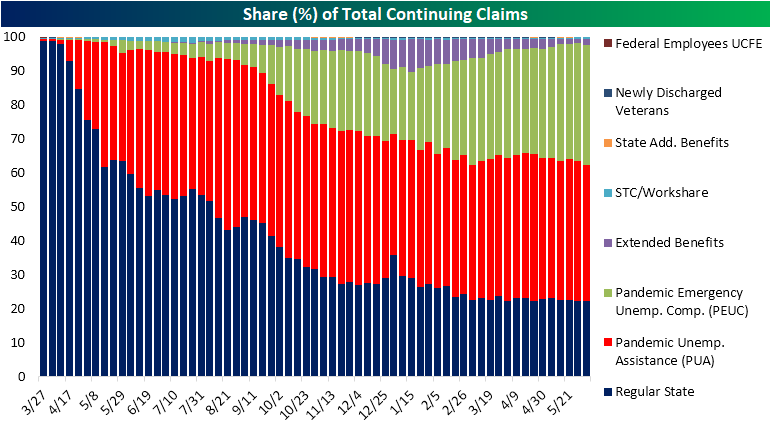
When including other programs on top of regular state claims, the improvements have been more consistent, but the most recent week (June 4th) did see a small uptick in total claims from 14.866K to 14.871K. In the charts below we show continuing claim counts (non-seasonally adjusted) for all programs. This data is lagged an additional week to the most recent release of claims for regular state programs, but the overall trend continues to be one of improvement. While total claims were higher, the PUA program did experience a large 175K decline, although that was offset by a 107.9K uptick in PEUC claims and a 97.7K increase in Extended Benefits. We would also note, as we did last week, that this is the last week of data before half of the states began to withdraw from pandemic era unemployment relief. that means data in the weeks to come is likely to see overall claim counts fall on account of fewer states reporting for certain programs. Click here to view Bespoke’s premium membership options.
Bespoke’s Morning Lineup – 6/24/21 – Semi Stall
See what’s driving market performance around the world in today’s Morning Lineup. Bespoke’s Morning Lineup is the best way to start your trading day. Read it now by starting a two-week free trial to Bespoke Premium. CLICK HERE to learn more and start your free trial.
“Altogether too often, people substitute opinions for facts and emotions for analysis.” – Andrew S. Grove
The Nasdaq is looking to make it four in a row today as US futures are higher across the board. Optimism on a possible breakthrough in infrastructure negotiations as well as some dovish commentary from the BoE are providing catalysts for today’s move. There’s a very big slate of economic data on the calendar, though, as well as a number of Fed officials scheduled to speak, so investors will have to navigate through all of these throughout the day. Early data released so far have generally been in line to weaker than expected, and the yield on the 10-year US Treasury is still below 1.5% down to 1.48%.
Read today’s Morning Lineup for a recap of all the major market news and events from around the world, updates on confidence data from Europe and Canada, the latest US and international COVID trends including our vaccination trackers, and much more.

We’ve seen the pattern below for the semiconductor index in a lot of areas of the market lately, especially the ones that were big winners last year. The Philadelphia Semiconductor Index isn’t far from its record highs in April, but it has essentially been in a sideways range for the last six months, a period in which it has traded in a relatively narrow range of 21.4%. As the group looks to bounce from here, if it can’t break out to new highs, or even stalls out short of its high a few days ago, look for technicians to start calling out a loose head and shoulders pattern.

Semiconductor stocks have become less volatile as the group has matured, but even the recent range is on the low side of the historical average. As shown in the chart below, the current six-month range for the stock is the narrowest since October 2018.

Bespoke’s Morning Lineup – 6/23/21 – The More Things Change…
See what’s driving market performance around the world in today’s Morning Lineup. Bespoke’s Morning Lineup is the best way to start your trading day. Read it now by starting a two-week free trial to Bespoke Premium. CLICK HERE to learn more and start your free trial.
“The only constant in the technology industry is change.” – Marc Benioff
Change may always be afoot when it comes to technology, but for the Nasdaq, there hasn’t been much change over the last two days as the index rallied 111 points (+0.79%) on both Monday and Tuesday! Even more ironic when it comes to change is that yesterday Microsoft (MSFT) became just the second US company to ever have a market cap of more than $2 trillion. Microsoft has seen a lot of change over the last two decades, but just like back in the late 1990s and early 2000s it remains right near the top of the list when it comes to being one of the most valuable companies in the world.
Futures are pointing to a modestly higher open this morning while the 10-year yield is exactly unchanged. Besides updates on PMI readings from Markit, New Home Sales will be released at 10:00 AM eastern, and there’s a number of Fed speakers on the calendar.
Read today’s Morning Lineup for a recap of all the major market news and events, an update on the Delta variant, overnight economic data, and the latest US and international COVID trends including our vaccination trackers, and much more.
With the Nasdaq up over 1.5% in the first two trading days of the week, the Technology sector traded at a new record high yesterday taking out its highs from April. Since the October lows, Technology has underperformed the broader market but it has been trading in a steady uptrend with higher highs and higher lows.

Bitcoin Hangs on to 30K
It has been a roller-coaster ride for bitcoin today. After breaking below $32K, then $31K, $30K, and $29K all within a matter of hours, buyers stepped in and prices rebounded back above $32K. Over the course of the day, bitcoin prices were down over 11% versus the prior day’s close but have rebounded more than 14% off the intraday lows. A 10% intraday decline coupled with a 10% intraday bounce is practically unheard of in the equity markets, but for bitcoin, it has become increasingly common. This year alone, today’s reversal marks the fifth such intraday rebound of 10%+ following a 10%+ intraday decline, although it only happened twice in 2020 and three times in 2018.
As far as bitcoin’s price chart is concerned, today’s bounce represents another in what is becoming a long list of testing the $30K level. It happened twice back in January before bitcoin rocketed above $60K and has now happened four times since prices started to fall in early May. When it comes to technicals, the more often a security tests support or resistance, the weaker it is considered to become. If that holds true with bitcoin, a few more tests of that level in the short term could open the floodgates to the downside.
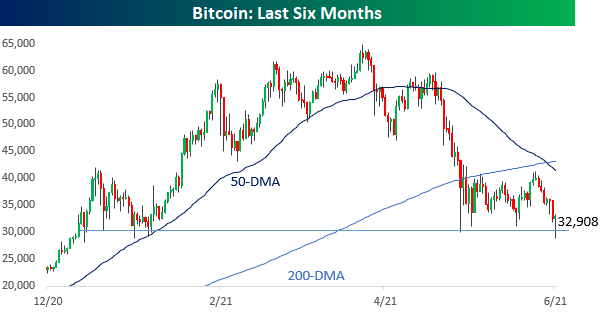
Even after today’s bounce in bitcoin, its price is still over 48% below its all-time high reached just over two months ago in mid-April. While 48% sounds pretty steep, it looks like a walk in the park compared to prior drawdowns. Following peaks back in early 2011, early 2013, late 2013, and late 2017, bitcoin’s price fell anywhere from 70% to 93% each time. Even more surprising is the fact that since the start of 2011, bitcoin’s average percentage spread between its closing price on a given day and the all-time high as of that date was 48% – which is right where it is now. Click here to view all of Bespoke’s premium membership options and sign up for a trial.

New Orders Support Richmond Fed Manufacturing
After disappointing readings from the Empire and Philly Fed releases last week, the Richmond Fed provided a sigh of relief for US manufacturing as this morning’s release moved up to 22 versus estimates for an unchanged reading of 18. The four-point increase month over month brings the index into the top 5% of all readings since the survey began in 1993. That indicates the region’s manufacturing sector continued to grow at a historically rapid rate in the month of June.

In spite of the strong headline reading, breadth in the report was actually negative with almost twice as many sub-indices falling month over month versus making a move higher. A huge 17 point jump in New Orders was to thank for the stronger reading in the headline number making up for the broad declines across categories. Although many indices fell versus May, the vast majority remain in expansionary territory. Even those in which that was not the case, like those for Inventories and Availability of Skills, the negative readings are not necessarily signs of weakness either.
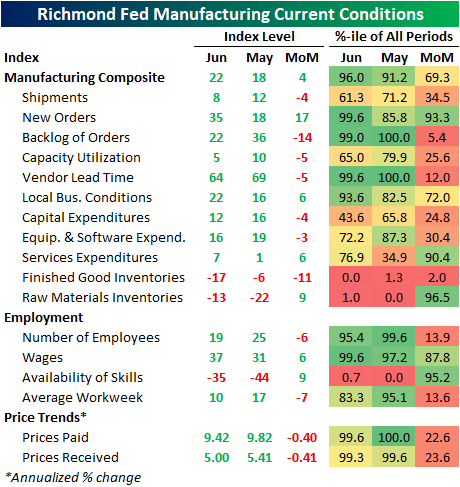
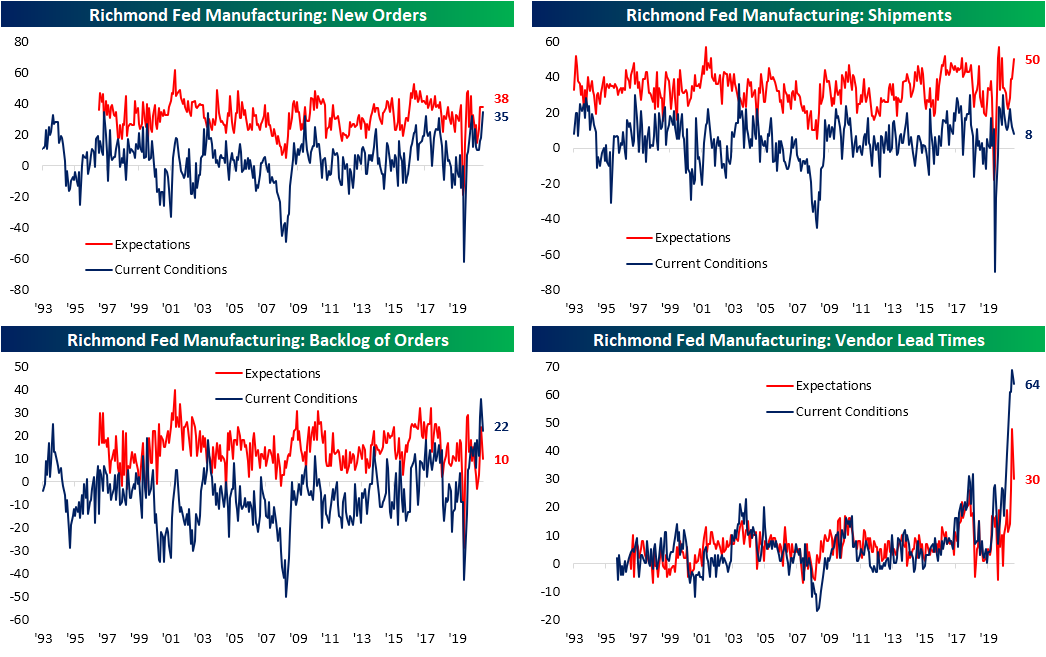
As previously mentioned, New Orders ripped higher rising 17 points to 35, the joint highest reading on record alongside the September 1997 reading. As the component with the largest weight (40%), that bolstered the composite reading in a big way more than making up for the declines in Shipments and Number of Employees. Even though New Orders accelerated considerably, Order Backlogs saw a massive deceleration as that index dropped 14 points. Even with that decline, the index is still in the 99th percentile of all months. Although backlogs are growing at a historic pace, shipments have yet to pick up as that index fell 4 points to the lowest level in a year.
As for why shipments are not growing at the same pace as orders, supply chain issues seem to be part of the problem. The Vendor Lead Times index (higher readings indicate longer lead times and vice versa) has backed off of the record high but is still far above any level with historical precedence. In addition to the improvement in current conditions for this category, expectations also saw a massive 18 point decline; ranking as the second-largest month-over-month decline on record behind a 23 point drop last June. That optimism in the improvement in supply chains was also likely the reason for the improvement in optimism for shipments. Diverging from the current conditions index, that optimism reading rose 11 points to the top 2.5% of all readings.
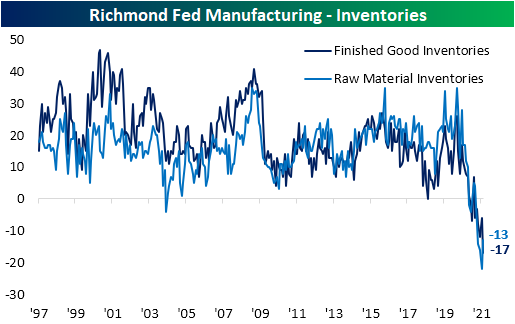
Those long lead times are also impacting inventories which in turn is impacting shipments. Finished Good Inventories are at a record low after falling 11 points MoM while the Raw Material Inventories index bounced, but is also contracting at a rate unparalleled with any other period in the survey’s history. Putting aside the supply chain headwinds, the need to rebuild those inventories should be a positive for growth going forward.
Long lead times, low inventories, and strong demand can only mean one thing: higher prices. Input prices pulled back slightly but are still rising at an unprecedented 9.42% annualized rate. Those higher prices have been passed onto consumers with prices received growing at 5% annualized, though, that is lower than the 5.41% rate last month.

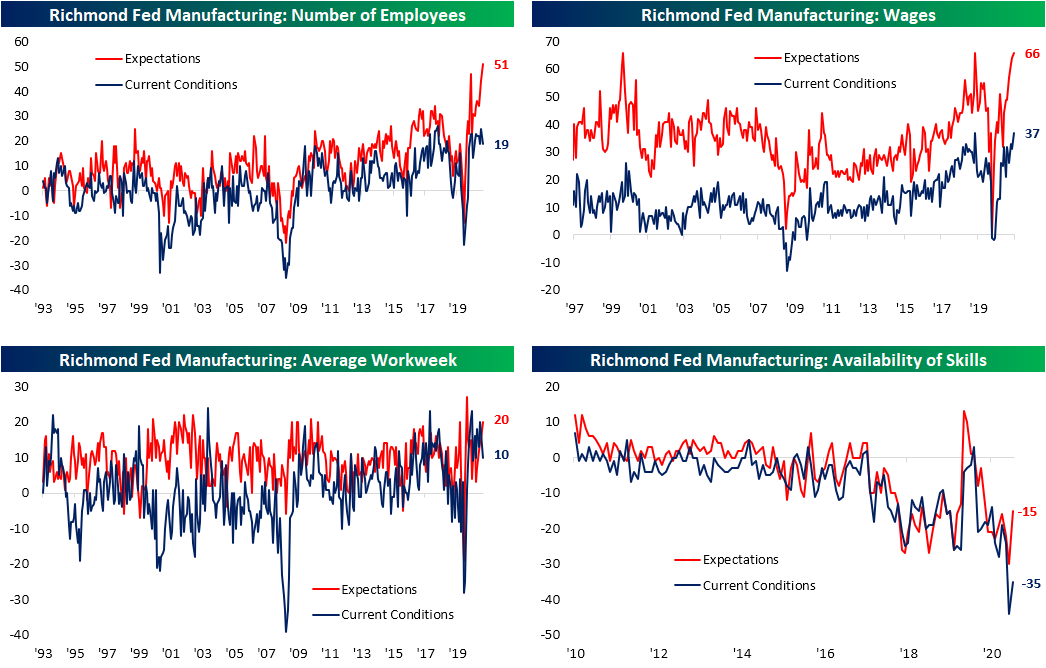
Perhaps the most optimistic area of the report was in regards to employment. While the current conditions index fell, expectations for the Number of Employees index hit a record high in June. That disconnect between actual increases in employment and the desire to hire has to do with a lack of needed workers. The index for Availability of Skills rose 15 points month over month, one of the biggest one-month upticks to date, but that leaves the index well below the past eleven years’ range when the Richmond Fed first began to survey on the topic. Taking action on that lack of labor supply, businesses are raising wages at one of the fastest clips on record, and expectations are not pointing to any slowdown in that trend. Click here to view all of Bespoke’s premium membership options.
Japanese Equities Swing Big
In today’s Chart of the Day, we detailed how the S&P 500 has swung down then up by over 1% in back-to-back sessions as the index sits just off of record highs. Over in Japan, the Nikkei has seen even more wild swings with a 3.29% decline yesterday followed by a 3.12% gain overnight. In terms of that decline yesterday, there was an even larger single-day drop as recently as February, but the bounce overnight marked the biggest single-day gain in a year and one week. The past couple of days also marked the first time since June of last year that Japanese equities fell at least 3% in one session and then rallied 3% or more in the following session.
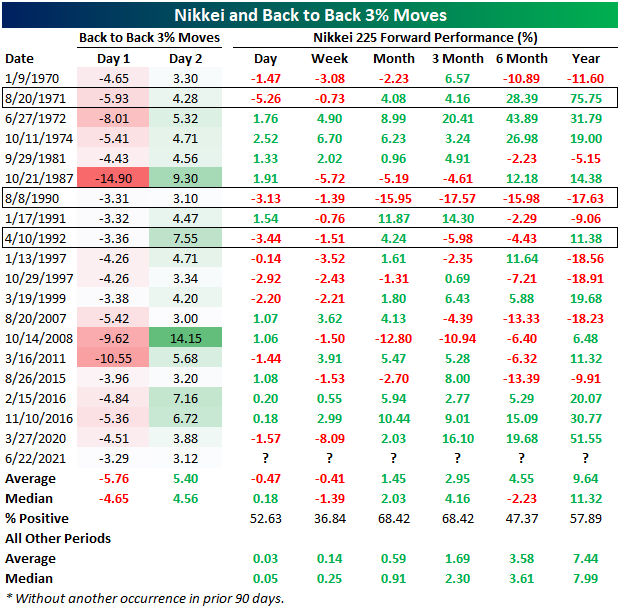
In the chart below, we show the Nikkei going back to 1970 with every other time the index has experienced a similar-sized move. Such moves of a 3% decline one day and a 3% rally the next have been relatively uncommon. In total (including this week), there have been only 30 days with these types of back-to-back moves. Again, the most recent occurrences were on June 15/16th and March 26/27th of last year. Prior to that, there was not another occurrence since November 2016 in the wake of the US Presidential Election. While there have not been many of these instances in the grander scheme of things, they have occurred with some regularity with an instance every few years or so with the biggest gap between occurrences being in the early 2000s.

Given it has been over a year since we have seen such a move, in the table below we show each of the 19 past times in which the Nikkei fell at least 3% followed by a 3% or larger rally without another instance in the prior 3 months. For each occurrence, we show the Nikkei’s move over the next day, week, month, 3 months, 6 months, and year.
Only three of these instances—in 1971, 1990, and 1992—saw a similarly volatile session (defined as at least a 3% move) on the third day, and each of those saw a move lower. While it has not necessarily been common for that volatility to continue for a third consecutive day, in aggregate the next day has pretty much been a toss-up averaging a 47 bps decline (median 18 bps gain) with a positive move only slightly better than half the time. Weakness has most consistently been seen one week out as the Nikkei has experienced a median decline of 1.39%. The last occurrence in March of last year, in fact, saw the biggest decline one week out when the Nikkei fell over 8%. While there is again some underperformance six months after such moves, one, three, and twelve months later all have seen the Nikkei outperform the norm and make a move higher more often than not. Click here to view Bespoke’s premium membership options for our best research available.
Bespoke’s Morning Lineup – 6/22/21 – Some Positive Follow Through
See what’s driving market performance around the world in today’s Morning Lineup. Bespoke’s Morning Lineup is the best way to start your trading day. Read it now by starting a two-week free trial to Bespoke Premium. CLICK HERE to learn more and start your free trial.
“If you’re feeling good, don’t worry. You’ll get over it.” – Yogi Berra
Bulls look like they have a little more gas in the tank after yesterday’s big rally as futures are modestly higher. Crypto assets are another story, though, as bitcoin just broke through $31,000 and went tight through $30,000 after that. Treasury yields are modestly higher, but the 10-year yield still remains below 1.50%. There’s a decent amount of Fedspeak today with Mester, Daly, and Powell all on the calendar to speak between now and the end of the day. In terms of economic data, the only two indicators on the schedule are Existing Home Sales and Richmond Fed.
Read today’s Morning Lineup for a recap of all the major market news and events, an update on the decline in crypto assets, overnight economic data, and the latest US and international COVID trends including our vaccination trackers, and much more.
Yesterday’s rally in the S&P 500 saw the strongest breadth in terms of the advance/decline line (+459) since April 2020. Noth only was breadth notably strong, but it followed a Friday where breadth was notably weak (-401). With the net A/D reading on both days coming in above +400 or below -400, they both qualified as ‘all or nothing days’. All or nothing days in the market are uncommon enough, but it’s not often that you see a negative all or nothing day immediately followed by a positive one. The last time it happened was in early March 2020 just as the market was in the middle of the COVID crash, and there have only been 36 occurrences since 1990.
For the entire year so far, yesterday’s all-or-nothing day was just the sixth such occurrence so far this year putting 2021 on pace for 13. That’s a far cry from last year’s total of 43, and if the pace keeps up, it would go down as the second-lowest number of all or nothing days for a given year since 2007. The only other year during that span with fewer was 2017. One thing to remember, though, is that while the pace so far this year has been slow, as the last two trading days have shown, all or nothing days often tend to show up in bunches.

Memory Lane: The Best and Worst Days of This Week Through History
With a 500-point decline in the Dow last Friday and a 500-point gain today, volatility in the markets has picked up, but days like the last two pale in comparison to the most extreme up and down days of the upcoming week in market history. For these two extremes, we have to go all the way back to 1950 and 1931.
The worst market day of the current week in the history of the S&P took place on 6/26/1950 when the S&P fell 5.4%. Stocks jolted downward that day on the uncertainty surrounding the Communist invasion in Korea with North Korean tanks crossing over the 38th parallel and invading the South Korean capital of Seoul. President Truman condemned the ‘latest aggression in Korea in defiance of the Charter of the United Nations’ and pledged his full support of U.N. efforts to end the fighting. The nature of the support and whether American troops would be sent to Korea if the U.N. requested them, however, was left unanswered.
The fact that the Soviets were considered responsible for this aggressiveness brought into focus the fact that like Korea, Germany was a split country with a lack of military force in place to prevent a Soviet-sponsored proxy invasion. The worrying implications of the invasion resulted in heavy price action reminiscent of the fall of France on 5/21/1940 (-9.14%) as volume surged to the highest levels since that day.
The S&P’s decline on June 26th, 1950 had been preceded by a year-long bull run marked by a resurgence of public participation in markets. At the market open, imbalances were so wide between bids and offers that it took certain issues upwards of an hour to open for trading, and once they opened for trading, selling was exacerbated by stop-loss orders. Liquidations continued to come through the market in waves, with trading periodically coming to a standstill only to be interrupted by larger volumes of even more aggressive selling, with the low of the day being the close. How bad was the selling? For the entire day, only 59 of the 1,256 (4.7%) issues traded were up on the day. Radio Corporation was the heaviest traded issue of the day on 124,000 shares, slipping 2 1/4 points to a price of 19 5/8, Chrysler lost 7 to 73, and General Motors fell 6 3/8 to 90 1/8.
Selling in June 1950 continued right up through mid-July and the S&P dropped about 14% from its peak to trough. As bad as the day was, the market would erase this loss by 9/15, less than two months later, and it kept rallying from there. Click here to view Bespoke’s premium membership options.

The best market day of the current week in the history of the S&P took place on 6/22/1931 when the S&P rallied 10.5%. Over the weekend of 6/21/1931, President Hoover unveiled a proposal to put a one-year moratorium on upwards of a quarter billion dollars of World War I reparations and war debts owed to the United States. Hoover noted that “The purpose of this action is to give the forthcoming year to the economic recovery of the world and to help free the recuperative forces already in motion in the United States from retarding influences from abroad.” Wall Street initially loved Hoover’s plan to help alleviate the Great Depression in Europe, and investors, previously starved for good news, cheered the plan. Those Wall Street firms with international connections reported a surge in foreign demand for equities, and professional traders sought out the most shorted stocks and caught the shorts flat-footed squeezing them out of their positions. The brighter economic outlook also provided a lift to commodity prices.
Unfortunately, the bullish party ended early, and just as the losses from 6/26/1950 were erased within two months, the gains from 6/22/31 were gone by early September. Hoover’s moratorium, which didn’t have anywhere close to universal support in the US and Europe, didn’t pass in Congress until that December. In that ensuing period, though, Germany would have not just a currency crisis but a banking collapse as well, and then soon after Great Britain abandoned the gold standard. As optimistic as Wall Street was on 6/22/1931, all of the gains were erased by 9/8 of that year, and the market continued its slide right up through mid-1932 when it made the final Great Depression lows – 70% below where it closed on 6/22/31! Click here to view Bespoke’s premium membership options.

Bespoke’s Morning Lineup – 6/21/21 – Equities Look to Regroup
See what’s driving market performance around the world in today’s Morning Lineup. Bespoke’s Morning Lineup is the best way to start your trading day. Read it now by starting a two-week free trial to Bespoke Premium. CLICK HERE to learn more and start your free trial.
“I’m the fellow who takes away the punch bowl just when the party is getting good.” – William McChesney Martin, Jr.
Investors got the first hints of the punch bowl being taken away in the post-COVID world last Wednesday, and they haven’t taken it well. The Dow was down every day last week which was the first “o-fer” an entire week the index has experienced since February 2020 just as the COVID crash was getting underway. Bulls are attempting to regroup this morning after last Friday’s plunge with all of the major US indices trading higher in the pre-market, but it’s still early. The economic and earnings calendars are light today with the only economic report being the Chicago Fed National Activity Index missing expectations (0.29 actual vs 0.70 forecasts). While quiet on the data front, there will be plenty of Fedspeak to contend with.
Read today’s Morning Lineup for a recap of all the major market news and events, the latest economic news from around, a discussion of elections in Europe, South Korean trade data, and the latest US and international COVID trends including our vaccination trackers, and much more.
Last week was a rough one for most sectors, and the most damage was done in cyclical sectors. Materials, Financials, and Energy were all down over 5% while another three sectors were down over 3%. The only sector to successfully swim against the tide was Technology which managed to trade up a mere 0.08%. In the wake of last week’s decline, no sectors are overbought, four are oversold, and one (Utilities) is at ‘Extreme’ oversold levels.

As mentioned above, Technology was able to buck the trend last week and finish the week higher, and because of that the Nasdaq 100 remains just shy of record-high levels. The S&P 500, meanwhile, doesn’t look nearly as strong as it closed below its 50-DMA on Friday for the first time since March 8th. These two indices are both telling different stories.

Bespoke Brunch Reads: 6/20/21
Welcome to Bespoke Brunch Reads — a linkfest of the favorite things we read over the past week. The links are mostly market related, but there are some other interesting subjects covered as well. We hope you enjoy the food for thought as a supplement to the research we provide you during the week.
While you’re here, join Bespoke Premium with a 30-day free trial!
History
The “Quaker Comet” Was the Greatest Abolitionist You’ve Never Heard Of by Marcus Rediker (Smithsonian Mag)
A fascinating biography of little-known Quaker abolitionist Benjamin Lay, whose fiery condemnation of slavery was among the first of the faith in America, long before the Delaware Valley became a hotbed of anti-slavery sentiment. [Link]
Who were the world’s first bakers? by Sarah Reid (BBC)
New evidence has pointed to the use of flour and bread baking in Australia tens of thousands of years before the previous consensus start of baking in the Middle East much closer to our contemporary period than it was to the ancient breadmaking of Aborigines 50 millennia ago. [Link]
Personal Profiles
This Is the Story of a Man Who Jumped Into Lake Michigan Every Day for Nearly a Year by Julie Bosman (NYT)
A revealing story of a man driven to frigid plunges into Lake Michigan by the pain of pandemic, politics, and at first anyways, a truly nasty hangover. [Link; soft paywall]
Three Hurricanes. A Deep Freeze. A Biblical Flood: Lake Charles Is America’s Climate Future by Zahra Hirji and Brianna Sacks (BuzzFeed)
The brutal stories of Lake Charles, Louisiana families that have lived through a brutal series of weather events. Houses and lives destroyed; they stand as a cautionary tale of climate change risks which loom over large swathes of the country. [Link]
Investing
Turn Turn Turn: Rotations Persist by Liz Ann Sonders (Charles Schwab)
While US markets have generally ground higher over the last couple of quarters, there has been a lot more going on under the surface, and that’s likely to continue. [Link]
Crypto
Bitcoin and the wealthy by Eva Szalay (FT)
An interesting dive into how some of the largest holder of bitcoin and other cryptocurrencies are thinking about managing their fortunes. [Link; paywall]
Crypto’s Weimar by Frances Coppola (Coppola Comment)
A post-mortem on the complete collapse of cryptocurrency TITAN and its stablecoin IRON, driven by poor design of the ecosystem that generated a “Weimar moment”. [Link]
Banking
Goldman Sachs reportedly plans to move more than 100 bankers to Florida by Lydia Moynihan (NYP)
A new Palm Beach office is luring dozens of Goldman employees who are marching south as their New York colleagues march back into the office. [Link]
Wall Street Banks Warn Their Trading Boom Is Over by David Benoit (WSJ)
Volatility and portfolio turnover drove a massive increase in trading activity during the pandemic, but banks are expecting that across FICC and equities Wall Street trading desks will book much less business going forward than they did during the last five quarters. [Link; paywall]
Boom & Bust
U.S. Housing Market Needs 5.5 Million More Units, Says New Report by Nicole Friedman (WSJ)
The shortfall in construction following the financial crisis has left US housing markets badly undersupplied and population has continued to grow steadily, leaving the US housing market badly short of units across the spectrum of housing types. [Link; paywall]
Honeywell Shuts Two Mask Factories as Face-Covering Demand Drops by Thomas Black and Shira Stein (Bloomberg)
As demand for N95 masks recedes, two manufacturing facilities spun up by Honeywell earlier this year will shutter, though another factory in the US continues to push out the masks. [Link; soft paywall]
Regulation
Lina Khan: The 32-year-old taking on Big Tech by James Clayton (BBC)
A profile of the surprisingly young chair of the Federal Trade Commission and her effort to target large digital companies with century-old antitrust regulations. [Link]
On this day in 2015, the Irish government accidentally legalised drugs for 24 hours by Rachael O’Connor (Irish Post)
Six years ago, a host of drugs were made totally legal for consumption and sale in Ireland thanks to a legal loophole that made the 1977 act banning 125 substances unconstitutional. [Link]
Psychology
How Humans Think When They Think As Part of a Group by Annie Murphy Paul (Wired)
Working together may not only improve efficiency by distributing tasks, but actually increase the total cognitive power of a group of people to something larger than the sum of their individual capabilities. [Link; soft paywall]
Read Bespoke’s most actionable market research by joining Bespoke Premium today! Get started here.
Have a great weekend!