Bespoke Brunch Reads: 9/12/21
Welcome to Bespoke Brunch Reads — a linkfest of the favorite things we read over the past week. The links are mostly market related, but there are some other interesting subjects covered as well. We hope you enjoy the food for thought as a supplement to the research we provide you during the week.
While you’re here, join Bespoke Premium with a 30-day free trial!
Power Plants
This wildly reinvented wind turbine generates five times more energy than its competitors by Elissaveta M. Brandon (Fast Company)
A Norwegian start-up is experimenting with a modular design for wind turbines that would replace a single very large blade system with a large grid of much smaller units. [Link]
New Orleans Built a Power Plant to Prepare for Storms. It Sat Dark for 2 Days. by Sophie Kasakove and Nicholas Bogel-Burroughs (NYT)
One knock on renewables is that decarbonized forms of power can sometimes be less reliable than coal or natural gas plants. But in the wake of Ida, a backup power plant New Orleans built to insure reliability wasn’t able to help the power-starved city. [Link; soft paywall]
College
College-Town Economy Hopes for a Boost, if Delta Variant Can Be Held at Bay by Amara Omeokwe (WSJ)
Small towns across the country that rely on students arriving for school every fall are geared back up for a more normal school year, but Delta variant cases may dash the hopes of small and large businesses that cater to undergrads across the country. [Link; paywall]
A Generation of American Men Give Up on College: ‘I Just Feel Lost’ by Douglas Belkin (WSJ)
Women now outnumber men in college 3:2, with the decline in students over the last several years mostly driven by fewer men taking classes. Given the persistence of the college wage premium and the historically higher attendance rates for men, this major shift is likely underappreciated as shift in the social fabric of the country. [Link; paywall]
Vaccines
BioNTech reports promising data on mRNA cocktail in mouse models of colon cancer and melanoma by Arlene Weintraub (Fierce Biotech)
Pfizer’s partner for its mRNA COVID vaccine has partnered with Sanofi to deliver mRNA therapies which stimulate carcinogenic factors that are already produced by the human body using an identical delivery package to the one that tricks cells into manufacturing spike proteins and getting a leg up on the coronavirus. [Link]
Job Postings Requiring Vaccination Soar by Ann Elizabeth Konkel (Indeed)
While the number of job postings on Indeed that require vaccination against COVID remains relatively low overall, they’re growing very quickly and have accelerated since full FDA approval of the vaccine. [Link]
Windshield Wipers
Tesla obtains patent on its wild idea to use lasers as windshield wipers by Fred Lambert (electrek)
Patents are of course a long way away from a production feature (even at feature first, perfection later Tesla) but there’s at least some possibility that the most popular electric car company will start using lasers to clean off windshields. [Link]
Platforms
How TikTok Servers Up Sex and Drug Videos to Minors by Rob Barry, Georgia Wells, John West, Joanna Stern and Jason French (WSJ)
Using bot accounts, the WSJ team explored how accounts representing themselves as minors are exposed to adult content by the powerful algorithms which use past interests to dictate what future content gets displayed. [Link; paywall]
Epic v. Apple ruling: Judge finds Apple has to let developers offer third-party payments by Alexis Keenan and Daniel Howley (Yahoo!)
A California judge sided with Fortnite developer Epic Games in a Friday ruling that leveled an injunction against App Store policies which prevent software developers from collecting payments through their apps without giving Apple a cut. [Link; auto-playing video]
Leverage
Bitcoin to Bucks: Crypto Fans Borrow to Buy Homes, Cars—and More Crypto by Rachel Louise Ensign (WSJ)
With more than $2trn in total crypto market cap, holders are starting to use their currencies as collateral for loans of US dollars, which are being used to buy houses, homes, and all manner of other things that are easy to trade for dollars but not so easy to get with crypto. [Link; paywall]
Sports
Fans Don’t See Much of a Difference Among NFL’s Broadcast Partners, Top Talent by Alex Silverman (Morning Consult)
Fans are generally pretty happy with the NFL broadcast teams offered by the major networks, with NBC, CBS, and Fox all about equally popular; ESPN is slightly behind but still viewed favorably by 65% of NFL fans. [Link]
Accents
With Drawl by Laura Relyea (Bitter Southerner)
While often viewed with derision by linguistic philistines, Southern twangs and drawls are accent heaven for those who study how language twists and bends (or holds firm) with the passage of time. NC State professor Walt Wolfram is leading the charge to keep Southern accents alive. [Link]
Taxes
Senior Democrats propose 2% US tax on stock buybacks by James Politi (FT)
Eager to bring on board members of the caucus that are concerned about deficit implications of the Democrats’ $3.5trn proposed budget, Senate Democrats are considering levying a 2% fee on corporate share buybacks as a way to generate revenue. [Link; paywall]
Read Bespoke’s most actionable market research by joining Bespoke Premium today! Get started here.
Have a great weekend!
Most Heavily Shorted Stocks
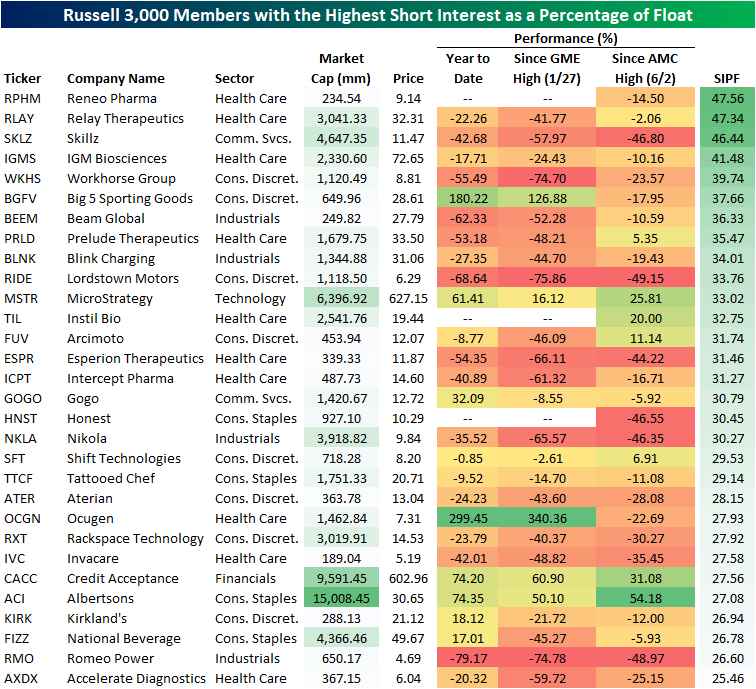
Over the course of 2021, we have seen some aggressive short squeezes, resulting in turmoil for certain financial institutions and millions in profits for some retail traders. The “reddit army” has gone after multiple stocks, most notably Game Stop (GME) and AMC (AMC). Let’s dive into the 25 companies in the Russell 3,000 currently with the highest short interest as a percentage of float. Of these 25 companies, only 8 have experienced positive returns in 2021, and 6 have seen their share price half. Since GameStop peaked in late January, 20 of the companies on this list have lost value, and 9 have seen their equity trade down by 50%. Since AMC’s peak in early June, 7 companies have seen price appreciation, and zero have seen their value decrease by 50%.
The average short interest as a percentage of float for the entirety of the Russell 3,000 is 3.46%, but certain sectors have much higher proportional short interest than others. Consumer Discretionary, Health Care, and Real Estate have the highest, while Utilities, Financials, and Consumer Staples have the lowest. High levels of short interest is a sign of negative investor sentiment, but certain sectors will consistently have higher figures due to the riskiness of their business models.

To dive deeper, let’s look at the average short interest in each industry. Retail, Pharma & Biotech, and Consumer Services have the highest levels, while Banks, Tech Hardware, and Utilities have the lowest levels. The average short interest in the retailing industry is more than three times higher than that of banks for companies in the Russell 3,000.

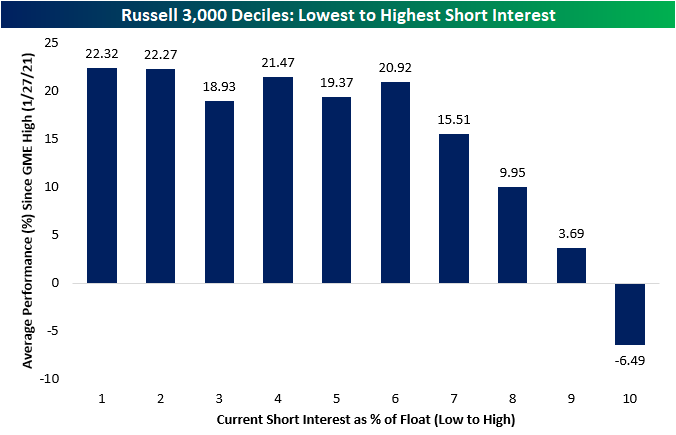
Although there are many exceptions to the rule, in 2021 equities with higher short interest have generally underperformed the remainder of the Russell 3,000. The average return for equities with short interest between zero and ten percent were higher than that of equities with 33%+ short interest.
To support this, let’s undergo a decile analysis. The stocks in the top 20% in terms of short interest have significantly underperformed the rest of the Russell 3,000 since GME hit its highs. While the equities in the bottom 20% of short interest have averaged a 22.23% return since January 27th (GameStop’s top), the top 20% of most heavily shorted stocks have declined by 1.40% on average.
Largest 25 Stocks in the S&P 500, Now vs 20 Years Ago
Yesterday, we took a look at the makeup of the S&P 500’s largest 25 companies in 2021 and compared it to that of 10 years ago. Today, we will be extending the study to 2001, twenty years ago right before the 9/11 attacks. On the day before 9/11, the sectors with the largest number of components in the top 25 in terms of market cap were Consumer Staples, Health Care, Technology, Financials, and Communication Services. While all of these sectors still hold a spot in the current top 25 list, the makeup has shifted substantially. Energy and Industrials, which each accounted for 8% of the top 25 companies in 2001, now have zero representation in today’s list. Consumer Staples also reduced its count from five to two.

Only seven companies that made up the list of top 25 names in September 2001 remain on the list today. Those seven companies are Microsoft (MSFT), J&J (JNJ), Walmart (WMT), Home Depot (HD), Procter & Gamble (PG), Bank of America (BAC) and Pfizer (PFE). The average increase in market cap of these seven equities, excluding dividends, is 241.88% with a median of 263.84%. While the turnover of this list has been high over the last 20 years, every member of this list is still in operation today, but two have been undergone mergers (Time Warner & Royal Dutch Petroleum). Interestingly enough, the members of this list have approximately the same proportionate makeup of the S&P 500, with only a 1.89% increase in the weightings of the top 25 stocks now relative to September 2001.

The US economy today is far different than it was in 2001. As it has changed, some companies have adapted and experienced massive growth, while others have been left in the dust. Apart from the two companies that are no longer independently publicly traded, the average return of the 25 largest companies from 2001 is 92.94% with a median return of 49.08%. Over that same period, the S&P 500 has returned 310.61%.

The Bespoke Report Newsletter — 9/10/21
This week’s Bespoke Report newsletter is now available for members.
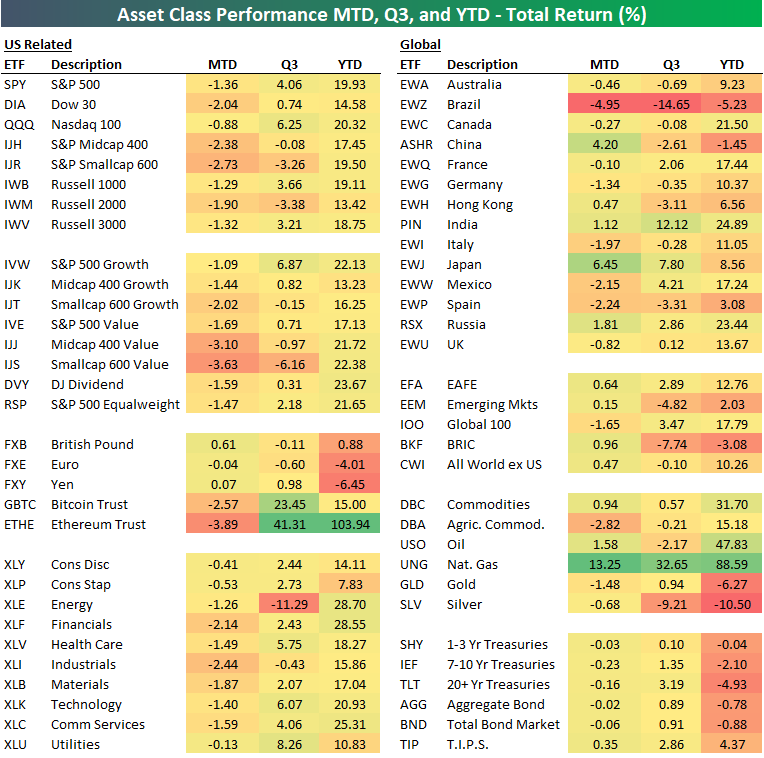
Below we highlight recent performance across a wide range of ETFs representing various asset classes, national equity markets, and US sectors or indices.
To read this week’s full Bespoke Report newsletter and access everything else Bespoke’s research platform has to offer, start a two-week trial to one of our three membership levels.


US Continues to Gain World Market Cap
The S&P 500 has risen around 20% year to date in 2021, and with that rally in US equities more broadly, the United States has gained 1.83 percentage points of total world market cap. The US has consistently dominated in world market cap over the years, and the gains this year mean that the US currently holds a 43.13% share of total world market cap. Since the S&P 500 pre-COVID peak 2/19/20, right before COVID sent the index into a bear market, the US has added 2.27 percentage points to its share of world market cap. The only other country to have also added a significant share of at least one percentage point during that period is China. In early 2020, Chinese equities accounted for only 8.74%, and that share is now sitting at double digits. Those gains have borrowed heavily from countries like Japan, Hong Kong, and the UK which have all seen their share fall by more than half of one percentage point. For Japan and Hong Kong, those losses have primarily come in 2021 whereas the UK has only shed 0.1 percentage points this year. China similarly has seen its share of world market cap pullback this year as government crackdowns have pushed equities lower. Meanwhile, India has seen a decent gain of 0.38 percentage points. Behind the US, India has gained the most this year. Click here to view Bespoke’s premium membership options.

Beige Book Decelerates As Delta Impact Widens
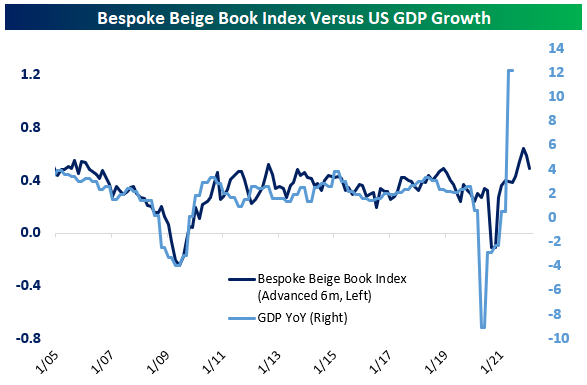
Earlier this week, the Federal Reserve updated its twice-quarterly qualitative assessment of the economy based on conversations with business contacts across the twelve regional districts. For each Beige Book release, we apply a natural language processing algorithm to assess the relative frequency of positive versus negative words, giving us a quantitative comparison of Beige Books over time. As shown in the chart below, our index of Beige Book activity has fallen from record levels recorded back in June to elevated but much more modest levels in September. That’s consistent with the Fed’s description of “moderate” growth thanks to the impact of the Delta variant. Click here to view Bespoke’s premium membership options.

In the second chart below, we show the relationship between GDP growth and our Beige Book Index from above. As shown, the current reading of our index equates to GDP growth of a bit less than 4% YoY. But keep in mind that extreme base effects are still driving wild YoY GDP readings. With that in mind, the Beige Book Index appears to be showing above-trend but decelerating growth, when accounting for base effects of the extremely low GDP reading from Q2 of 2020.
Google Searches Going Against Claims Data
Thursday’s release of initial jobless claims saw a new low for the pandemic with unadjusted claims coming in below 300K for a third week in a row. While that data has set new pandemic lows, Google Trends data on searches for “unemployment” are telling another story. The two series have had a tendency to track one another relatively well, and whereas claims are at new lows, the Google Trends score for “unemployment” has surged in the most recent week’s data. The index has risen seven points to 26 which is the highest level since early June, erasing all of the gains from the late spring and summer. As for the disconnect between the two, there are a couple of potential reasons. The first of which is seasonality. As we noted last week, claims typically tend to rise in the early fall through the end of the year. Another potential explanation for the uptick in search interest for unemployment is Hurricane Ida. While searches for the term in Louisiana haven’t seen a large uptick, searches in the state of New York started to surge last Saturday just after the flooding rains hit the region. If that’s the case, look for an uptick in weekly claims next week. Click here to view Bespoke’s premium membership options.

Largest 25 Stocks in the S&P 500, Now vs 10 Years Ago
In the last 10 years, the composition of the largest 25 companies by market cap in the S&P 500 has changed dramatically. Only 40% of the companies that were in the top 25 in 2011 remain there today. Additionally, the sector breakdown has shifted considerably. Sectors like Technology, Communication Services, and Consumer Discretionary have seen increases in their representation in the top 25 while the Energy, Consumer Staples, and Industrial sectors have seen declines.

Of the companies listed on both the 2011 and 2021 lists, the median total return excluding dividends over the last 10 years has been 312.33%, while the mean total return excluding dividends has been 606.65%. Apple ($AAPL), Microsoft ($MSFT), Alphabet ($GOOGL), and Amazon ($AMZN) have seen the largest appreciation of this group and are currently the four largest companies in the index.

As noted above, just 40% (10) of the companies on the list in 2011 made the cut in 2021, and as shown in the table below, while Apple (AAPL) and Microsoft (MSFT) remain in the top four, Exxon Mobil (XOM) and IBM not only fell out of the top four but also the top 25 altogether. Which top companies on the list now won’t be there in 2031? We wish we had a crystal ball!
Whereas the market cap of the S&P 500 has increased by 270% since 2011, the total value of the four largest companies has increased by 673%. In terms of market cap, the four largest companies account for just over 20% of the entire S&P 500’s market cap, and the 25 largest companies make up 49% of the total. In 2011, by contrast, the four largest companies had a weighting of 10% and the 25 largest accounted for about 36% of the total market cap. Click here to view Bespoke’s premium membership options.

Neutral Sentiment Surge
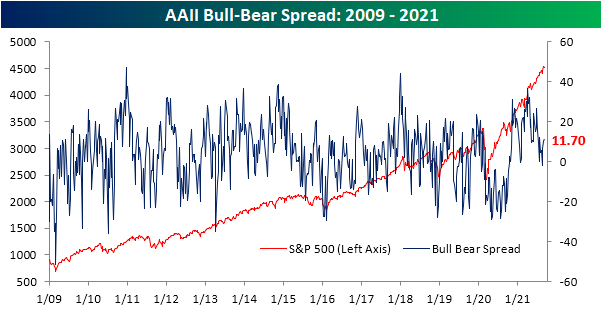
As we noted in today’s Morning Lineup, the S&P 500 has been pulling back over the past week but it has not been a particularly sharp pullback as the index remains within 1% of its all-time high. Bullish sentiment on the other hand has seen a more significant turn lower. The percentage of respondents reporting as bullish to the AAII survey this week fell 4.5 percentage points versus last week. At 38.9%, bullish sentiment is about in line with its historical average of 38%.

That pullback in bullish sentiment was not met with any pickup in bearish sentiment. In fact, bearish sentiment saw an even larger decline, falling 6.1 percentage points to 27.2%. That is the lowest level of bearish sentiment since the end of July.

Given those moves in bullish and bearish sentiment, the bull-bear spread was actually higher this week. The spread rose to 11.7 which is just below the recent high of 12.1 from the final week of July.
Given both bullish and bearish sentiments were lower this week by several percentage points, a large share of respondents shifted to neutral sentiment this week. That reading rose double digits to 33.9%. That is the first time since July 2018 that neutral sentiment has risen at least 10 percentage points in just one week.
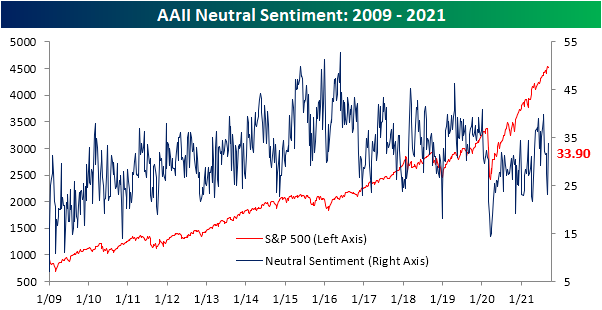
Throughout the history of the AAII survey, it has been rare for neutral sentiment to rise double digits in only one week. Since the survey began in 1987, there have been 85 other times that neutral sentiment has seen such a move. Looking across those instances, the S&P 500 has averaged a move higher over the following months, but returns are typically worse than the norm. Click here to view Bespoke’s premium membership options.

Maybe GameStop (GME) Should Stop Reporting Earnings Altogether
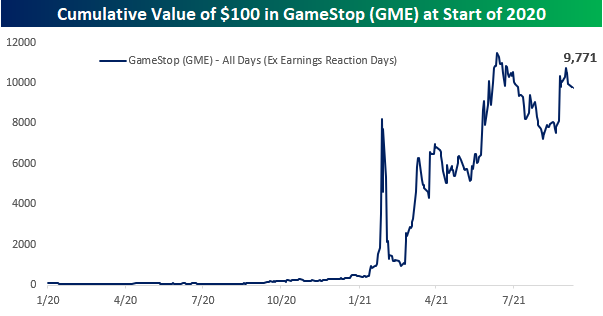
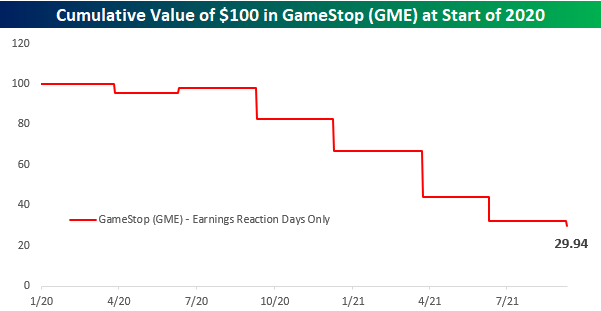
If there were a high scorer list in terms of stock performance since the start of 2020, the letters “GME” would be near the top. One hundred dollars worth of GameStop (GME) at the start of 2020 would currently be worth $2,925!

Today, though, shares of GME are trading down over 7% following a disappointing earnings report after the close yesterday. Given the performance of GME since the start of 2020, you would think that a day like today where the stock trades sharply lower in reaction to earnings would be an outlier. Hardly. Following its six prior earnings reports since the start of 2020 leading up to today, GME has traded lower on its earnings reaction day five times for an average decline of over 16%. The only positive reaction the stock has had in reaction to earnings during this period was a 2.2% gain in June 2020. In fact, going all the way back to September 2018, that June 2020 gain was the only positive earnings reaction day for the stock. How bad have earnings reports been for GME’s stock since the start of 2020? While $100 in GME stock since the start of 2020 is worth nearly $3,000 today, if you only had exposure to the stock on the day of each of its earnings reaction days during this period, that $100 would be worth less than $30 today!
The cumulative effect of GME’s weak reaction to earnings also shows up if you look at its cumulative performance since 2020 and excluding the trading days following GME’s quarterly earnings reports. Not including those seven trading days, $100 worth of GME at the start of 2020 would be worth nearly $10,000 today! Following its earnings conference call after the close yesterday, GME management was criticized for not taking any questions and providing little insight into its strategy moving forward. Based on how the stock has historically reacted to earnings, though, management probably wishes they could just do away with the whole earnings process entirely. Click here to view Bespoke’s premium membership options.