Q3 Asset Class Performance
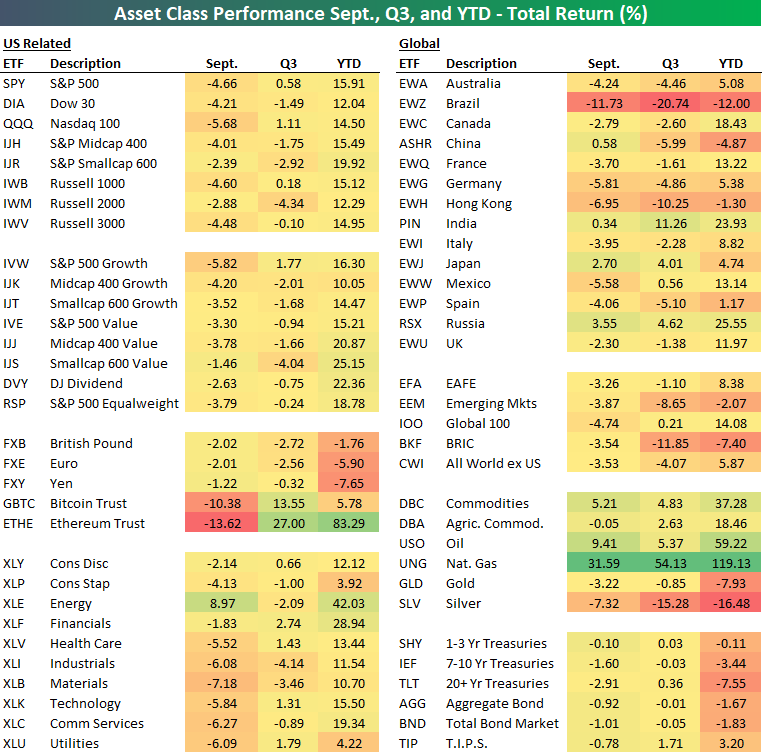
Q3 and the month of September are now in the books, and it was not a great period for US equities. As shown in our asset class performance matrix below, the sole portion of the US equity market that was higher in September was Energy stocks. Every other sector, theme, and major index was lower on the month. As for global equities, performance was more mixed with declines ranging from 11.73% for Brazil (EWZ) to a 3.55% gain for Russia, though, most country ETFs were lower on the month.
Commodities had a good month particularly in the energy space with crude oil (USO) gaining 9.41% and Natural Gas (UNG) rising an astounding 31.59%. That lifted the total gain in Q3 to 54.13% while it has returned almost 120% year to date; the best performer for both time periods. Precious metals, namely silver (SLV), on the other hand, was hit particularly hard. As for cryptos, Ethereum (ETHE) was another top performer YTD and in Q3, but September pared those gains. ETHE fell 13.62% in September while Bitcoin (GBTC) also fell by double-digit percentages. Click here to view Bespoke’s premium membership options.
Bearish Sentiment Back Above 40%
As the S&P 500 continued to decline over the past week, survey results from the American Association of Individual Investors have shown investor sentiment has taken a more negative tone. 28.1% of respondents this week reported as bullish versus 29.9% last week. While lower, that is still several percentage points above the recent low of 22.4% from a couple of weeks ago.

Bearish sentiment picked up the bulk of those losses to bullish sentiment as 40.7% reported pessimistic sentiment this week. That is the highest reading in exactly a year. With bearish sentiment having risen by 13.5 percentage points since the low of 27.2% in the week of September 9th, it is now a full standard deviation above its historical average of 30.55%.
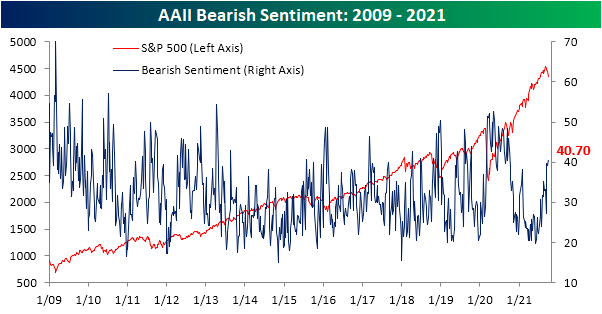
Even though bearish sentiment came in at a new high, the bull-bear spread was only slightly lower at -12.6. That is still above the low of -16.9 from two weeks ago.

Bearish sentiment did not pick up all of the losses to bullish sentiment either. Neutral sentiment was also slightly higher this week gaining 0.2 percentage points.

Other readings on sentiment are also echoing the decline in optimism. One other sentiment indicator, the National Association of Active Investment Mangers’ Exposure Index, has also seen a significant drop this week. This index shows how exposed managers are to equities with a reading of 200 being the max and meaning respondents are leveraged long whereas -200 would be leveraged short. A reading of +100 (-100) would indicate managers are full long (short), and a reading of zero would indicate they are market neutral. The index has fallen in back-to-back weeks now with this week seeing a 22.68 point drop to the lowest level since May. That week over week change also ranks in the bottom 5% of weekly moves going back to the start of the data in 2006, although there have been a handful of similar if not larger drops in the past year like a 26.98 point decline in mid-August and a 40.93 point drop back in May. Now at 55.02, the index indicates managers have stepped back and are far less exposed to equities than they have been for most of the past year. Click here to view Bespoke’s premium membership options.

Pandemic Claims Evaporate
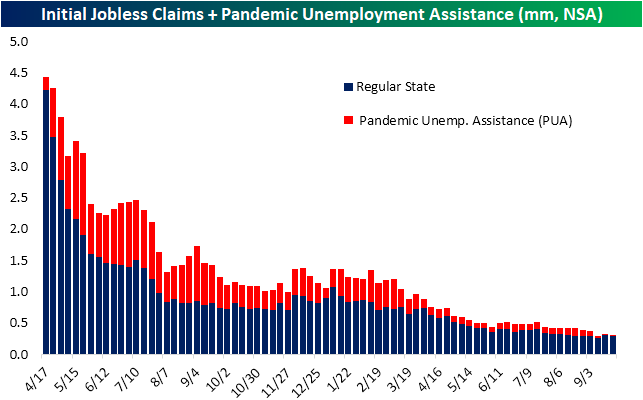
This week’s initial jobless claims number disappointed with a surprise increase to 362K rather than the anticipated 21K decline to 330K. After that increase, claims are at the highest level since the first week of August when total adjusted claims were 15K higher at 377K.

While seasonally adjusted claims were disappointing, the unadjusted number actually improved week over week falling back below 300K. Albeit lower, claims are still off their low of 265.9K from two weeks ago which could be expected given the seasonal tendency for claims to rise at this time of year. With the program’s official end date now a few weeks in the rearview, PUA claims remain muted, but there was actually an increase of early 2K this week.
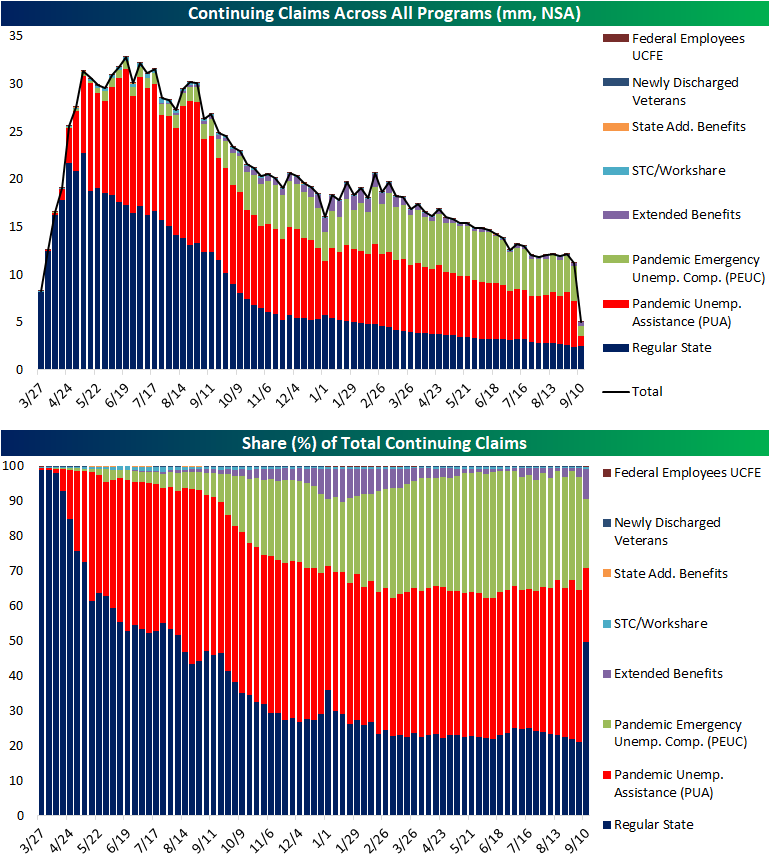
Seasonally adjusted continuing claims fell this week to 2.802 million. Although lower, that was not as large of a decline as expected. That makes for the second-lowest reading of the pandemic outside of the first week of September when continuing claims came in at 2.715 million.

On a non-seasonally adjusted basis and including all auxiliary programs creates a couple of weeks of lag to the data making the most recent reading through September 10th. That was the first week of data to encapsulate the end of pandemic programs, and the drop was significant. Total claims across all programs were more than cut in half falling 6.22 million to 5.03 million. As could be expected, declines in PUA and PEUC claims drove that decline with the two programs shedding a combined 6.49 million claims. That being said, these two programs still have a total of over 2 million claims left on the table and likely to fall off over the coming weeks. Click here to view Bespoke’s premium membership options.
How Has the 10 Year Yield Historically Correlated to Growth Stock Performance?
Recently, all it seems investors can talk about is the relationship between the performance of growth stocks and interest rates. The general idea is that rising yields have a negative impact on the performance of growth stocks as the risk-free rate of return increases and future cashflows for high-growth companies are discounted at a higher rate. To highlight this relationship, today we wanted to take a look at a comparison between the relative strength of the Vanguard Mid Cap Growth ETF (VOT) versus the Vanguard Value ETF (VOE) versus the yield on the 10-year US Treasury.
Looking first just at the relationship between the two this year, the chart below shows the relative strength of growth vs value (blue line) compared to moves in the 10-year US Treasury (red line). When the blue line is rising, it indicates that growth stocks are outperforming value and vice versa. For pretty much the entire year, when yields have moved higher, growth stocks have underperformed, but when yields have pulled back, growth stocks start to lead the market. Over the last several days, the inverse relationship has been even more pronounced where the two lines have completely moved in the opposite direction. For this year at least, higher interest rates have been kryptonite for growth stocks.

The chart below is the same as above but goes all the way back to 2010 instead of just this year. Looking at the chart, while there were periods of inverse correlation in the early and mid-2010s, the trend really didn’t fully take hold until late 2018/early 2019. Since then, when rates have fallen, growth has outperformed and vice versa.

The inverse correlation has reached extreme levels this year. The chart below shows the correlation coefficient between the daily ratio of the VOT (mid-cap growth) versus VOE (mid-cap value) versus the yield on the 10-year US Treasury. Since 2010, there have been five years where the correlation coefficient was positive and in only three of those years was the positive reading anything more than negligible (2012, 2015, and 2018). In each of the past three years, what we’ve seen is the inverse correlation only intensify. Back in 2019, the only other year before that where the inverse correlation was more pronounced was in 2016, but then 2020 saw what was at the time the most inverse correlation since 2010. Based on this year’s relationship, though, 2020’s record may not last long. Through Tuesday’s close, the correlation coefficient between the relative strength of growth stocks and the 10-year yield was -0.87. While the inverse relationship between growth stock performance and interest rates may not continue to be as pronounced as it is now in the future, any continued increase in long-term interest rates is likely to act as a headwind for the performance of growth stocks. Click here to view Bespoke’s premium membership options.

Richmond Back in the Red
The fifth and final manufacturing survey for the month of September from the regional Federal Reserve banks was released this morning, and it did not end the month on a high note. The Richmond Fed’s headline reading fell into contractionary territory this month for the first time since May 2020 as the index dropped 12 points month over month falling from +9 down to -3. Relative to all the other regional Fed reports, Richmond only Richmond reported contraction in September.
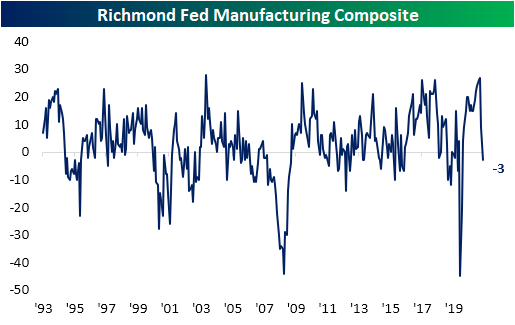
The 12 point decline month over month in the headline reading was significant ranking in the bottom 5th percentile of all monthly moves. But it was actually a smaller decline than last month when the index dropped 18 points. Regardless, the 30-point combined decline over the past two months is the second largest on record behind the 38 point drop in April of last year.
Factoring into that headline weakness, most of the categories of the report were also lower month over month. Given those declines, most readings are also now in the bottom end of their historical ranges with some exceptions. Order Backlogs, Vendor Lead Times, Equipment and Software Expenditures, Employees, Wages, and price indices are all still in the upper decline of readings.
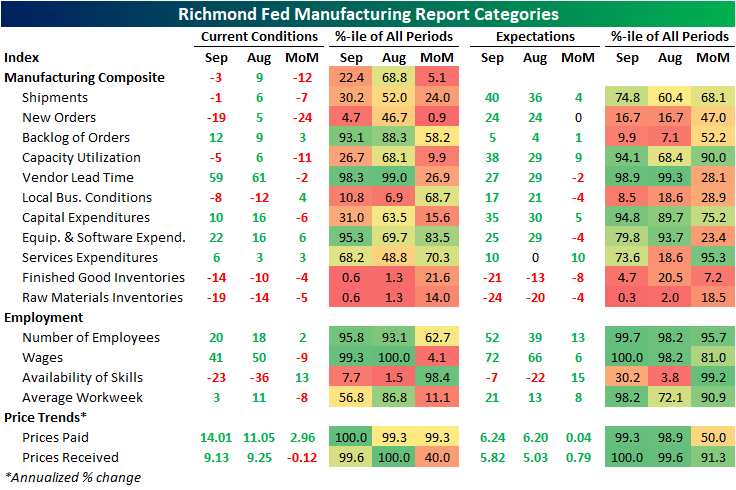
By far the largest decline in September was for New Orders. That index plummeted 24 points versus August for the fourth-largest decline on record and putting the index in the bottom 5% of its historical range. In other words, demand slammed on the brakes in September. In spite of that decline, expectations have held up relatively well at 24; unchanged month over month. Shipments also fell into contraction albeit less dramatically. Meanwhile, Vendor Lead Times improved as the index fell 2 points, but that remains an extremely elevated reading indicating continued pressures on supply chains.

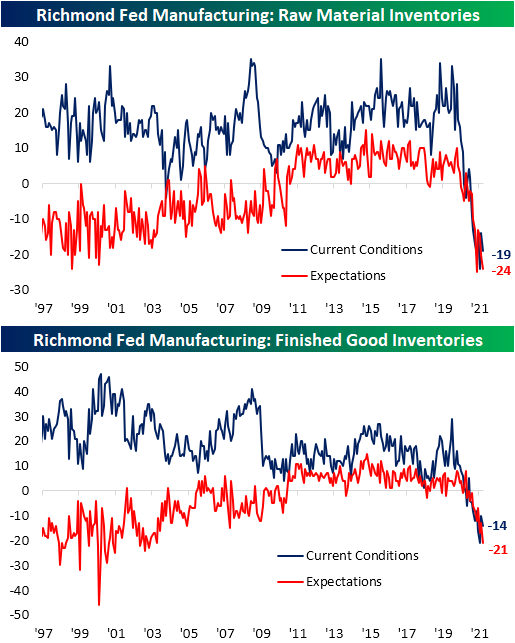
One potential reason for shipments having pulled back is a complete lack of inventories. Both readings on raw materials and finished good inventories fell month over month and are at historically depressed levels across both current conditions and expectations.
Indices tracking employment were perhaps the healthiest area of the report. The index tracking the Number of Employees edged higher to 20 while expectations saw an even larger jump, stopping just short of a record high. Wages, meanwhile, declined 9 points from a record high. That reading is still the third-highest on record, though, and expectations were at a record high. While the Average Workweek index was also lower MoM, there has been another improvement in the number of firms reporting a lack of availability of skilled workers.

The other area of the report to touch records this month concerned prices. Prices paid came in at a new high with prices increasing 14% annualized. Prices Received were slightly lower at 9.13%, but that is well above other readings throughout the survey’s history and the expectations index set another record. Click here to view Bespoke’s premium membership options.

September 2020 vs 2021
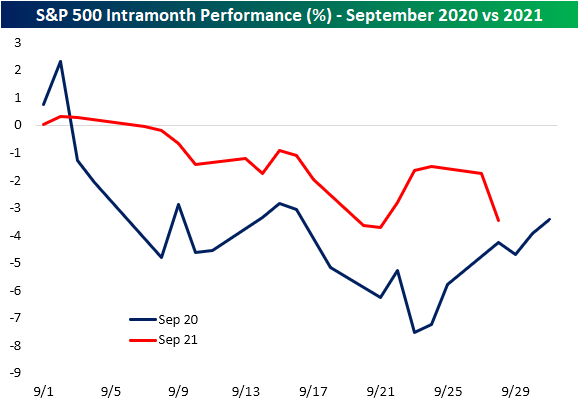
September 2nd of last year marked a notable turning point for the US equity market. The S&P 500 put in a short-term peak on that date and it also marked the beginning of what we dubbed “The Big Shift”. That shift was marked by the outperformance of value over growth and solid breadth with the equal-weight S&P 500 outperforming the market-cap weighted index. Fast forward one year, and yet again the close on September 2nd has marked the recent high for the S&P 500 as shown below. In addition to the highs coming on the same day, some of the intra-month patterns are also similar including a small rally in the middle of the month. With that said, the declines last year were more severe, especially at the start of the month, and this year has not seen a consistent rally into month’s end as was the case in 2020.
As previously mentioned, one of the most notable changes of the Big Shift last September 2nd was a reversal of a long-term trend of growth’s outperformance. Growth’s outperformance versus value peaked on September 2nd last year, and it also peaked in early September this year as well. Below is a chart showing the relative strength of growth versus value since the COVID Crash low for the broad market last March 23rd. A rising line means growth is outperforming, while a falling line means value is outperforming. The months of September 2020 and September 2021 (through 9/28) are highlighted in red. As you can see, growth peaked versus value at the beginning of September of both 2020 and 2021 after a period of sharp outperformance in the months prior. September 2020 was only the start of value’s outperformance, which continued up until this spring when growth began to outperform again. It remains to be seen if the same “value” trade will now continue in the months ahead like it did last year, but it’s certainly interesting how similar the growth/value trade has been this September versus last September. Click here to view Bespoke’s premium membership options.

End to Supply Chain Issues Gets Pushed Back
In an earlier post, we highlighted the details of today’s manufacturing survey from the Dallas Fed. One more area to note in the report is supply chains. The index for Delivery Times remains off its peak from March, but this month experienced a small uptick to 21.4. That remains well above any historical precedence prior to the pandemic. Additionally, the expectations index for Delivery Times rose 9.9 points which ranks in the top 4% of all month-over-month moves. In other words, the Dallas Fed’s survey showed the region’s manufacturers neither reported improvement in supply chains nor did they report an optimistic outlook on the matter.

The special questions of this month’s survey added further fuel to the fire. As shown below, the regional bank asked “When do you expect supply chains to return to normal?” This question was first asked back in June of this year. Back then 71.8% of respondents reported that they expected the issues to resolve themselves within 9 months. But three months later, the answers to the same question had a more pessimistic tone. The entire distribution shifted, meaning a larger share of businesses expect supply chain problems to linger around longer. In fact, this time around only 58.7% reported expecting things to get back to normal within 9 months. Meanwhile, those expecting these issues to last 10 to 12 months jumped 8.1 percentage points and nearly 5 percentage points more expect the issues to last for more than a year. Click here to view Bespoke’s premium membership options.

Dallas Drop
The fourth of five regional Fed manufacturing surveys came in this morning from the 11th district in Dallas. Whereas the New York and Philly Fed saw strong readings earlier this month, the Kansas City Fed and now the Dallas Fed’s survey were less positive. The Dallas Fed’s index fell to 4.6 versus expectations for an increase to 11.
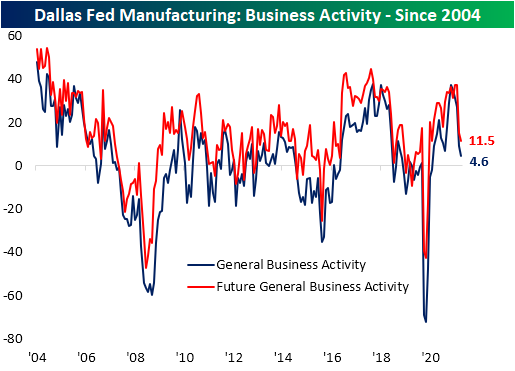
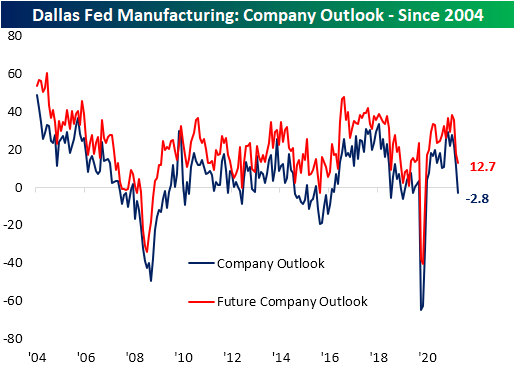
While the headline index was lower, it remained in expansionary territory in the middle of its historical range. The majority of other categories throughout the report also remain in expansion and are even at historically high levels with many in the upper decile of readings. The only real outlier was the index for Company Outlook.

The Company Outlook index plummeted 14.3 points month over month which is the seventh-largest decline of any month on record. That massive decline brought the index to its first negative reading since May of last year.
While the readings are still showing expansion, indices covering order volumes were also weaker versus August. Orders are growing at the weakest pace since last July, but on the bright side, shipments improved slightly to 18.7 in September. Paired with the slowed pace of new orders, the index for Unfilled Orders pulled back to the lowest level since February. While that means that businesses are likely working off backlogs, the index remains in the upper 5% of readings well above anything observed prior to the pandemic.

After falling back in July, Prices Paid continued to bounce back reaching 80.4 this month. That is only 0.4 points below the record high from back in June. Prices Received, meanwhile, set a new record high after gaining another 5.9 points.

Even though those prices continued to rise, Wages and Benefits saw another decline in September. That index peaked at 48.1 this past June and has declined to 42.7 in the months since then. That being said, the current level of the index is well above any other reading outside the past several months. In other words, companies are reporting that they are continuing to raise wages at a rapid pace. Meanwhile, if the rise in wages and benefits is not evidence of labor market tightness enough, employment also saw a modest pickup. That index rose 4.4 points to the highest level in five months when it was at a record. Although that indicates a modest acceleration in hiring, employers are looking to take on far more workers. The expectations index for this category rose to a record high in September; the only expectations index to do so.Click here to view Bespoke’s premium membership options.

Bespoke Brunch Reads: 9/26/21
Welcome to Bespoke Brunch Reads — a linkfest of the favorite things we read over the past week. The links are mostly market related, but there are some other interesting subjects covered as well. We hope you enjoy the food for thought as a supplement to the research we provide you during the week.
While you’re here, join Bespoke Premium with a 30-day free trial!
Sports & Crypto
Sports Fans Are Into Cryptocurrency, and Brands Are Capitalizing by Alex Silverman (Morning Consult)
A new survey of Americans suggests that sports fans are much more likely to be familiar with cryptocurrency and other digital assets than the population as a whole, suggesting a valuable vein of marketing potential. [Link]
Golfer Tiger Woods joins NFT craze, releases 10,000 digital images to be sold through company co-founded by Tom Brady by Tom VanHaaren (ESPN)
Tiger Woods will attempt to monetize his career accomplishments via Tom Brady’s company Autograph. The NFTs are available via the DraftKings marketplace. [Link]
Regulation
Treasury unleashes cryptocurrency sanctions to fight ransomware by Sam Sabin and Victoria Guida (Politico)
This week Treasury announced stepped-up enforcement against crypto exchanges and cryptocurrencies that are used in ransomware attacks. An initial round of sanctions targeted Russian crypto exchange Suex. [Link]
Justice Department Files Antitrust Suit Challenging American-JetBlue Alliance by Brent Kendall and Alison Sider (WSJ)
An agreement between American and JetBlue to limit head-to-head competition in hub airports throughout the Northeast is being investigated by the Department of Justice on anti-trust grounds. [Link; paywall]
COVID
Pregnant Women Who Get COVID Vaccine Pass Antibodies to Newborns (HealthDay News)
An NYU study showed that all 36 newborns tested at birth for COVID-19 antibodies from their vaccinated mothers had immune systems primed for the virus, a major endorsement of vaccination for pregnant women. [Link]
‘Post-Vax COVID’ Is a New Disease by Katherine J. Wu (The Atlantic)
Some diseases that we already vaccinate against continue to infect vaccinated people, but in a modified, much less dangerous form. COVID is likely to move the same direction over time, remaining a burden on vaccinated people but ultimately a much less deadly one. [Link]
Renewables Finance
EXCLUSIVE White House backs plan for renewable energy industry tax partnerships by Jarrett Renshaw and Laura Sanicola (Reuters)
Carbon-intensive energy infrastructure is often owned by master limited partnerships, which confer significant tax advantages. The Biden administration is reportedly considering the creation of a similar set of vehicles for renewables energy production and distribution. [Link]
Europe’s Big Climate Reveal Gets Stuck on Sovereign Bonds by Frances Schwartzkopff and John Ainger (Bloomberg)
The EU is requiring disclosure from asset managers on how much of their portfolios are invested in environmentally sustainable activities. But government bonds aren’t included in the disclosure requirements, leading to a strange grey area for the largest chunk of the European bond markets. [Link; soft paywall]
A huge new city is being built in the US desert – but is it just greenwashing? by Ed Cunningham (TimeOut)
A billionaire’s plan to create a city of 5 million in the arid western United States is either a stroke of genius or a vanity project run horrifically amuck. [Link]
Natural Disasters
The Long-Lost Tale of an 18th-Century Tsunami, as Told by Trees by Max G. Levy (Wired)
A 9.0 magnitude quake before the arrival of Captain Cook in the Pacific Northwest recked havoc on the region, leaving a massive impact on the growth of Douglas Firs which still stand today. [Link; soft paywall]
Economic Research
Why Do We Think That Inflation Expectations Matter for Inflation? (And Should We?) by Jeremy B. Rudd (Federal Reserve Finance and Economics Discussion Series)
A scathing review of the widespread presumption that inflation expectations are a key source of future inflation, raising the possibility of significant policy errors. [Link; 27 page PDF]
E-Commerce
FedEx, UPS Rate Rises Are Making Online Shopping More Expensive by Paul Ziobro (WSJ)
Large shipping companies are raising prices in coming weeks with FedEx announcing a 6% cost hike; UPS and FedEx typically raise prices at about 5% per year. [Link; paywall]
Read Bespoke’s most actionable market research by joining Bespoke Premium today! Get started here.
Have a great weekend!
The Bespoke Report Newsletter – 9/24/21 – Turning Points In Markets, The Economy, And Policy
This week’s Bespoke Report newsletter is now available for members.
Whether you look at the earnings outlook, macroeconomic data, or the policy backdrop, we’ve reached a turning point in the trends that have defined the recovery from the COVID recession. We discuss all in detail in the latest edition of The Bespoke Report along with analysis of inflation and the ten year yield, cryptocurrencies, an update on our Death By Amazon and Amazon Survivors indices, events in China this week, housing market data this week, analysis of the Federal Reserves Q2 Flow of Funds report, and more.
To read this week’s full Bespoke Report newsletter and access everything else Bespoke’s research platform has to offer, start a two-week trial to one of our three membership levels.

