FANG+ Bounce Back
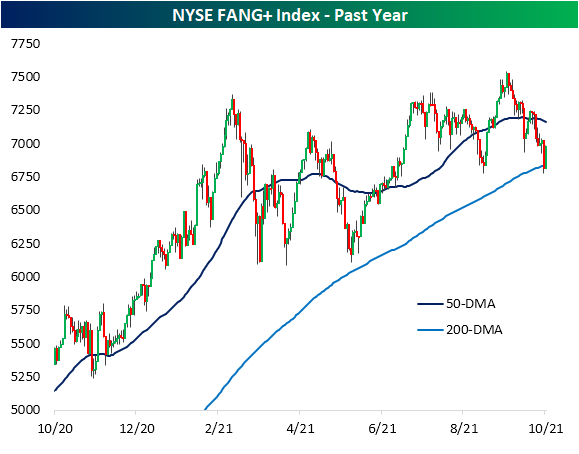
Facebook (FB) remains in the news today as former employee Frances Haugen testifies before a Senate panel. The stock is bouncing back a bit after steep declines yesterday that came on the same day that most of the company’s websites and apps went dark for hours on end. That goes for the rest of the FANG cohort as well. As shown below, the NYSE FANG+ Index closed below its 200-DMA for the first time in 378 trading days yesterday. While it has not recovered all of yesterday’s losses with an inside day, the group is bouncing back significantly. In the process, the FANG+ Index has moved back above its 200-DMA.
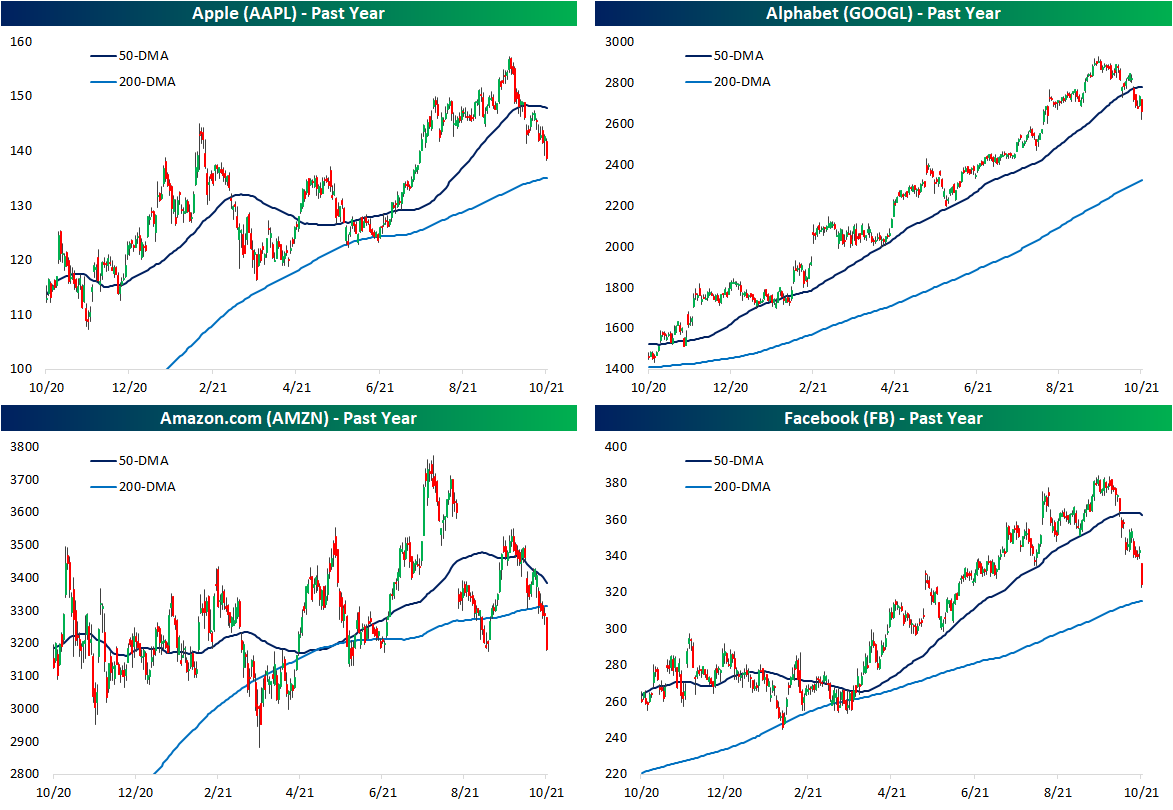
Amazon (AMZN) and Facebook (FB) are similarly seeing inside days today recovering some of yesterday’s declines. For AMZN, the bounce comes around support at the low end of the past year’s range. Meanwhile, for FB, the bounce comes in a bit of no man’s land in the middle of the range between its 50 and 200-DMAs. Similarly, Apple (AAPL) and Alphabet (GOOGL) are also now trading in between their 50 and 200-DMAs. Click here to view Bespoke’s premium membership options.

Crude and Natural Gas Break Out
In an earlier post, we noted the long-term breakout of cotton futures in the context of what has been a historic short-term run. Elsewhere in the commodities space, there are other breakouts occurring today. As shown in the first chart below, crude oil took out its July intraday high of $76.98 yesterday and it has continued to move above those levels today. While crude oil is now within one dollar of $80, natural gas is also hitting a new high as the commodity continues to surge on supply concerns as we discussed in today’s Morning Lineup.

As both commodities rapidly trend higher, comparing the two, natural gas comes out as the clear winner recently. In the chart below we show the ratio of front-month crude oil futures to natural gas futures. When the line is rising, oil is outperforming natural gas. When the line is falling (as it is now), natural gas is outperforming oil. Since this past March, the ratio of the two has been in a steady decline and it is now at the lowest levels in a little under one year. Prior to that, the only lower readings in the ratio of the past five years was when crude prices went negative in April 2020 and in November 2018. Click here to view Bespoke’s premium membership options.

Performance Through Q3 And its Impact on Q4 Performance
Every year, the makeup and number of sectors that outperform the S&P 500 changes. This year, four sectors (Energy, Financials, Real Estate, and Communication Services) outperformed the S&P 500 through the end of Q3, while last year it was only three sectors that outperformed in the first three quarters of the year (Technology, Consumer Discretionary, and Communication Services).
As we all know, past performance does not indicate future performance, and in looking at sectors that have outperformed the S&P 500 in the first three quarters of prior years compared to how they performed in Q4, the same holds true. The table below lists the number of sectors that outperformed and underperformed the S&P 500 in the first three quarters of each year since 2000 and then shows their median performance during Q4 of the same year. Looking at a summary of the annual results, it’s almost a coinflip as to whether or not the leading sectors in the first three quarters of a given year will continue to outperform in Q4. On average, the sectors that outperform YTD through 9/30 have averaged a Q4 gain of 3.58% (median: +6.40%) with positive returns 76% of the time. Sectors that lag the S&P 500 in the first three quarters of the year average a rest of year gain of 3.67% (median: 5.95%) with gains 71% of the time. While the term ‘strength begets strength’ has historically been applicable to the broader market, at the sector level, buying the YTD winners (or losers) ahead of Q4 in expectation of continued momentum to close out the year (or a mean reversion bounce) hasn’t offered any material outperformance. Click here to view Bespoke’s premium membership options.

Bespoke’s Consumer Pulse Report – October 2021
Cotton Catches Fire
There is another commodity that can now be added to the list of assets that have experienced wild swings this year. Reminiscent of lumber earlier this year or natural gas more recently, in the agriculture space, cotton has experienced an explosive move to the upside. As shown below, front-month futures were already seeing a solid move higher since last year’s lows. But in the 12 trading days since the recent low on September 20th, cotton has surged over 20%. As of this writing, that leaves the commodity at the highest level in a little over a decade as it has broken out above the May 2014 and June 2016 highs.
Going back since 1990, there are not many examples of cotton rallying over 20% in the span of only 12 sessions; especially in more recent history. As shown in the second chart below, this is the first +20% rally in 12 days since June 2012 when cotton rose 28.38%. Going back over the decade leading up to that occurrence, there were a handful of other rallies of the same size if not larger.

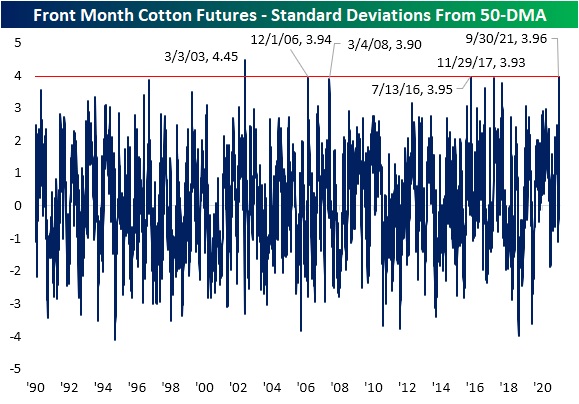
Given the rapid rise in cotton prices, the commodity is now very extended relative to its 50-DMA. In fact, there has only been one time since 1990, March 2003, when cotton was as extended above its 50-DMA as measured in standard deviations. With that said, there were some instances in which the overbought reading was at least similar though. For example, November 2017, July 2016, March 2008, and December 2006 also saw cotton move to over 3.9 standard deviations above its 50-DMA as is the case today.
Given the surge in prices, speculator positioning around the commodity is overwhelmingly long. Data from the CFTC’s Commitment of Traders report—which we also reviewed with regards to other assets in last night’s Closer—shows the percent of open interest for cotton futures is currently 40.97% net long. That is the highest and first reading above 40% since the week of July 2018. It also ranks in the top 2% of all readings on record going back to 1986. In other words, speculators broadly have held a positive outlook on cotton and they have been proven correct.

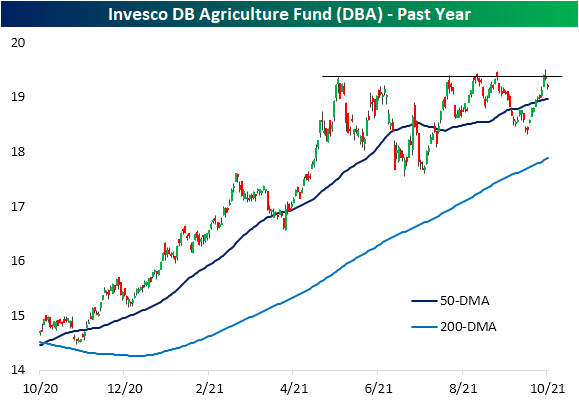
As for agricultural commodities more broadly, cotton has not necessarily boosted the aggregate space. The Invesco DB Agriculture Fund (DBA) which tracks 10 agricultural commodities including cotton has remained in consolidation over the past several months with a failed attempt to break out of that range only a couple of days ago. As for why the surge in cotton has not also led to a surge in DBA is that the commodity has a relatively low weighting accounting for just over 3% of net assets tying it with Feeder Cattle for the smallest weighted future of the ten tracked by the fund. Click here to view Bespoke’s premium membership options.
200-DMA Breakdown for FANG+
Mega cap tech tracked by the NYSE FANG+ index is getting crushed today and is down 3.2% for its worst single-session since May 10th when it fell 3.6%. One key difference between today and then is the technical damage done from a charting perspective. Today’s drop brings the FANG group below its August 19th low and more importantly below its 200-DMA. That marks the first close below its 200-DMA in 378 trading days. While the index does not have the most extensive history dating back to only to 2014, that makes for the second-longest such streak on record behind one that lasted 573 days ending almost exactly three years ago to the day.

Panning over the largest of the FANG stocks by market cap, most are still above their own 200-DMAs with the exception of Amazon (AMZN). Like the index, each of these names have been breaking down a bit from a technicals standpoint. In the case of Facebook (FB) and Alphabet (GOOGL), long-term uptrends are now broken. In tonight’s Closer, we illustrate the impact that the decline of these stocks have had on the S&P 500. You can read more about the FANG breakdown and more in tonight’s Closer with a two-week Bespoke Institutional trial.
First and Second Day of The Quarter Volatility
It’s only been two trading days, but Q4 has already started off on a volatile note. On the first day of the quarter last Friday (10/1), the S&P 500 rallied 1.15%. Today, though, last Friday’s gains have been more than erased as the S&P 500 is down 1.2%. A rally of more than 1% on the first trading day of a quarter is not that uncommon as it has happened just over 20% of the time since 1990. Since 1990, though, this quarter is on pace to be just the third time that a quarter has started with a 1%+ gain only to be followed by a 1%+ decline. The first occurrence was at the start of Q3 in 2000 just after the dot-com bubble burst. The only other occurrence was just over two years later at the start of Q4 2002 just as the 2000 – 2002 bear market was ending. Given the small sample size and the completely disparate paths of the S&P 500 following both periods, there’s really not much you can read from these two occurrences except perhaps that they were both periods of extreme volatility for the equity market.

As far as the inverse situation is concerned, there are more occurrences when the S&P 500 dropped 1% on the first day of a quarter only to rally 1%+ the following trading day. Since 1990, this has occurred seven times. Occasionally, this signifies the bottom of a market pullback, such as April of 2020, April of 2018, October of 2011, and October of 1998. Click here to view Bespoke’s premium membership options.

Global Auto Stocks Strong Despite Weak Sales
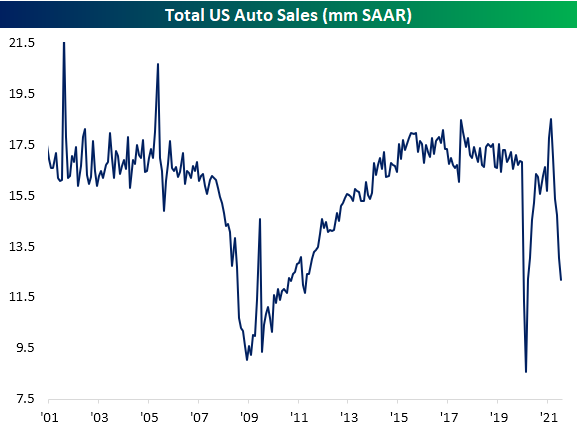
Throughout the day on Friday, quarterly US vehicle sales figures from WARD’s Automotive Group were released. In aggregate, US sales continue to plummet likely more as a result of supply constraints and low inventories. Total sales came in at 12.18 million SAAR versus expectations and a previous reading of at least 13 million.
Delving into which brands are the most prominent, below we show the percentage share of Q3 sales that can be attributed to each brand. As shown, Toyota (TM) topped the list in the third quarter by a wide margin accounting for 16.63% of total sales versus 13.02% for the next highest brand: GM (GM). Stellantis (STLA), Ford (F), and Honda (HMC) are the only other brands that accounted for a double-digit share of total sales. Of those, only Honda and Toyota saw their share grow versus before the pandemic with the latter seeing much larger growth. While those brands make up a larger share of total sales than they did at the end of 2019, they are not the ones to have seen the largest growth year over year. Tesla (TSLA) holds that title with sales up 30% YoY. Mazda, Hyundai, Volvo, Kia, BMW/Mini Cooper, and Toyota are the only other brands to have grown year over year.

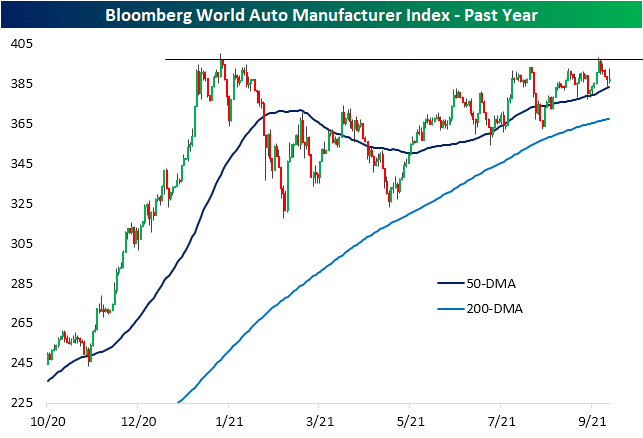
In spite of the massive drop in aggregate sales, the stocks of these global auto manufacturers have held up well, especially relative to the broader market as the S&P 500 is now down 5.4% from its 52-week high. As shown below, at the end of September, Bloomberg’s World Auto Manufacturer Index stopped short of its 52-week high set on January 25th. Currently, the index is down roughly 2.16% from those levels, but it also appears to be finding support at its 50-DMA as it has a handful of other times over the past several months. The strength in the auto stocks in the face of weak sales suggests that investors know the drop in sales is due to supply issues instead of demand issues, and they expect those supply issues to be resolved at some point. Click here to view Bespoke’s premium membership options.
Bespoke Market Calendar — October 2021
Please click the image below to view our October 2021 market calendar. This calendar includes the S&P 500’s average percentage change and average intraday chart pattern for each trading day during the upcoming month. It also includes market holidays and options expiration dates plus the dates of key economic indicator releases. Start a two-week free trial to one of Bespoke’s three research levels.

Silver Gets Back in the Backseat
Gold and silver are two precious metals typically used as investment vehicles for diversification and as a hedge against the dollar. Because gold and, to a lesser extent, silver don’t have a lot of industrial utility, prices are often defined by the value the consumer is willing to pay. In times when the dollar is weakening, investors have typically rushed to ‘safe havens’, a category that precious metals tend to fall in.
While it would be reasonable to expect gold and silver to trade similarly, that hasn’t necessarily been the case over the last decade. Using the two ETFs that track the metals (gold- GLD and silver- SLV) as proxies, while they have been positively correlated, gold consistently outperformed silver from the beginning of 2013 right up through the start of 2020. The lower chart shows the relative strength of GLD versus SLV over the last 10 years. In it, a rising line indicates outperformance on the part of GLD while a falling line indicates SLV outperforming GLD.
With the outbreak of COVID, gold’s relative strength versus silver went parabolic in March 2020 but quickly pulled back thereafter. As optimism over economic growth surged in the months after the economic lockdowns, silver continued to outperform gold through the first quarter of this year. However, as economic expectations have started to reset as the re-opening hasn’t been as smooth as originally hoped, silver has once again taken a back seat to gold. Even as both have declined over the last few months, as shown in the top chart, the drop in silver has been larger than gold. Given that it has at least some industrial utility, silver’s relative strength versus gold tends to be impacted more by sentiment regarding economic growth. Read Bespoke’s most actionable market research by joining Bespoke Premium today! Get started here.

